Which of the following may be representing graph between number of scattered particles detected (N) and scattering angle(θ) in Rutherford's experiment?


The correct Answer is:B
To determine the graph representing the relationship between the number of scattered particles detected (N) and the scattering angle (θ) in Rutherford's experiment, we can follow these steps:
Step 1: Understand the Relationship
In Rutherford's gold foil experiment, the number of particles scattered at an angle θ is inversely related to the sine of the angle raised to the fourth power. Mathematically, this can be expressed as:
N∝1sin4(θ)
Step 2: Analyze the Behavior of the Function
As θ approaches 0, sin(θ) approaches 0, which means that sin^4(θ) also approaches 0. Consequently, 1sin4(θ) approaches infinity. Therefore, at θ = 0, the number of detected particles (N) becomes infinitely large.
Step 3: Examine the Range of θ
The angle θ varies from 0 to π (0 to 180 degrees). As θ increases from 0 to π, sin(θ) increases from 0 to 1 and then decreases back to 0. This means that sin4(θ) will initially increase, leading to a decrease in N until it reaches a maximum point, after which N will decrease again as θ approaches π.
Step 4: Sketch the Graph
1. At θ = 0, N approaches infinity.
2. As θ increases from 0 to π/2, N decreases.
3. At θ = π/2, N reaches a minimum value.
4. As θ continues to increase towards π, N increases again but remains finite.
The graph will start from infinity at θ = 0, decrease to a minimum at θ = π/2, and then increase again as θ approaches π, but will not reach infinity again.
Step 5: Conclusion
The graph representing the relationship between the number of scattered particles detected (N) and the scattering angle (θ) will show a trend starting from infinity, decreasing to a minimum, and then increasing again, resembling a curve that approaches the axes but never touches them.
In Rutherford's gold foil experiment, the number of particles scattered at an angle θ is inversely related to the sine of the angle raised to the fourth power. Mathematically, this can be expressed as:
N∝1sin4(θ)
As θ approaches 0, sin(θ) approaches 0, which means that sin^4(θ) also approaches 0. Consequently, 1sin4(θ) approaches infinity. Therefore, at θ = 0, the number of detected particles (N) becomes infinitely large.
The angle θ varies from 0 to π (0 to 180 degrees). As θ increases from 0 to π, sin(θ) increases from 0 to 1 and then decreases back to 0. This means that sin4(θ) will initially increase, leading to a decrease in N until it reaches a maximum point, after which N will decrease again as θ approaches π.
1. At θ = 0, N approaches infinity.
2. As θ increases from 0 to π/2, N decreases.
3. At θ = π/2, N reaches a minimum value.
4. As θ continues to increase towards π, N increases again but remains finite.
The graph representing the relationship between the number of scattered particles detected (N) and the scattering angle (θ) will show a trend starting from infinity, decreasing to a minimum, and then increasing again, resembling a curve that approaches the axes but never touches them.
Similar Questions
Knowledge Check
Which of the following inequalities represents the graph shown below on the real number line ?
 A0<x<5B0<x≤4C−2<x≤4D1≤x≤4
Which of the following graph represents correct graph for SN1 reaction :
A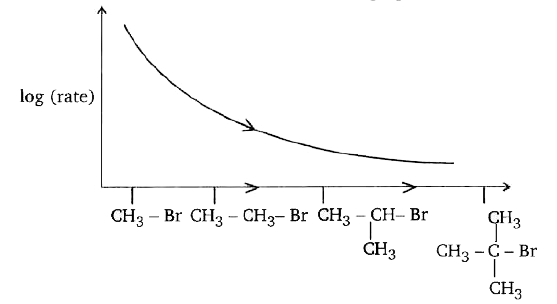 B
B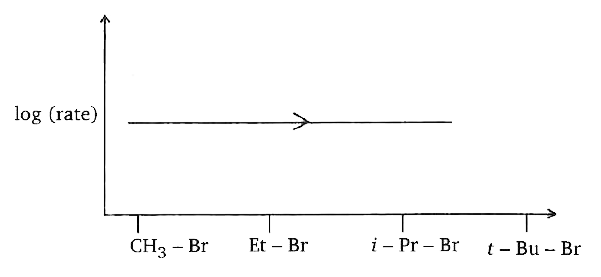 C
C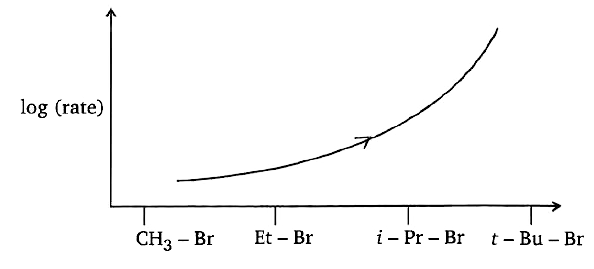 D
D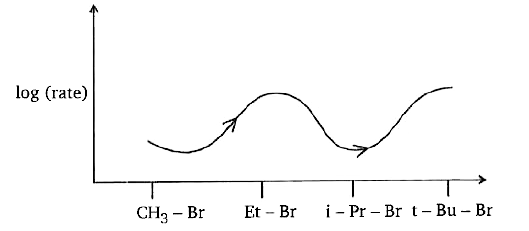
Which of the following graphs cannot possibly represent one dimensional motion of a particle?
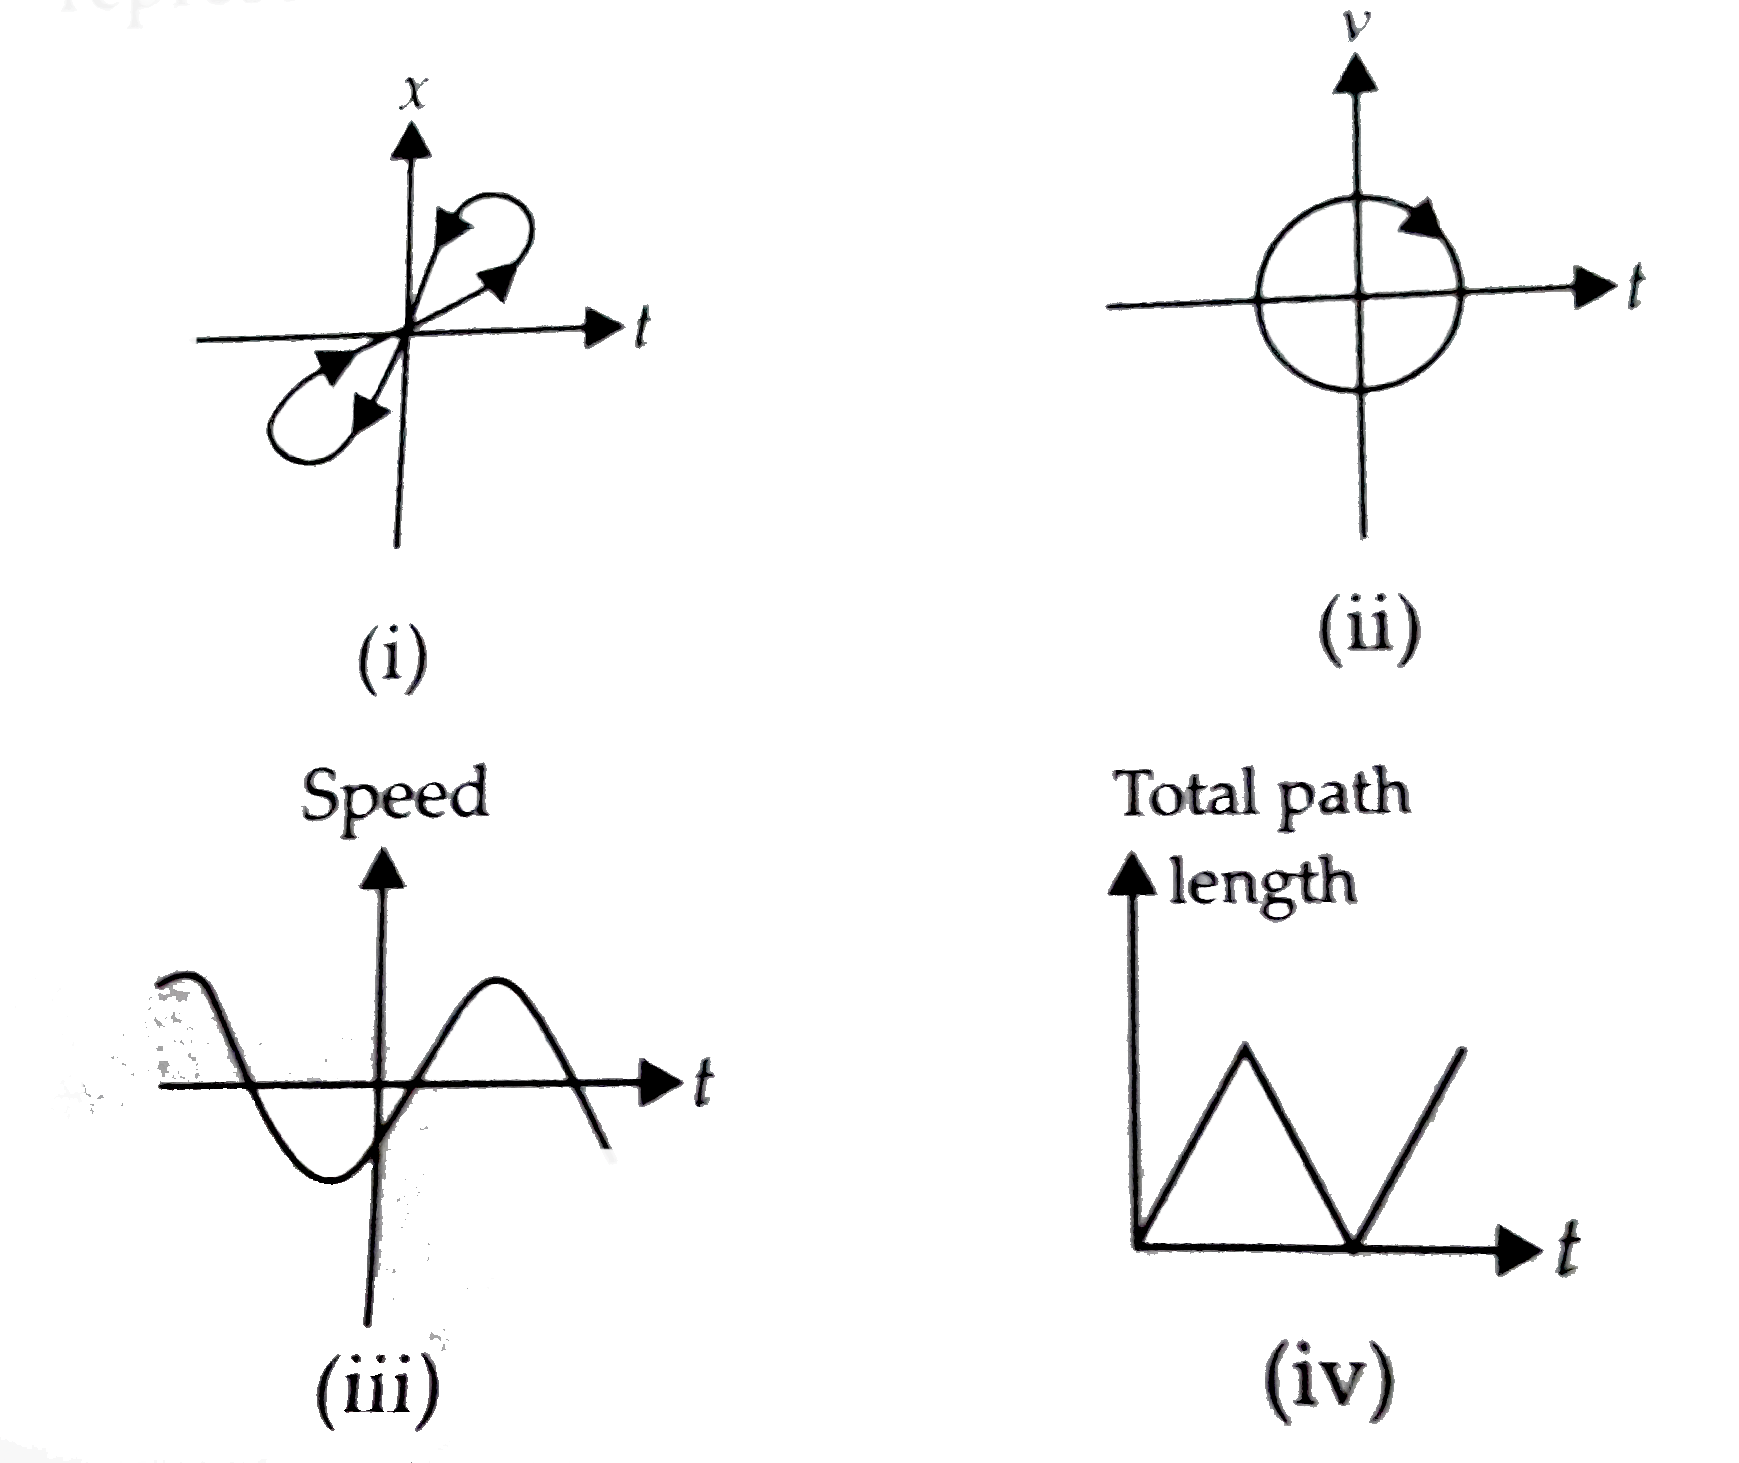 A(i) and (ii)B(ii) and (iii)C(i), (ii) and (iii)DAll four
Which of the following colour is scattered most is atmosphere?
View SolutionWhich of the following graphs represents the motion of a particle moving with constant velocity?
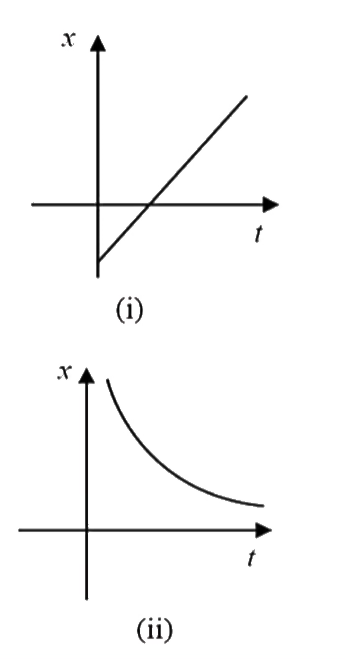
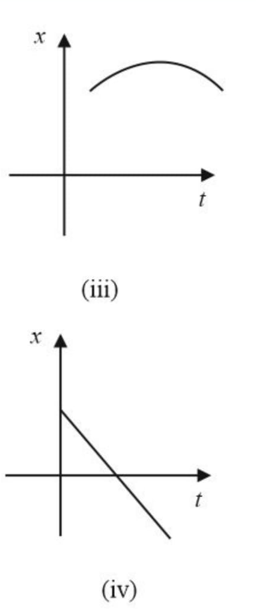
View SolutionWhich of the following graphs cannot possibly represent one dimensional motion of a particle?

View SolutionThe number of α-particless scattered per unit area N (θ) at scattering angle θ varies inversely as
View SolutionWhich of the following graphs represents the position time-graph of a particle moving with negative velocity?
View Solution

