Which of the shown graphs may represent the reactance of a series L-C combination?
The correct Answer is:D
To determine which graph may represent the reactance of a series L-C combination, we can follow these steps:
Step 1: Understand the Reactance of L-C Combination
The total reactance X of a series L-C circuit is given by:
X=XL−XC
where XL=ωL (inductive reactance) and XC=1ωC (capacitive reactance). Here, ω=2πf is the angular frequency.
Step 2: Express Reactance in Terms of Frequency
Substituting ω into the reactance equation, we get:
X=2πfL−12πfC
This equation shows how the reactance changes with frequency f.
Step 3: Identify Resonance Frequency
The resonance frequency fr occurs when XL=XC, or:
2πfrL=12πfrC
Solving for fr:
fr=12π√LC
At this frequency, the total reactance X becomes zero.
Step 4: Analyze the Behavior of Reactance
- For frequencies f<fr, XL>XC which means X>0 (inductive behavior).
- For frequencies f>fr, XL<XC which means X<0 (capacitive behavior).
Step 5: Graph Characteristics
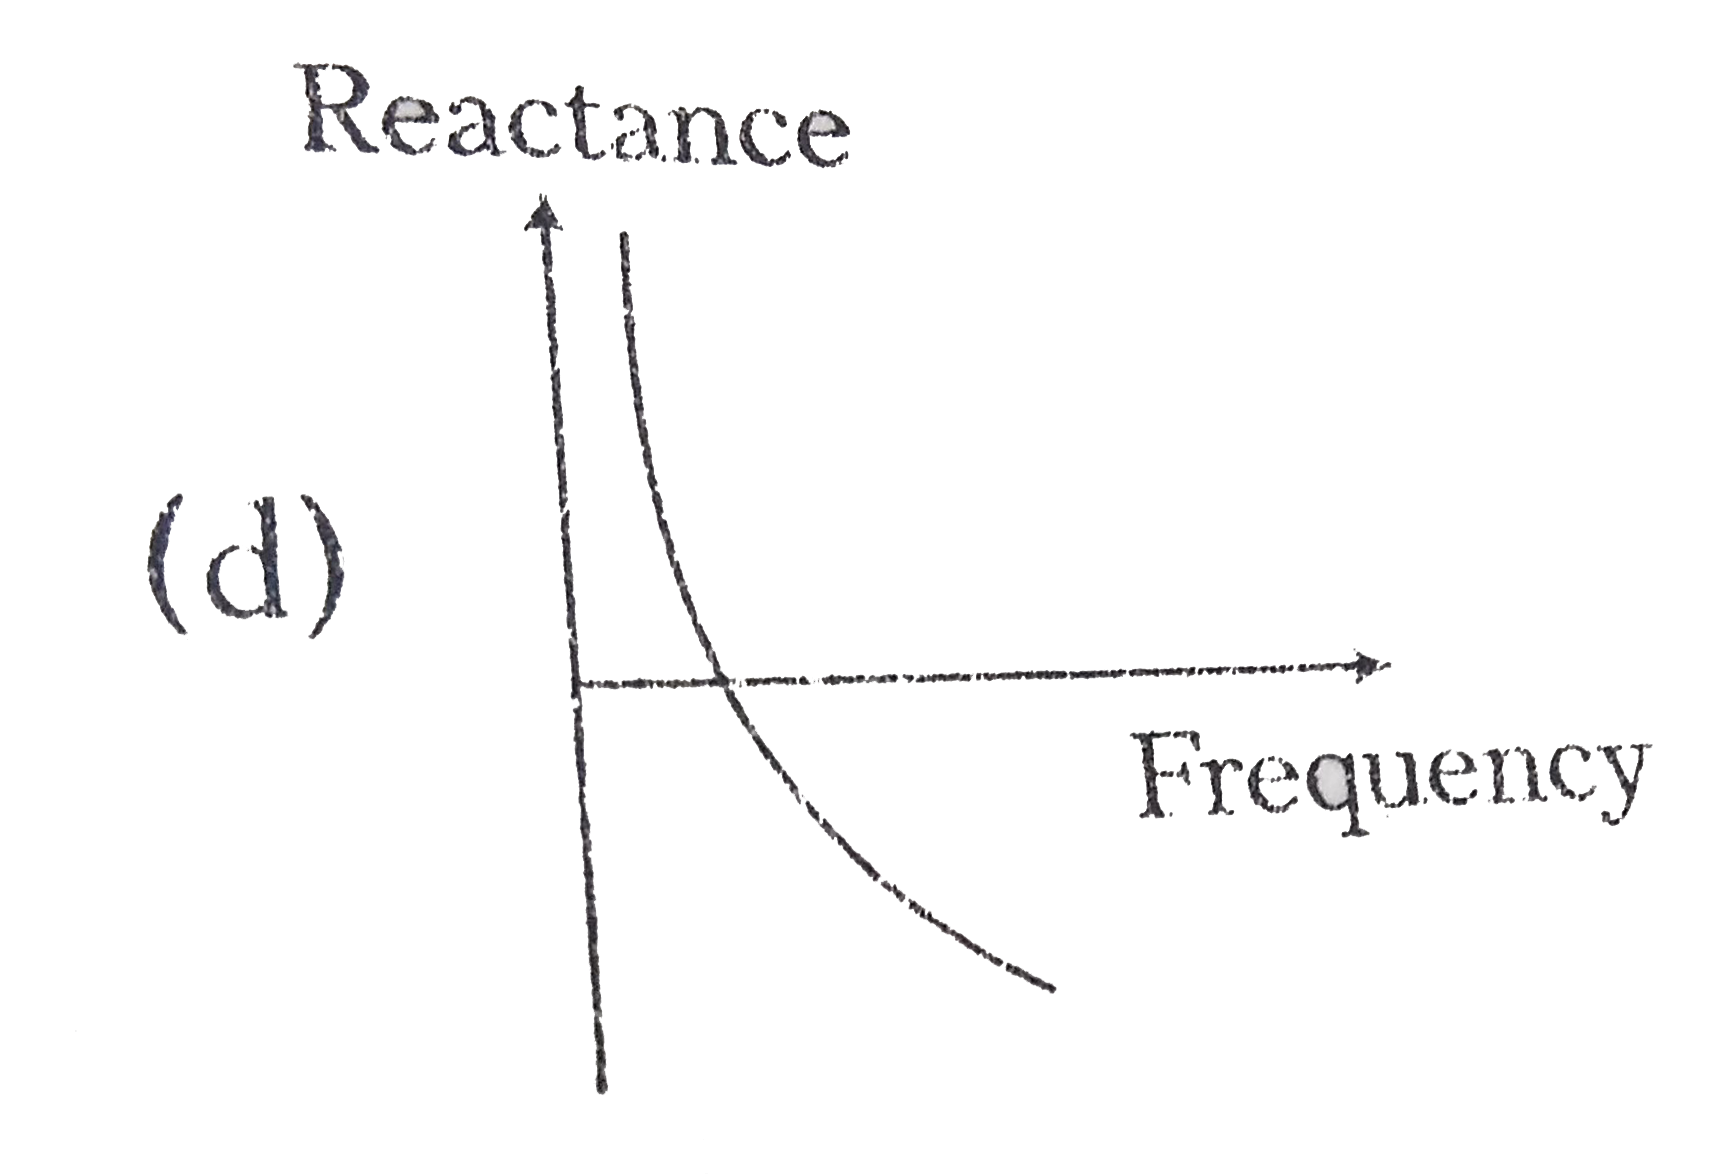
- The graph of reactance X vs. frequency f will cross the x-axis at the resonance frequency fr, indicating where X=0.
- For f<fr, the graph will be above the x-axis (positive reactance).
- For f>fr, the graph will be below the x-axis (negative reactance).
Step 6: Evaluate Given Graphs
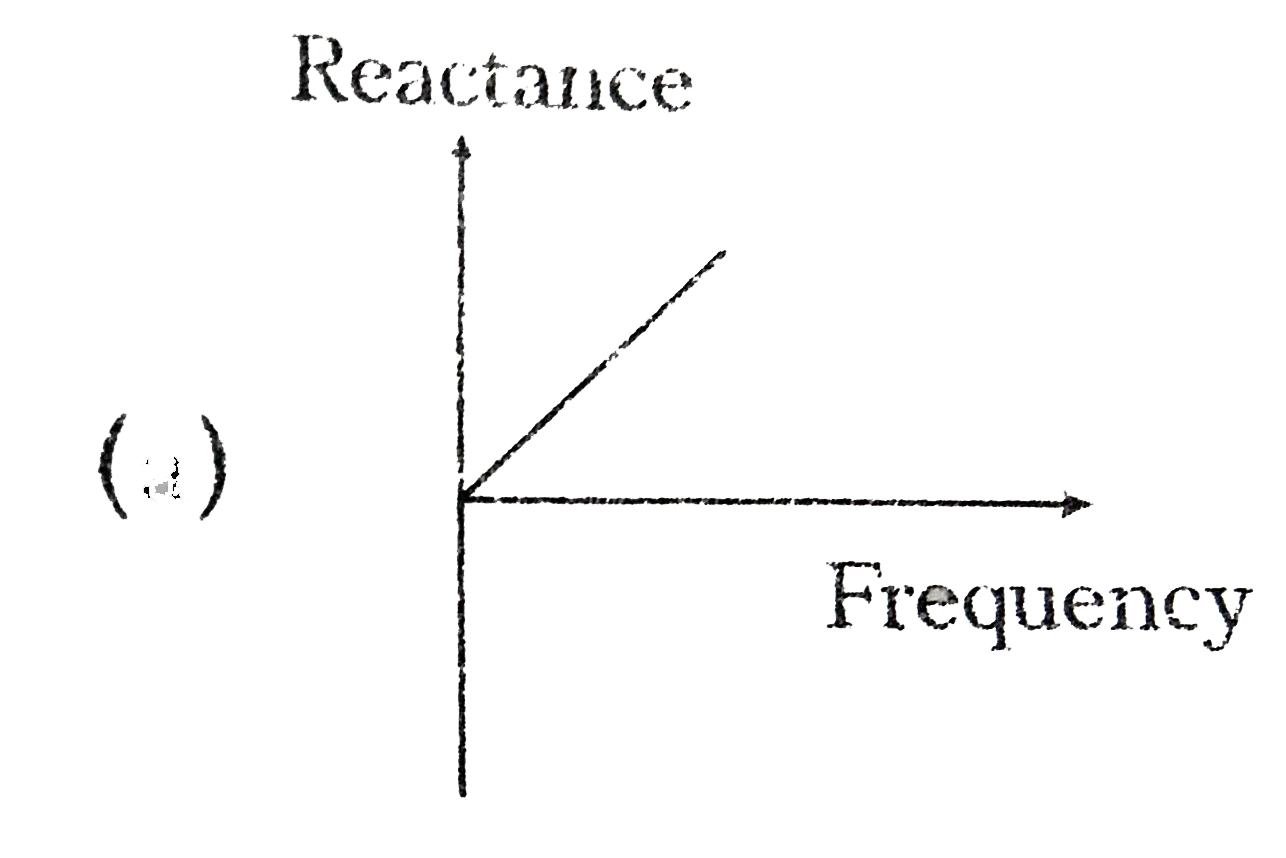
- Graph A: Starts at zero frequency, which is not possible.
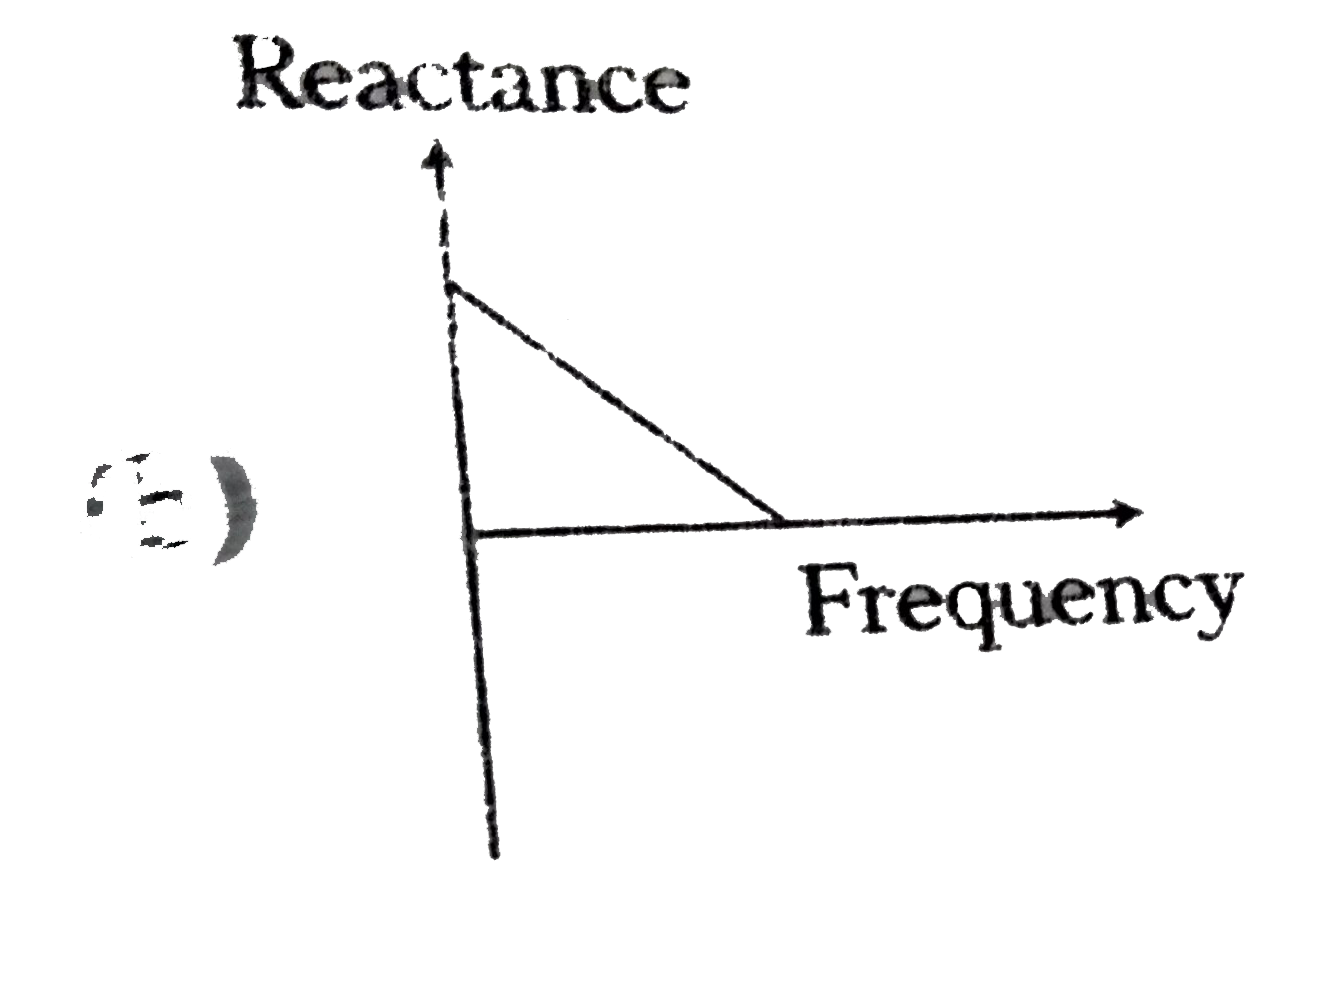
- Graph B: Similar issues with zero frequency.
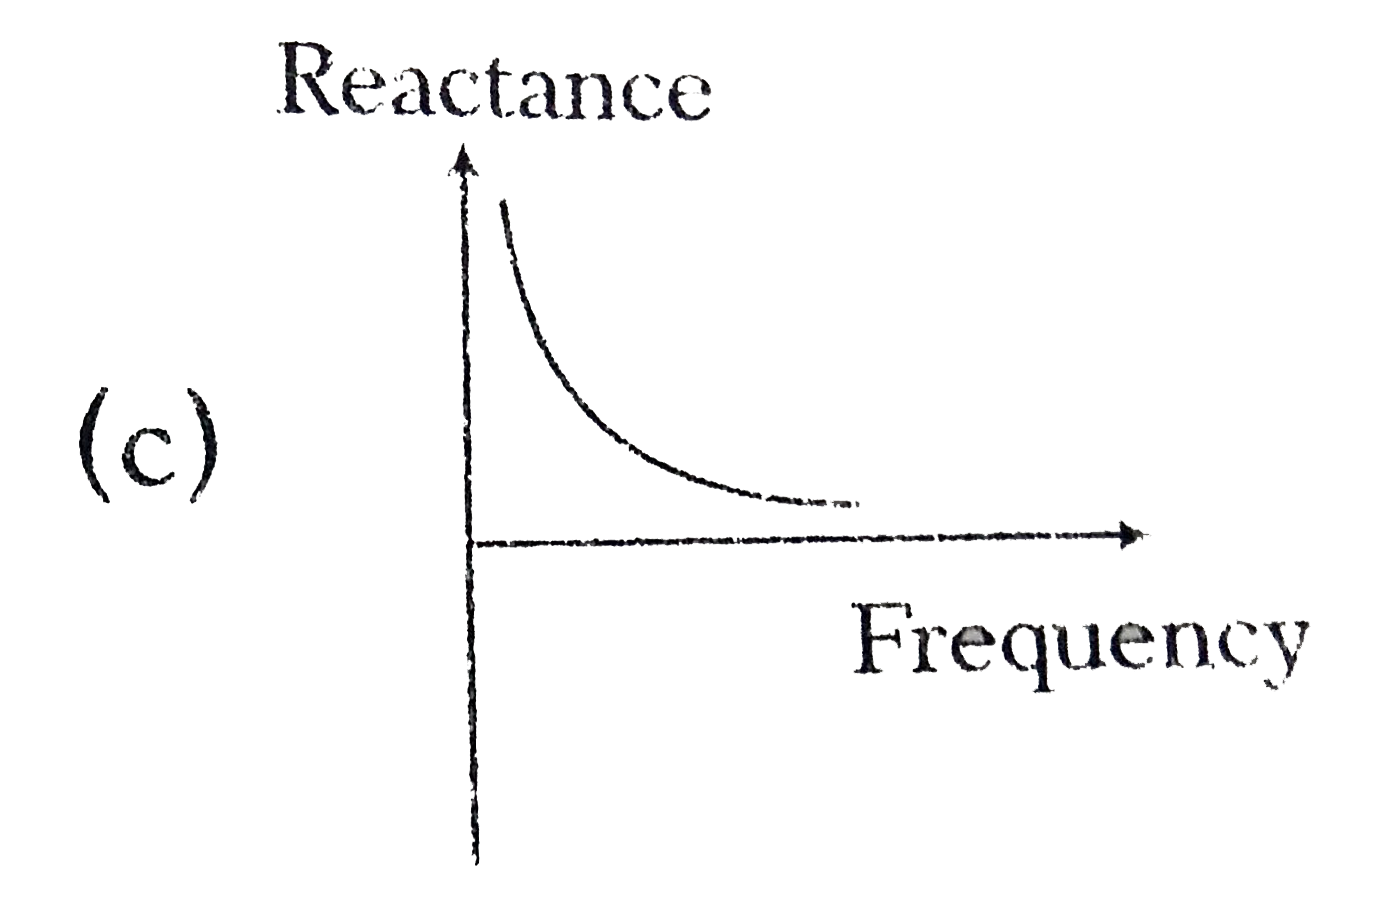
- Graph C: Does not cross the x-axis, indicating no resonance point.
- Graph D: Crosses the x-axis at a certain frequency, indicating resonance, and shows positive reactance for lower frequencies and negative for higher frequencies.
Conclusion
The graph that represents the reactance of a series L-C combination is Graph D.
---
The total reactance X of a series L-C circuit is given by:
X=XL−XC
where XL=ωL (inductive reactance) and XC=1ωC (capacitive reactance). Here, ω=2πf is the angular frequency.
Substituting ω into the reactance equation, we get:
X=2πfL−12πfC
This equation shows how the reactance changes with frequency f.
The resonance frequency fr occurs when XL=XC, or:
2πfrL=12πfrC
Solving for fr:
fr=12π√LC
At this frequency, the total reactance X becomes zero.
- For frequencies f<fr, XL>XC which means X>0 (inductive behavior).
- For frequencies f>fr, XL<XC which means X<0 (capacitive behavior).
- The graph of reactance X vs. frequency f will cross the x-axis at the resonance frequency fr, indicating where X=0.
- For f<fr, the graph will be above the x-axis (positive reactance).
- For f>fr, the graph will be below the x-axis (negative reactance).
- Graph A: Starts at zero frequency, which is not possible.
- Graph B: Similar issues with zero frequency.
- Graph C: Does not cross the x-axis, indicating no resonance point.
- Graph D: Crosses the x-axis at a certain frequency, indicating resonance, and shows positive reactance for lower frequencies and negative for higher frequencies.
The graph that represents the reactance of a series L-C combination is Graph D.
Similar Questions
Knowledge Check
Which of the following graphs represent the correct variation of inductive reactance XL with frequency υ?
A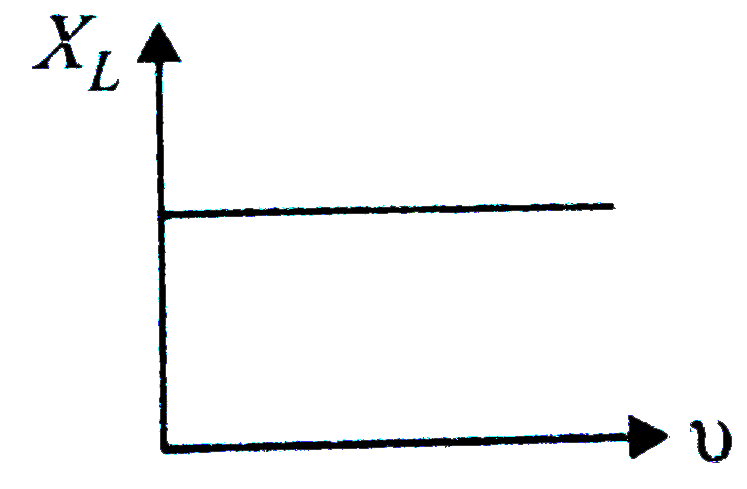 B
B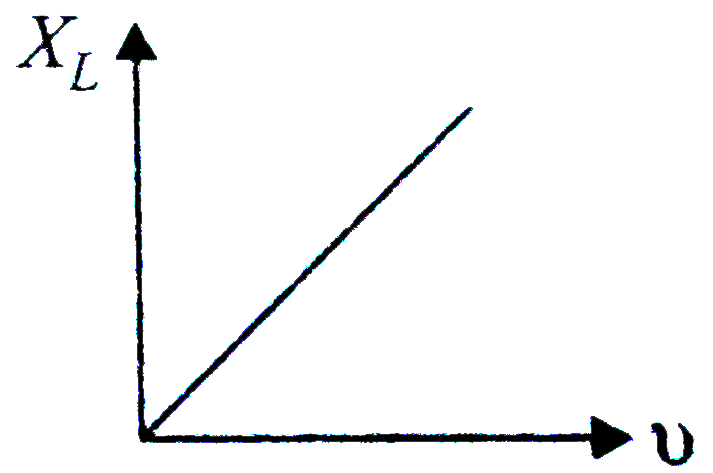 C
C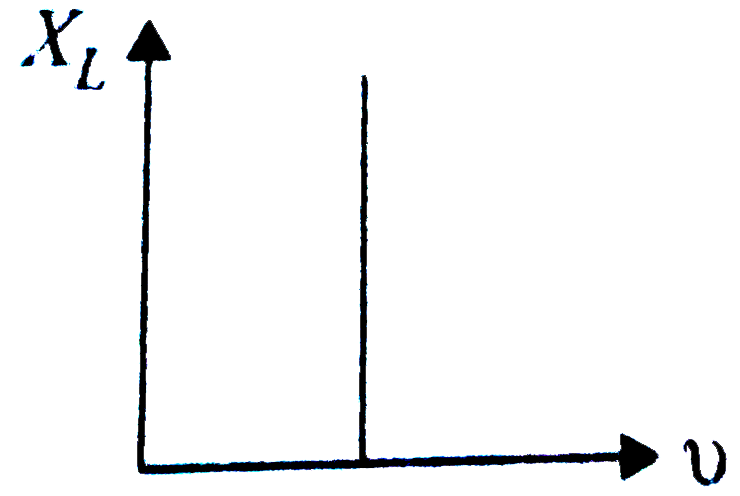 D
D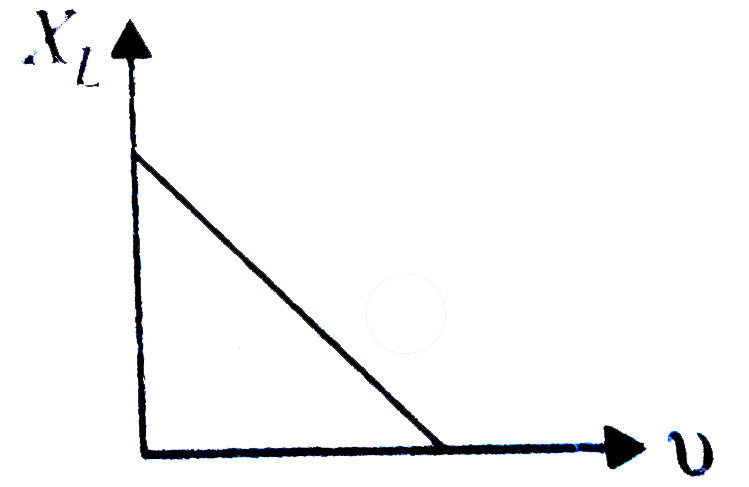
Which of the following plots may represent is impedence of a series LCR combination?
View SolutionWhat do the following figures represent?

View SolutionWhich of the following graphs may represent the relation between the capillary rise h and the radius r of the capillary?

View SolutionThe graph shown the variation with times t of the velocity v of an object . Which one of the following graphs best represents the variation of acceleration a of the object with time t?

View SolutionThe V - I graphs for two resistors and their series combination are shown in Fig 5.23. Which one of these graphs represents the series combination of the two resistors? Given reason for your answer.
View SolutionWhich of the four the graphs may best represent the current-deflection realation in a tangent galvanormetre?
View SolutionWhich of the following four graphs may best represent the current deflection relation in a tangent galvanometer?
View Solution

