INDICATOR DIAGRAM
P -T curve
P - V curve
V - T curve
Q -T curve
The correct Answer is:B
Step-by-Step Solution:
1. Understanding the Indicator Diagram:
- An indicator diagram is a graphical representation of the relationship between pressure (P) and volume (V) of a gas during a thermodynamic process.
2. Axes of the Diagram:
- In the indicator diagram, the x-axis represents the volume (V) of the gas, while the y-axis represents the pressure (P).
3. Plotting the Curve:
- As the gas undergoes different thermodynamic processes (like isothermal, adiabatic, isochoric, or isobaric), the points representing the pressure and volume will change. These points can be plotted on the graph to form a curve.
4. Shape of the Curve:
- The shape of the curve will depend on the specific thermodynamic process the gas is undergoing. For example:
- An isothermal process will show a hyperbolic curve.
- An adiabatic process will show a steeper curve compared to isothermal.
5. Area Under the Curve:
- The area enclosed by the curve and the volume axis (x-axis) represents the work done by or on the gas during the process.
- Mathematically, the work done (W) can be expressed as:
W=∫PdV
- This integral calculates the area under the curve in the PV diagram.
6. Conclusion:
- The indicator diagram is crucial for visualizing the work done in thermodynamic processes and understanding the behavior of gases under various conditions.
- An indicator diagram is a graphical representation of the relationship between pressure (P) and volume (V) of a gas during a thermodynamic process.
- In the indicator diagram, the x-axis represents the volume (V) of the gas, while the y-axis represents the pressure (P).
- As the gas undergoes different thermodynamic processes (like isothermal, adiabatic, isochoric, or isobaric), the points representing the pressure and volume will change. These points can be plotted on the graph to form a curve.
- The shape of the curve will depend on the specific thermodynamic process the gas is undergoing. For example:
- An isothermal process will show a hyperbolic curve.
- An adiabatic process will show a steeper curve compared to isothermal.
- The area enclosed by the curve and the volume axis (x-axis) represents the work done by or on the gas during the process.
- Mathematically, the work done (W) can be expressed as:
W=∫PdV
- This integral calculates the area under the curve in the PV diagram.
- The indicator diagram is crucial for visualizing the work done in thermodynamic processes and understanding the behavior of gases under various conditions.
Topper's Solved these Questions
- THERMODYNAMICSBOOK - AAKASH INSTITUTE ENGLISHCHAPTER - THERMODYNAMICSEXERCISE - ASSIGNMENT (SECTION -A) (Objective Type Questions)
47 Videos
- THERMODYNAMICSBOOK - AAKASH INSTITUTE ENGLISHCHAPTER - THERMODYNAMICSEXERCISE - ASSIGNMENT (SECTION -B) (Objective Type Questions)
30 Videos
- THERMODYNAMICSBOOK - AAKASH INSTITUTE ENGLISHCHAPTER - THERMODYNAMICSEXERCISE - TRY YOURSELF
12 Videos
- THERMAL PROPERTIES OF MATTERBOOK - AAKASH INSTITUTE ENGLISHCHAPTER - THERMAL PROPERTIES OF MATTEREXERCISE - Assignment (Section-J) Akash Challengers Questions
7 Videos
- UNITS AND MEASUREMENTSBOOK - AAKASH INSTITUTE ENGLISHCHAPTER - UNITS AND MEASUREMENTSEXERCISE - ASSIGNMENT (SECTION - D)
15 Videos
Similar Questions
The given diagram is highly diagrammatic representation of mammalian heart. In this diagram
(##EVR_ANM_ICSE_BIO_X_C07_E01_020_Q01.png" width="80%">
What do the arrows indicate ?
View SolutionPertain to the following statement and figure
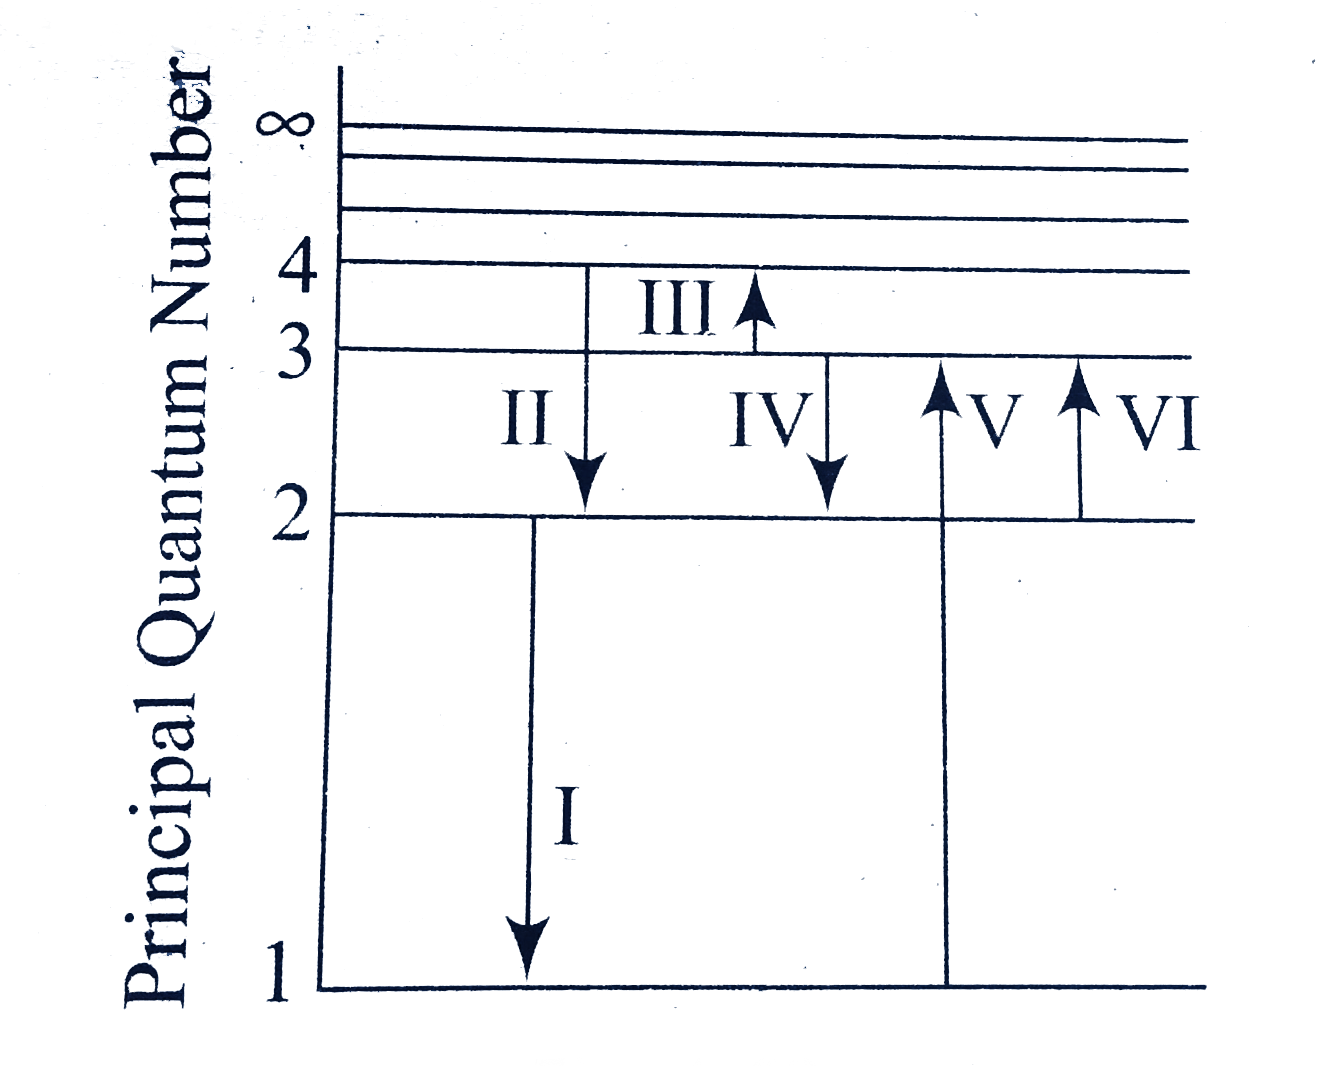
The figure above shown level diagram of the hydrogen atom. Serveral transition are market as I, II, III, … The diagram is only indicative and not to scale.
The wavelength of the radiation involved in transition II is:
View SolutionThe figure shows an energy level diagram for the hydrogen atom. Several transitions are marked as I, II, III,_____. The diagram is only indicative and not be scale.
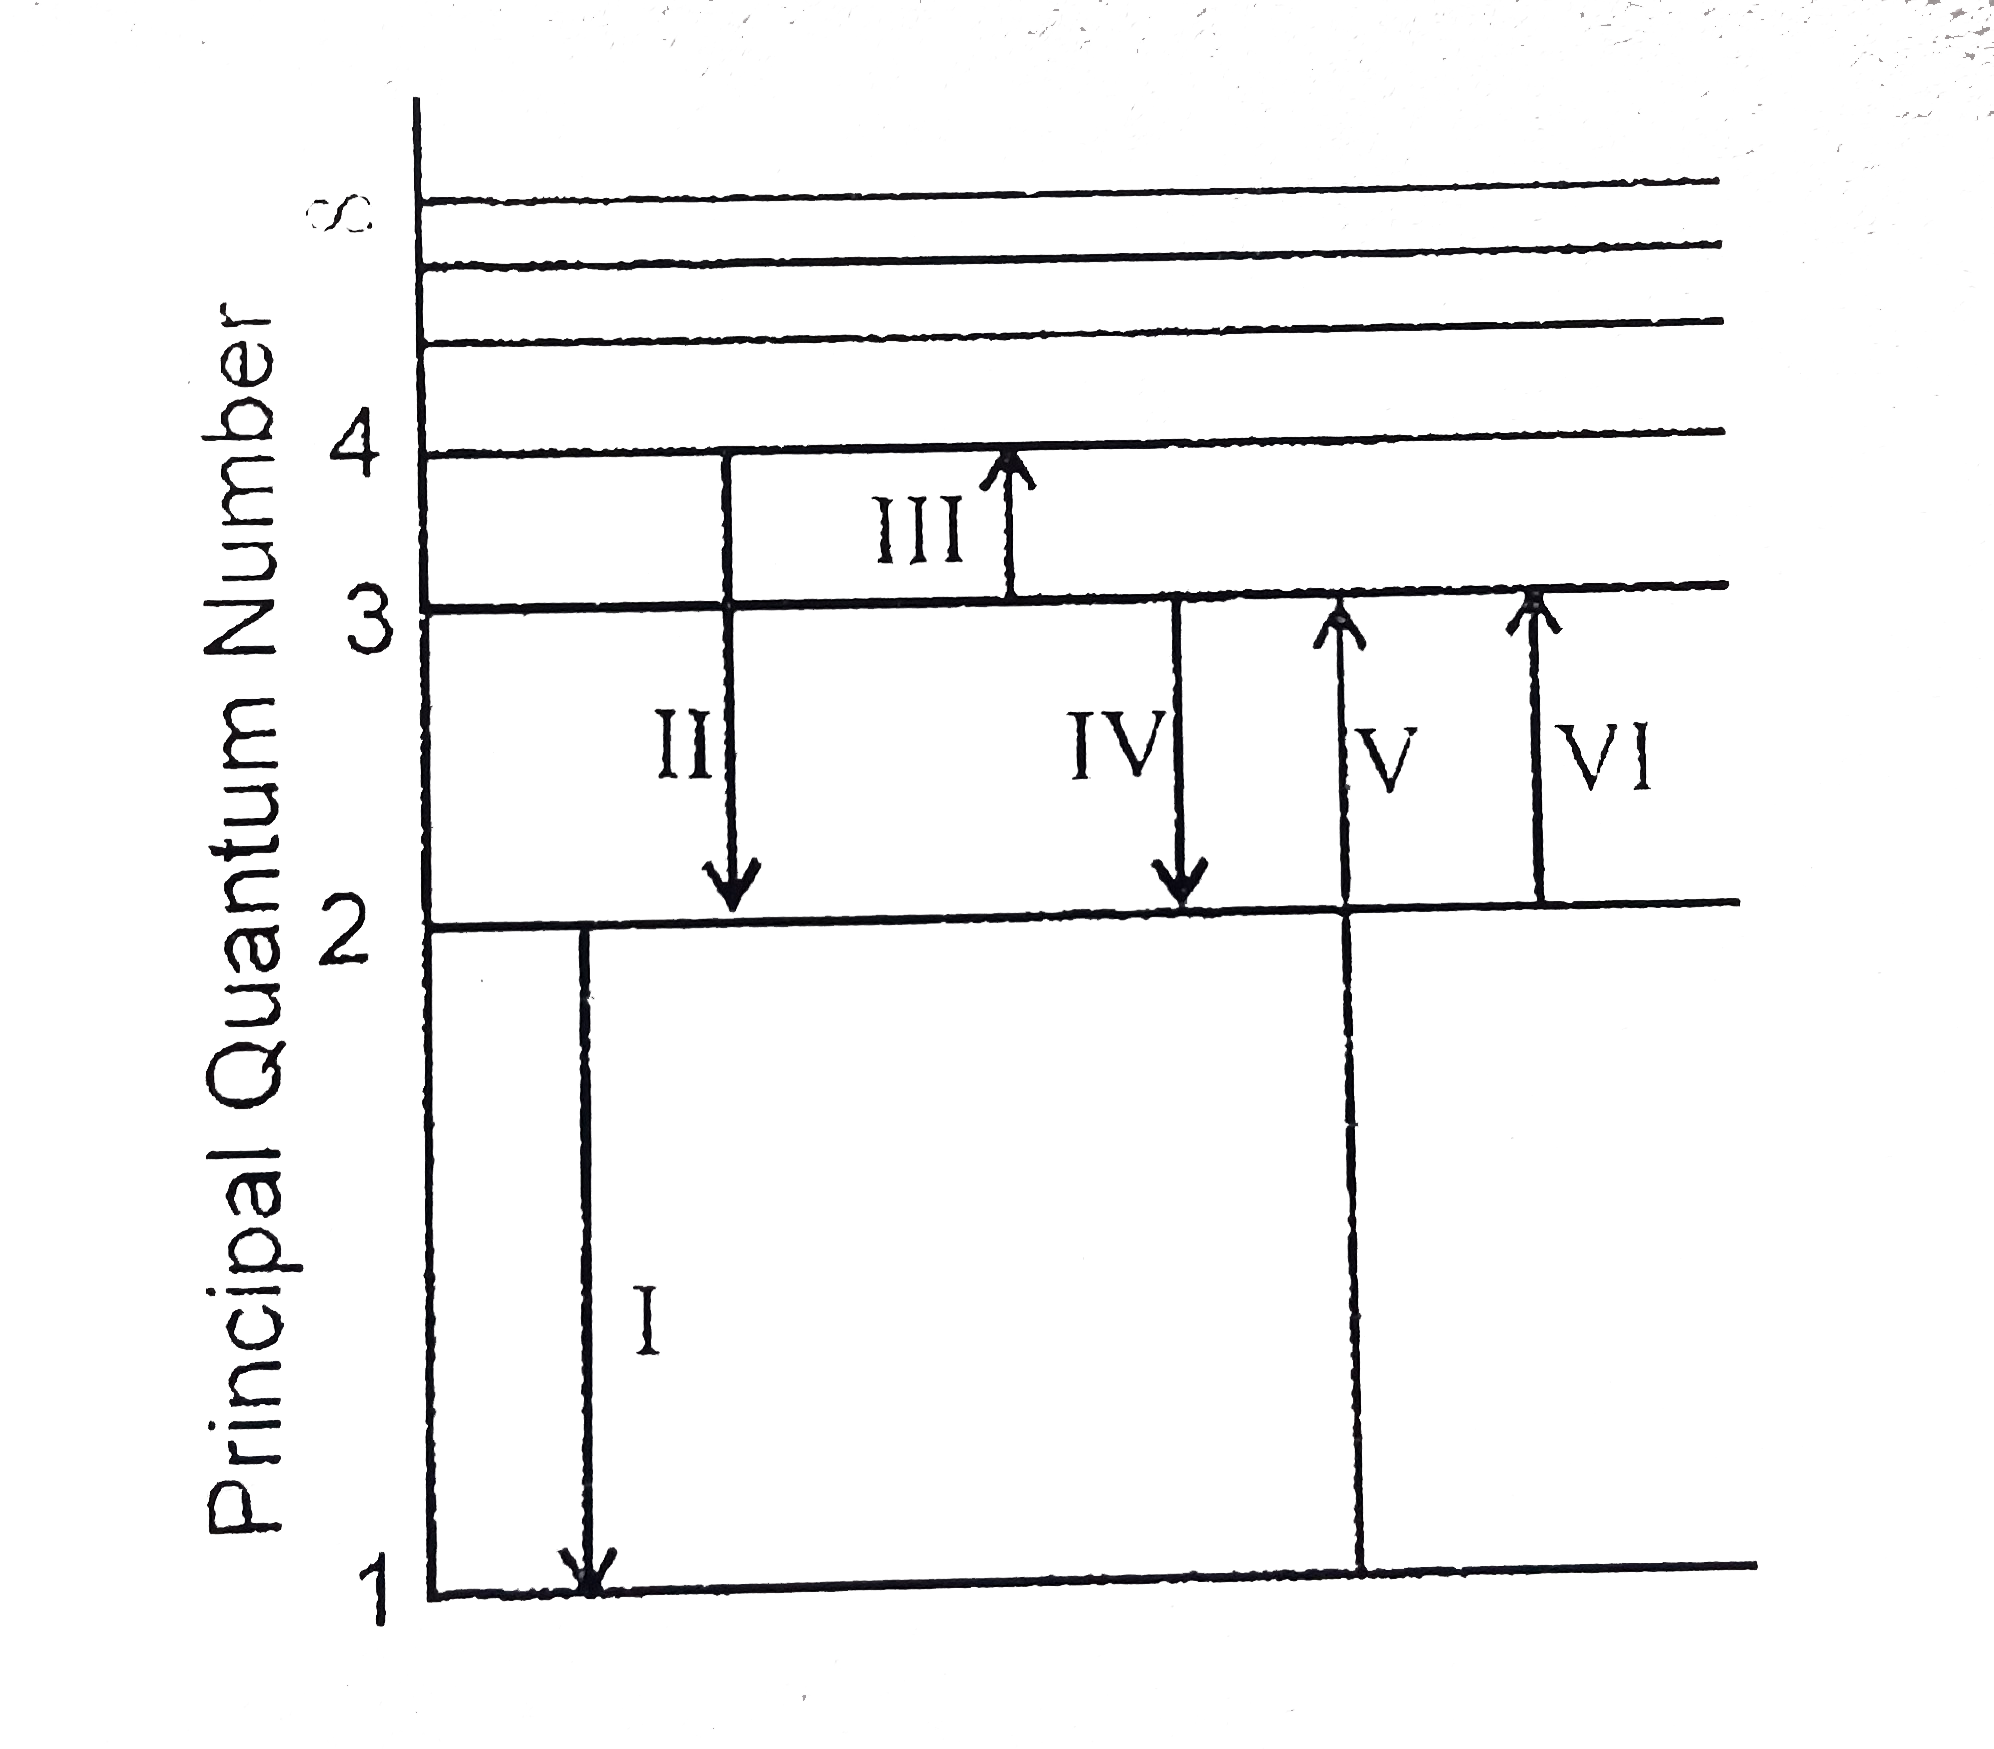
In which transitions is a Balmer photn absorbed?
View SolutionThe figure shows an energy level diagram for the hydrogen atom. Several transitions are marked as I, II, III,_____. The diagram is only indicative and not be scale.
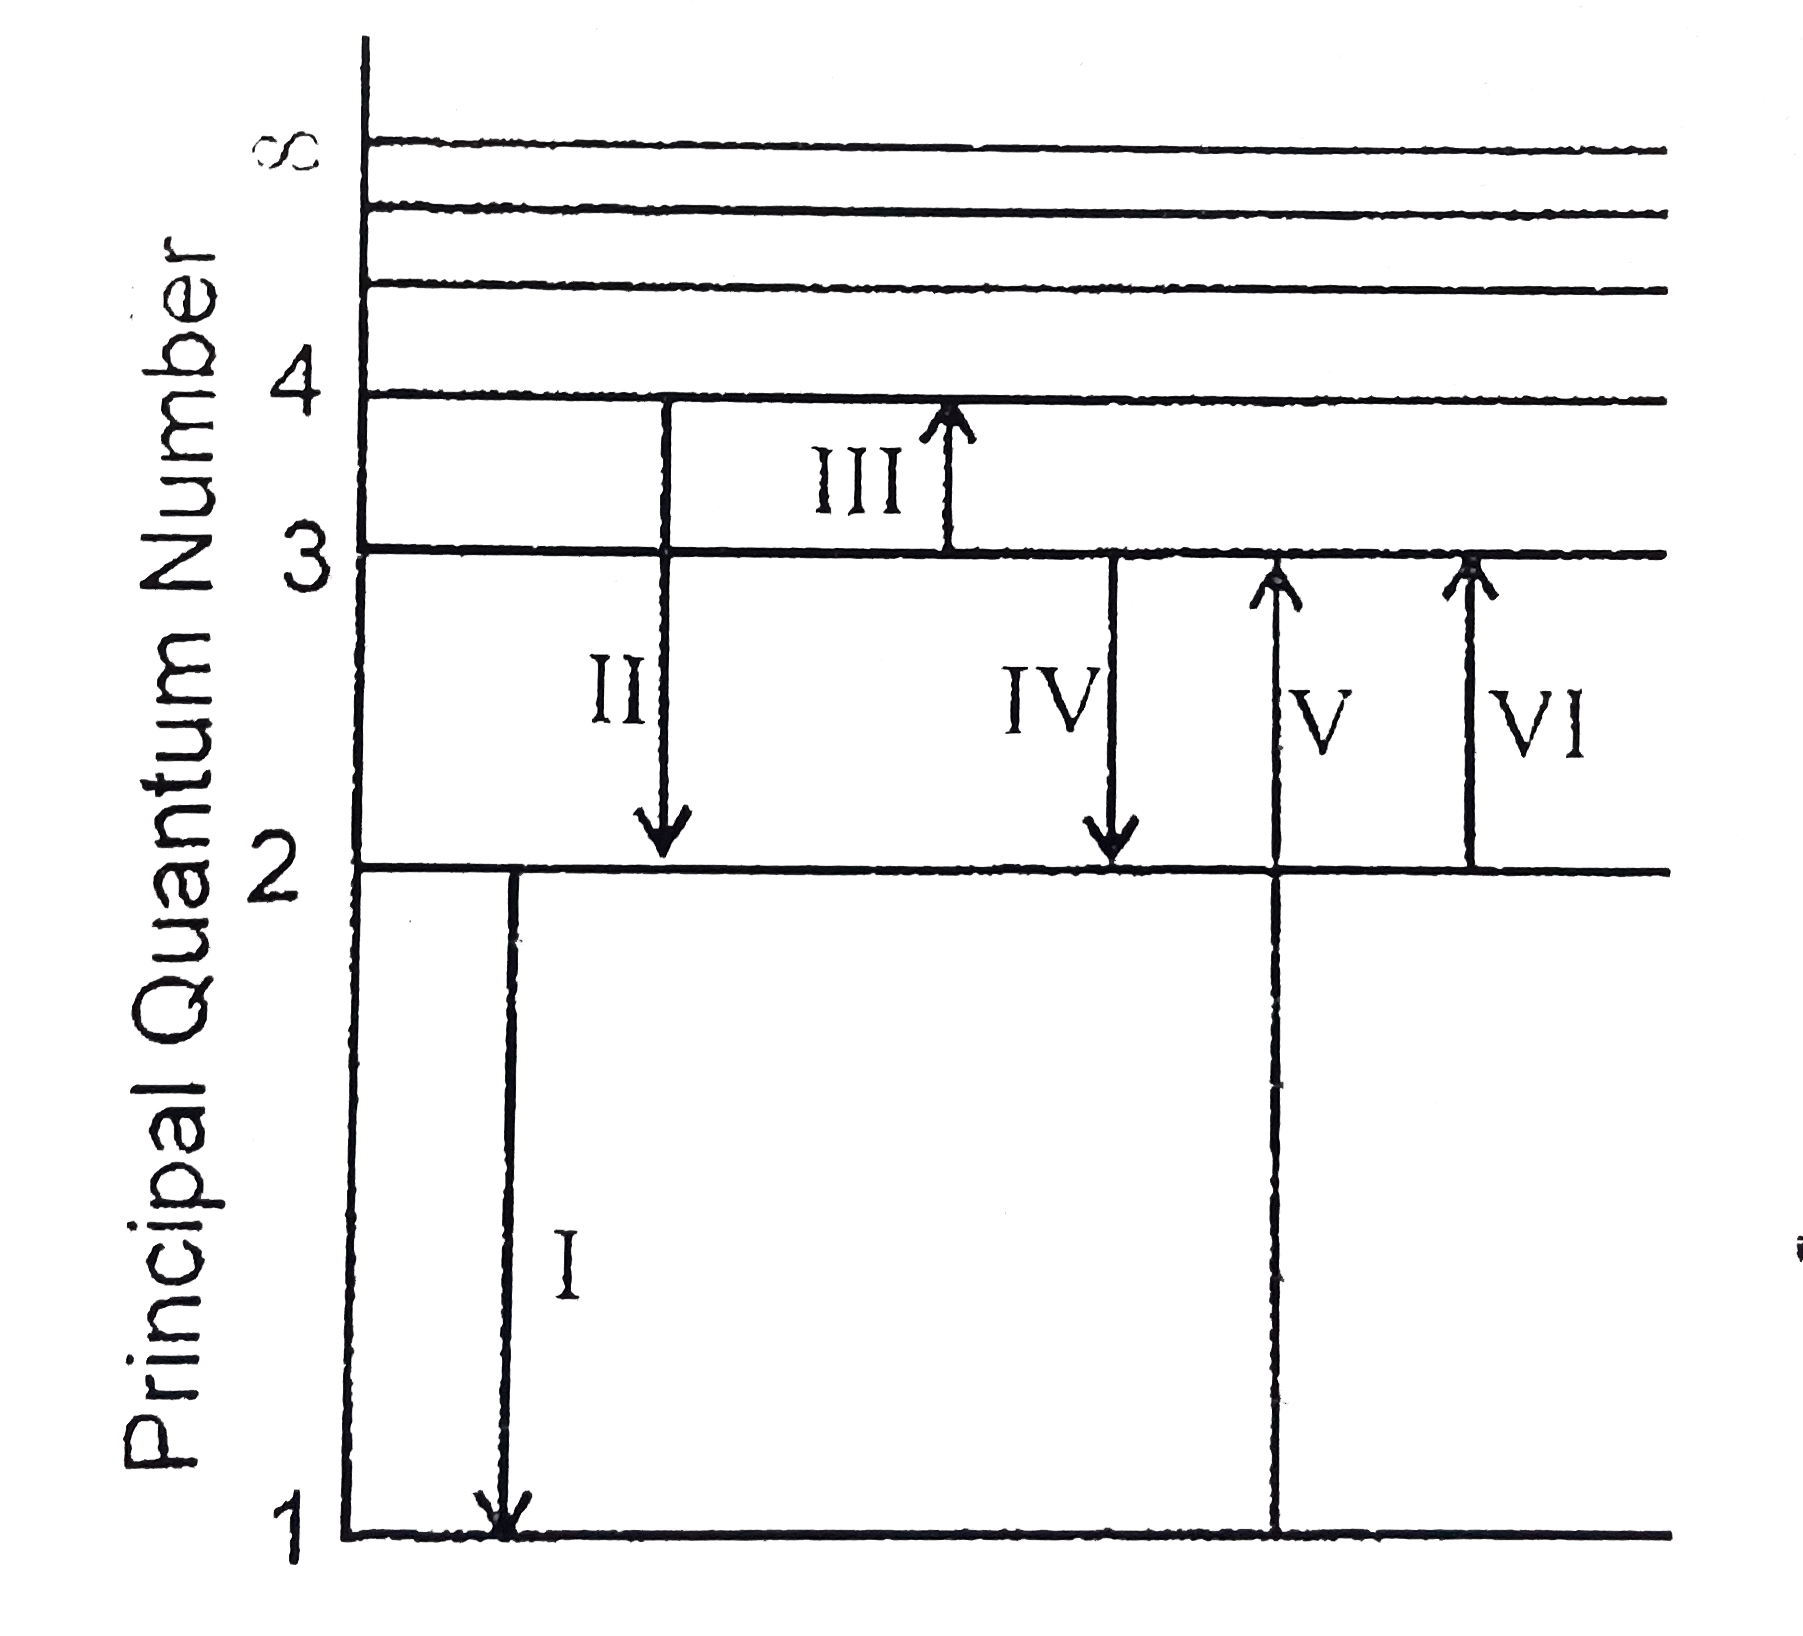
Which transition will occur when a hydrogen atom is irradiated with radiation of wavelength 103nm.
View SolutionPertain to the following statement and figure

The figure above shown level diagram of the hydrogen atom. Serveral transition are market as I, II, III, … The diagram is only indicative and not to scale.
The wavelength of the radiation involved in transition II is:
View SolutionThe figure shows an energy level diagram for the hydrogen atom. Several transitions are marked as I, II, III,_____. The diagram is only indicative and not be scale.

Which transition will occur when a hydrogen atom is irradiated with radiation of wavelength 103nm.
View SolutionThe figure shows an energy level diagram for the hydrogen atom. Several transitions are marked as I,II,III ,______, the diagram is only indicative and not to scale.
_E01_150_Q01.png) .
.
Which transition involves the longest wavelength line in the visible portion of the hydrogen spectrum
View SolutionPertain to the following statement and figure
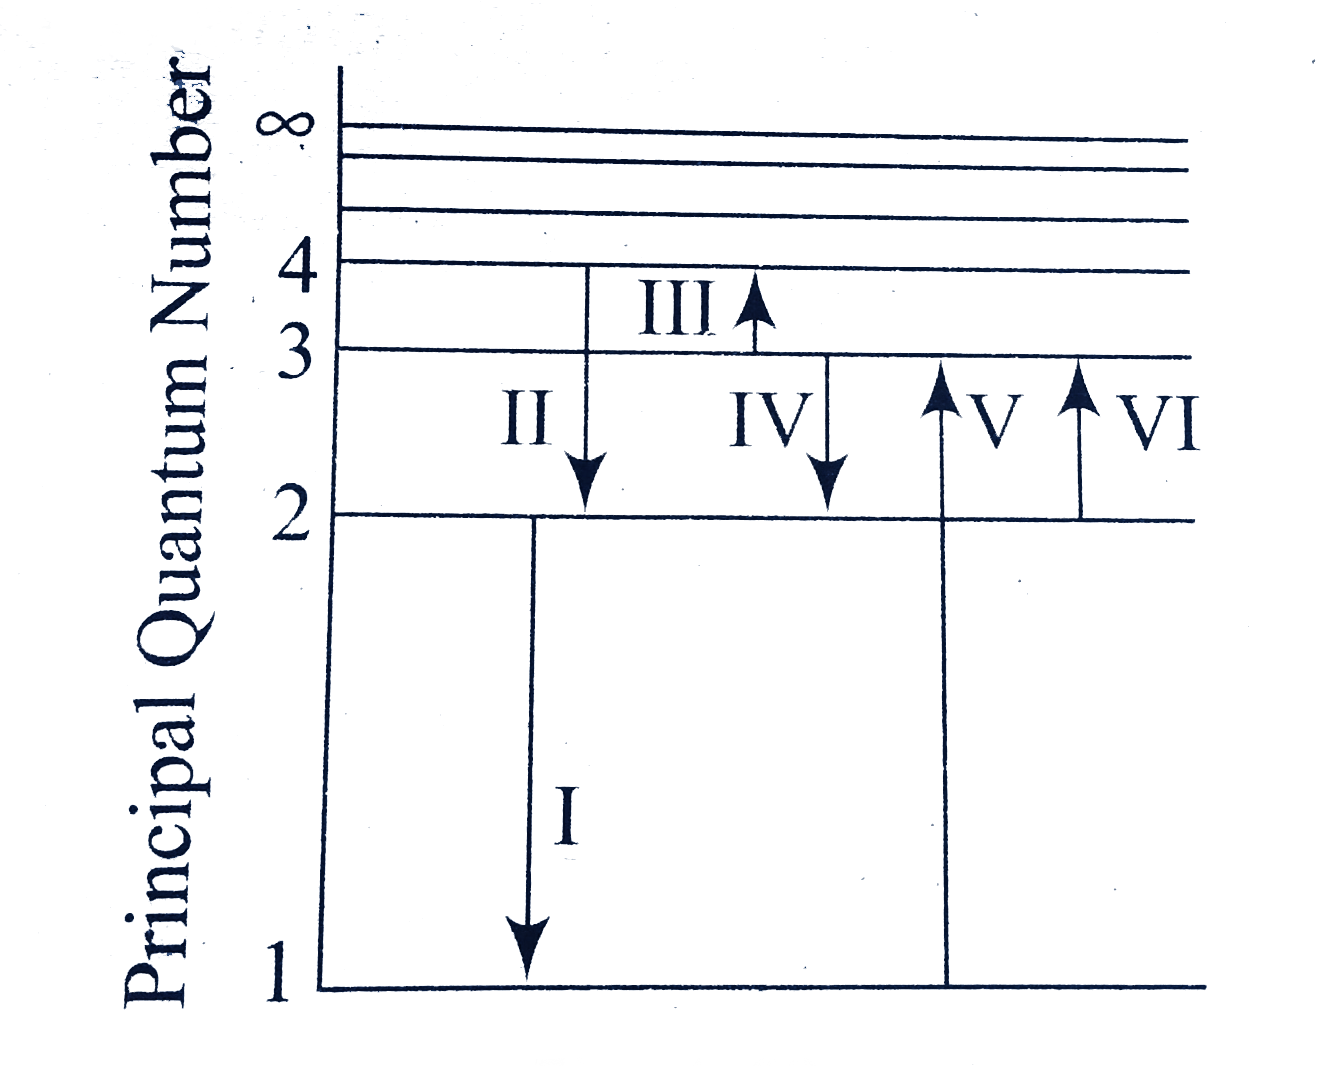
The figure above shown level diagram of the hydrogen atom. Serveral transition are market as I, II, III, … The diagram is only indicative and not to scale.
In which transition ia a Balmer series photon absorbed?
View SolutionThermodynamic processes are indicated in the following diagrams
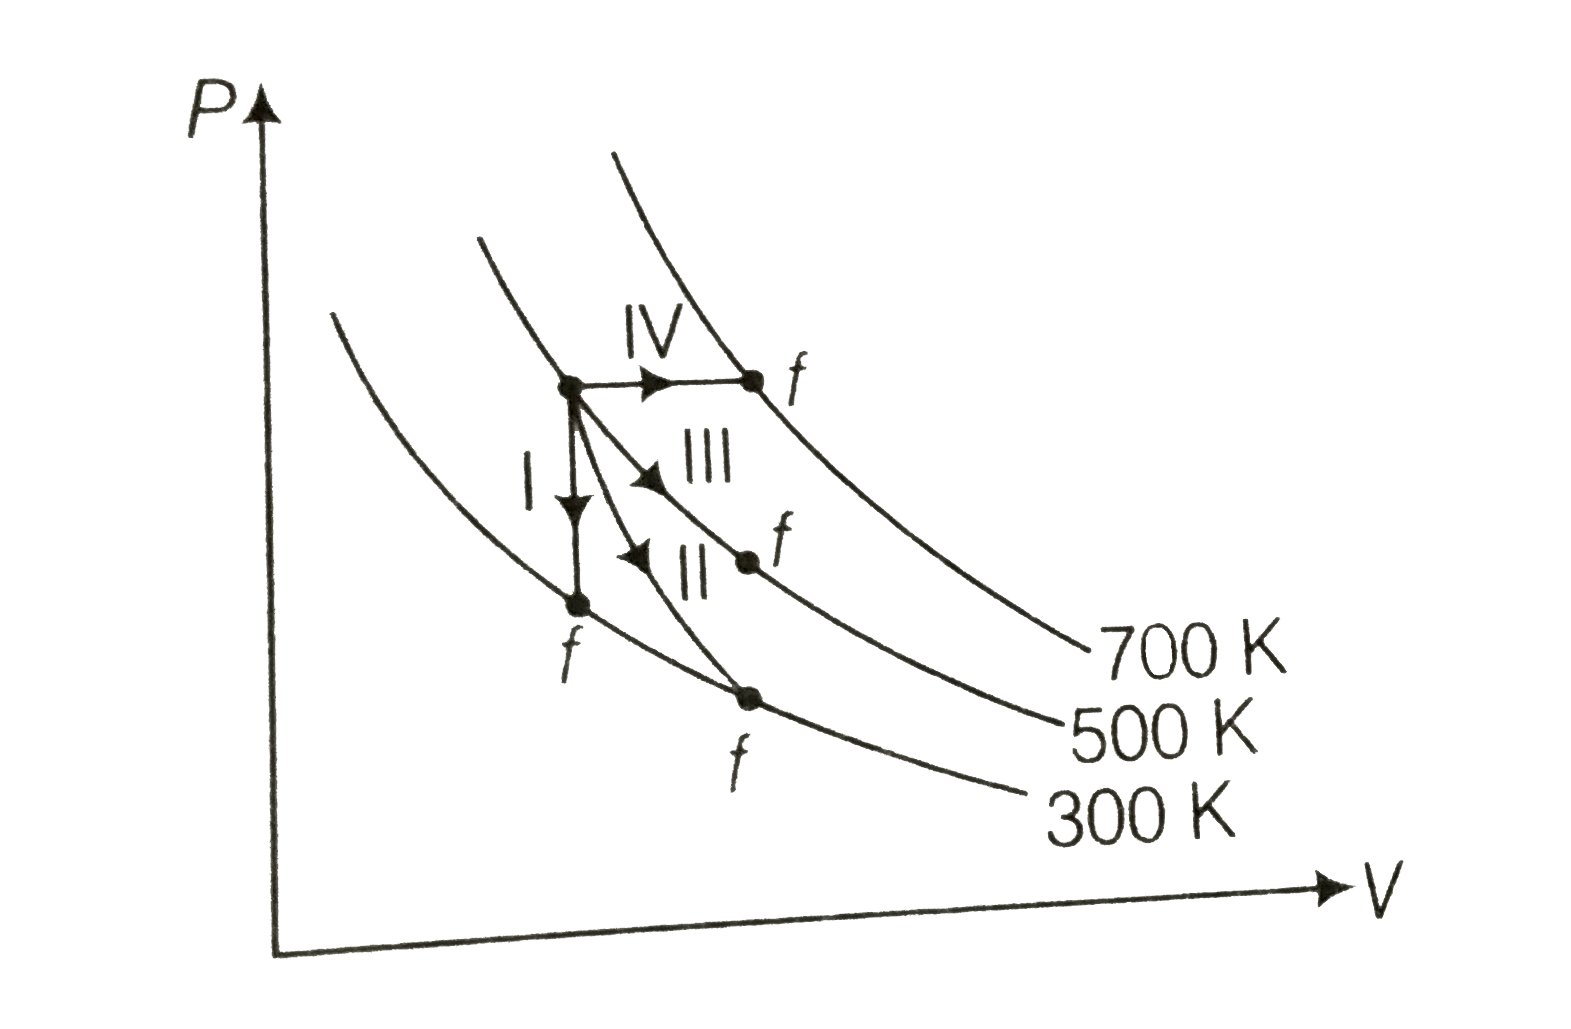
Match the following
Column - IColumn -IIPProcess IaAdiabaticQProcess IIbIsobaricRProcess IIIcIsochoricSProcess IVdIsothermal
View SolutionPertain to the following statement and figure
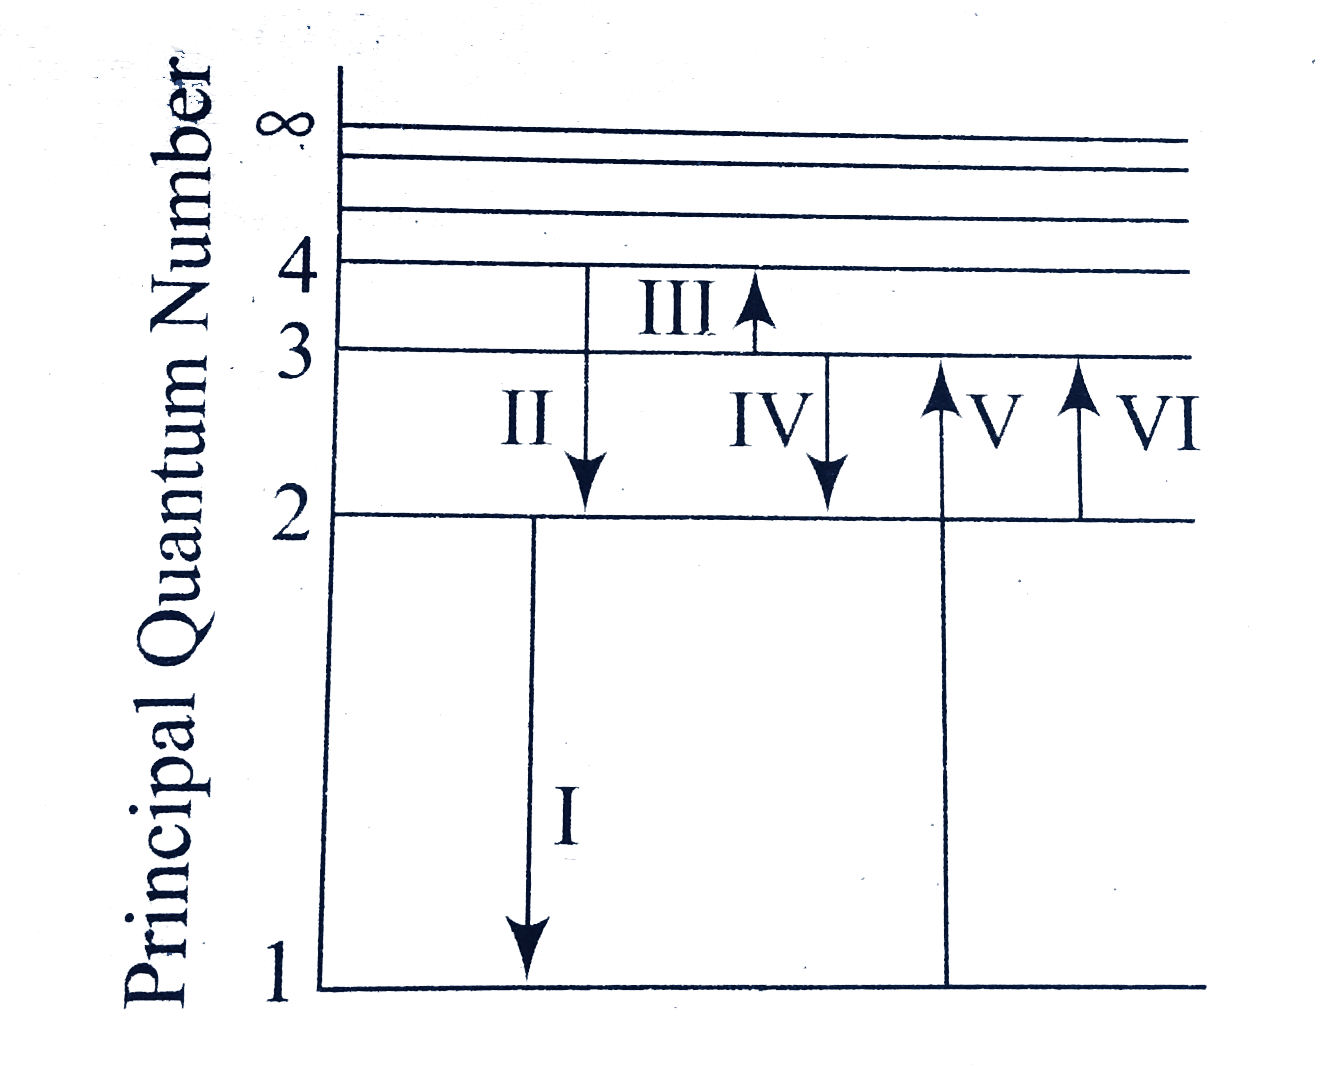
The figure above shown level diagram of the hydrogen atom. Serveral transition are market as I, II, III, … The diagram is only indicative and not to scale.
Which transition will occur when a hydrogen atom is irradiated with radiation of wavelength 103nm?
View Solution
