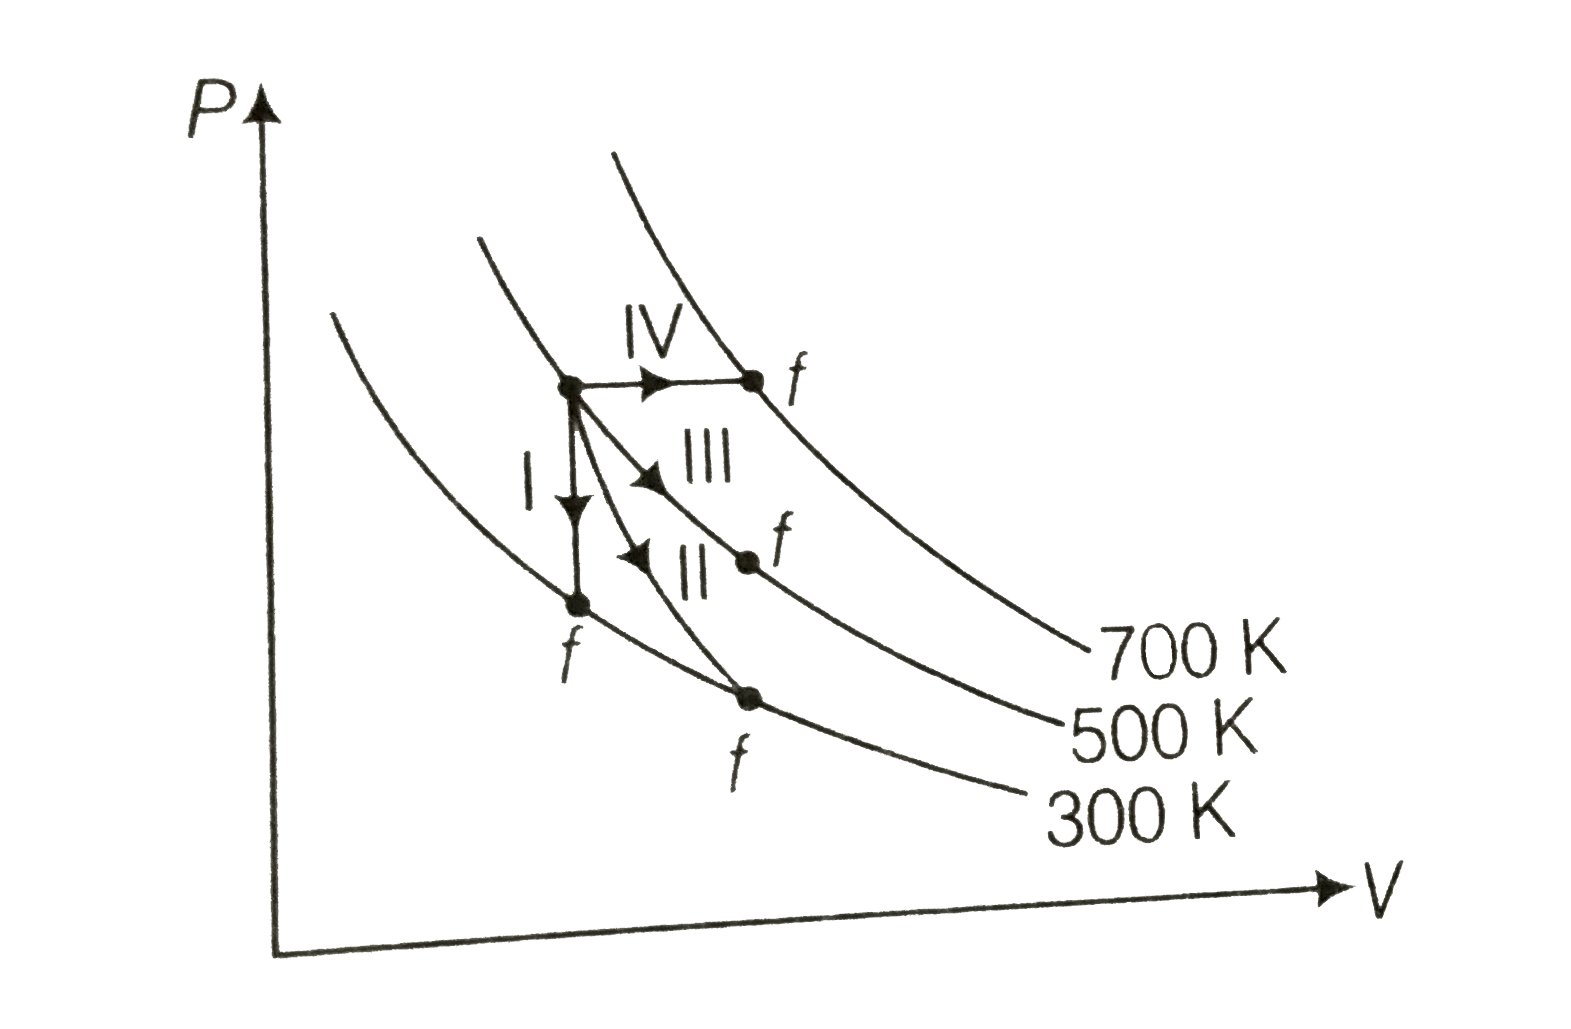
Thermodynamic processes are indicated in the following diagrams

Match the following
Column - IColumn -IIPProcess IaAdiabaticQProcess IIbIsobaricRProcess IIIcIsochoricSProcess IVdIsothermal
P → a, Q → c, R → d, S → b
P → c, Q → a, R → d, S → b
P → c, Q → d, R → b, S → a
P → d, Q → b, R → a, S → c
The correct Answer is:B
Step by step video & image solution for Thermodynamic processes are indicated in the following diagrams Match the following {:(,"Column - I",,"Column -II",),(P,"Process I",a,"Adiabatic",),(Q,"Process II",b,"Isobaric",),(R,"Process III",c,"Isochoric",),(S,"Process IV",d,"Isothermal",):} by Physics experts to help you in doubts & scoring excellent marks in Class 12 exams.
Similar Questions
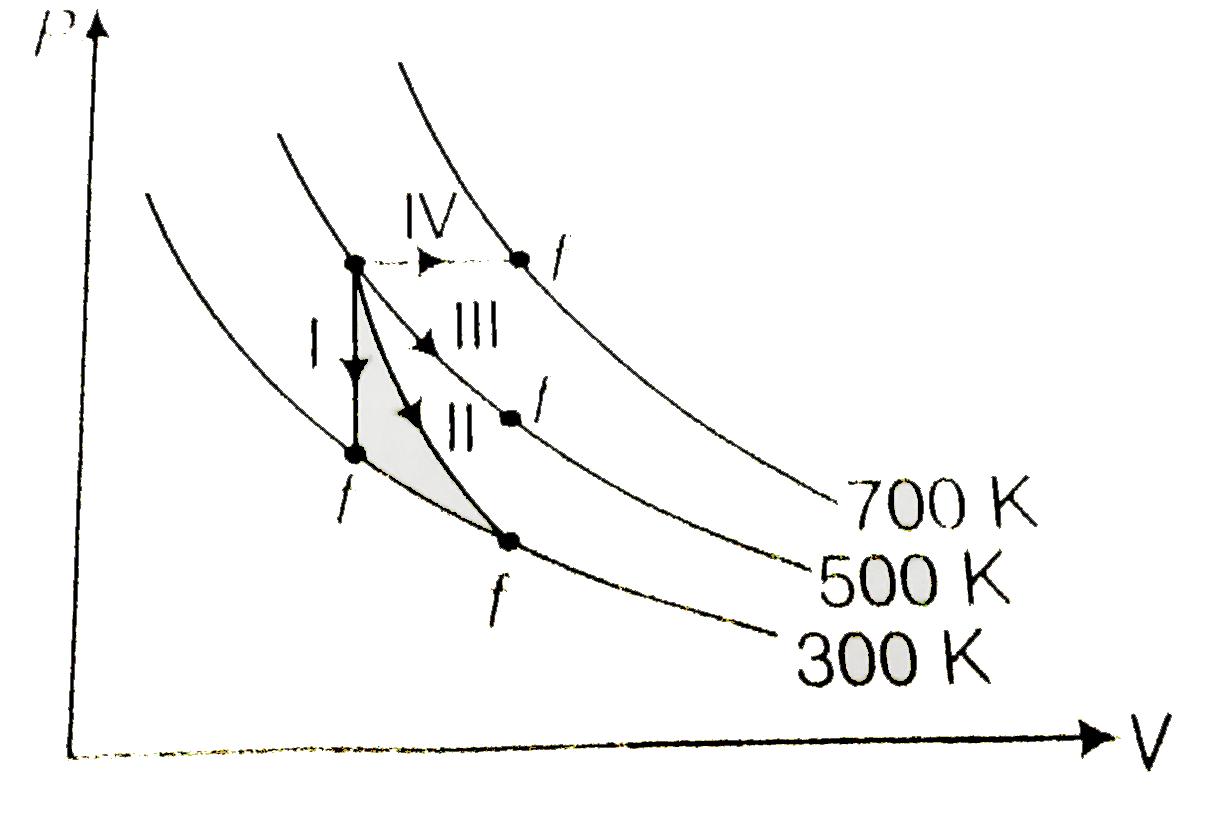
Thermodynamic processes are indicated in the following diagram

Match the following :
 View Solution
Match the column :-
Column - IColumn - IIAAdiabatic processPq=0BIsothermal processQΔH=0CIsoenthalpic processRΔT=0DIsoentropic processSΔS=0View SolutionMatch the following columns:
Column IColumn IIAGolden riceiEli LilyBPCRiiHerbert boyerCInsuliniiiKary mullisDRecombinant DNAivPeter BayerView SolutionCorresponding to isobaric process match the following two columns.
View SolutionFor the given process :-
_E01_426_Q01.png)
Column-IColumn-II(A)Process J→K(P)W>0(B)Process K→L(q)W<0(C)Process L→M(r)Q>0(D)Process M→J(s)Q<0View SolutionMatch the following columns:
Column IColumn IIa.Oxylophytes(i)Calcium-rich soilsb.Eremophytes(ii)Waste landc.Chrysophytes(iii)Deserts, steppesd.Calciphytes(iv)Acidic soilsView SolutionMatch the following columns
Column IColumn IIa.Lysozyme(i)HClb.Peptic cells(ii)Antibacterial enzymec.Saliva(iii)Sublingual glandd.Oxyntic cells(iv)PepsinogenView SolutionMatch the following columns
Column IColumn IIa.Photolysis of wateri.zincb.Diazotrophyii.Copperc.Cytochrome-C oxidaseiii.Manganesed.biosynthesis of IAAiv.Molybdenumv.BoronView SolutionMatch the columns and select the correct option from the following.
Column IColumn II(A)Wheat rust (I)Edible(B)Antibiotics(II)Puccinia(C)Mushroom(III)Sac fungi(D)Ascomycetes(IV)PenicilliumView SolutionThe straight lines in the figure depict the variations in temperature ΔT as a function of the amount of heat supplied Q is different process involving the change of state of a monoatomic and a diatomic ideal gas . The initial states, (P,V,T) of the two gases are the same . Match the processes as described, with the straight lines in the graph as numbered.
_E01_155_Q01.png)
Column-IColumn-II(A)Isobaric process of monoatomic gas.(p)1(B)Isobaric process of diatomic gas(q)2(C)Isochoric process of monoatomic gas(r)Minimum at section B(D)Isochoric process of diatomic gas(s)x-axis (i.e.'Q' axis)View Solution

