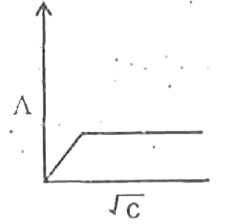
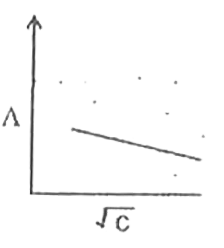
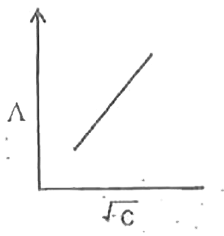
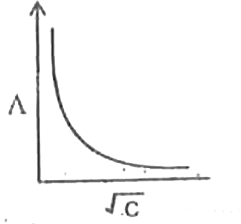
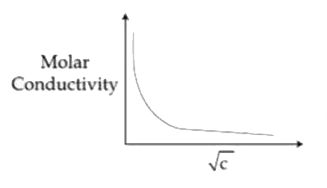
The variation equivalent conductance of stronge electrolyte with √Concentration is correctly shown in the figure.
The correct Answer is:B
To solve the question regarding the variation of equivalent conductance of a strong electrolyte with the square root of concentration, we can follow these steps:
1. Understand the Relationship: We know that for strong electrolytes, the equivalent conductance (Λ) decreases as the concentration (C) increases. This is due to the fact that as the electrolyte is diluted, the number of ions per unit volume increases, leading to higher conductance.
2. Use the Debye-Hückel-Onsager Equation: The relationship can be described by the Debye-Hückel-Onsager equation:
Λ=Λ0−a√C
where:
- Λ is the equivalent conductance at concentration C,
- Λ0 is the equivalent conductance at zero concentration,
- a is a constant related to the electrolyte.
3. Rearrange the Equation: The equation can be rearranged to show the relationship between equivalent conductance and the square root of concentration:
Λ=−a√C+Λ0
This indicates that as √C increases, Λ decreases, which suggests a linear relationship with a negative slope.
4. Graph Interpretation: In the graph:
- The y-axis represents equivalent conductance (Λ).
- The x-axis represents the square root of concentration (√C).
- The graph will start at Λ0 when C=0 and will slope downwards as √C increases.
5. Identify the Correct Graph: Among the provided options:
- Option 1 shows an increase and then a constant conductance, which is incorrect.
- Option 2 shows a decrease in equivalent conductance with increasing √C, which matches our derived equation.
- Option 3 shows an increase in conductance, which is incorrect.
- Option 4 shows an exponential decrease, which is also incorrect.
Therefore, the correct option is Option 2.
Λ=Λ0−a√C
where:
- Λ is the equivalent conductance at concentration C,
- Λ0 is the equivalent conductance at zero concentration,
- a is a constant related to the electrolyte.
Λ=−a√C+Λ0
This indicates that as √C increases, Λ decreases, which suggests a linear relationship with a negative slope.
- The y-axis represents equivalent conductance (Λ).
- The x-axis represents the square root of concentration (√C).
- The graph will start at Λ0 when C=0 and will slope downwards as √C increases.
- Option 1 shows an increase and then a constant conductance, which is incorrect.
- Option 2 shows a decrease in equivalent conductance with increasing √C, which matches our derived equation.
- Option 3 shows an increase in conductance, which is incorrect.
- Option 4 shows an exponential decrease, which is also incorrect.
Similar Questions
The equivalent conductance of strong electrolyte:
View SolutionThe conductivity of a strong electrolyte:
View SolutionAn increase in equivalent conductance of a strong electrolyte with dilution is mainly due to:
View SolutionThe molar conductivity of strong electrolyte
View SolutionThe increase in equivalent conductivity of a weak electrolyte with dilution is due to :
View SolutionThe plot of molar conductance vs √C in strong electrolyte , is
View SolutionThe minimum equivalent conductance in fused state is shown by-
View SolutionThe variation of molar conductivity wih concentration of an electrolyte (X) in aqueous solution is shown in the given figure .
The electrolyte X is :
View SolutionExplain with a graph the variation of molar conductivity of a strong electrolyte with dilution.
View SolutionStatement-I: Equivalent conductance of all electrolytes decreases with increasing concentration.
Because Statement-II: Lesser number of ions ate available per gram equivalent at higher concentration.
View Solution
