The slope of line plotted between In k versus (1/T) Arrhenius equation is given by
(−Ea2.303R)
(-E_a/R)
(−Ea2.303R)
(−REa)
Step by step video & image solution for The slope of line plotted between In k versus (1/T) Arrhenius equation is given by by Chemistry experts to help you in doubts & scoring excellent marks in Class 12 exams.
Topper's Solved these Questions
Similar Questions
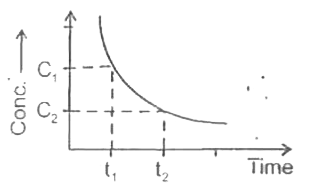
The graph plotted between concentration versus time
 View Solution
The graph between logk versus 1/T is a straight line.
View SolutionA graph plotted between logk versus 1/T for calculating activation energy is shown by
View SolutionThe slope of the plot between pV and p at constant temperature is
View SolutionThe slope of the line graph of logk versus 1/T for the reaction N2O5→2NO2+1/2O2 is −5000.Calculate the energy of activation of the reaction (in kJK−1mol−1).
View SolutionThe plot of In k versus 1T is liner with slope of
View SolutionThe correct plot for In k vs 1/T?
View SolutionThe slope of the line in the graph of log k (k = rate constant) versus 1T is −5841. Calcu late the activation energy of the reaction.
View SolutionThe slope of the line in the graph of logk (k = rate constant) versus 1T for a reaction is - 5841 K. Calculate the energy of activation for this reaction. [R=8.314JK−1mol−]
View SolutionThe slope of the line in the graph of logk (k = rate constant) versus 1T for a reaction is - 5841 K. Calculate the energy of activation for this reaction. [R=8.314JK−1mol−]
View Solution

