The slope of the plot between pV and p at constant temperature is
zero
1
1/2
1/√2
The correct Answer is:A
Plot is a horizontal line. Hence, slope = 0
Similar Questions
The slope of the graph between log P and log V at constant temperature for a given mass of gas is
View SolutionWhat is the type of graph between log P and log V at constant temperature?
View SolutionThe law describing realtionship between P and V of ideal gas at constant temperature is called..........
View SolutionWhat is the nature of curve by plotting P against PV at constant temperature for a gas ? What is the name assigned to this curve ?
View SolutionThe graph between PV vs P at constant temperature is linear parallel to the pressure axis.
View SolutionWhich one of the following plot will be a hyperbola at constant temperature ?
View SolutionGraph between speed v of sound in air and pressure P at a constant temperature is given by
View SolutionWhat is the shape of the curve obtained on plotting P against PV at constant temperature for an ideal gas ?
View SolutionAssertion: The plot of volume (V) versus pressure (P) at constant temperature is a hyperbola in the first quadrant.
Reason: V∝1/P at constant temperature.
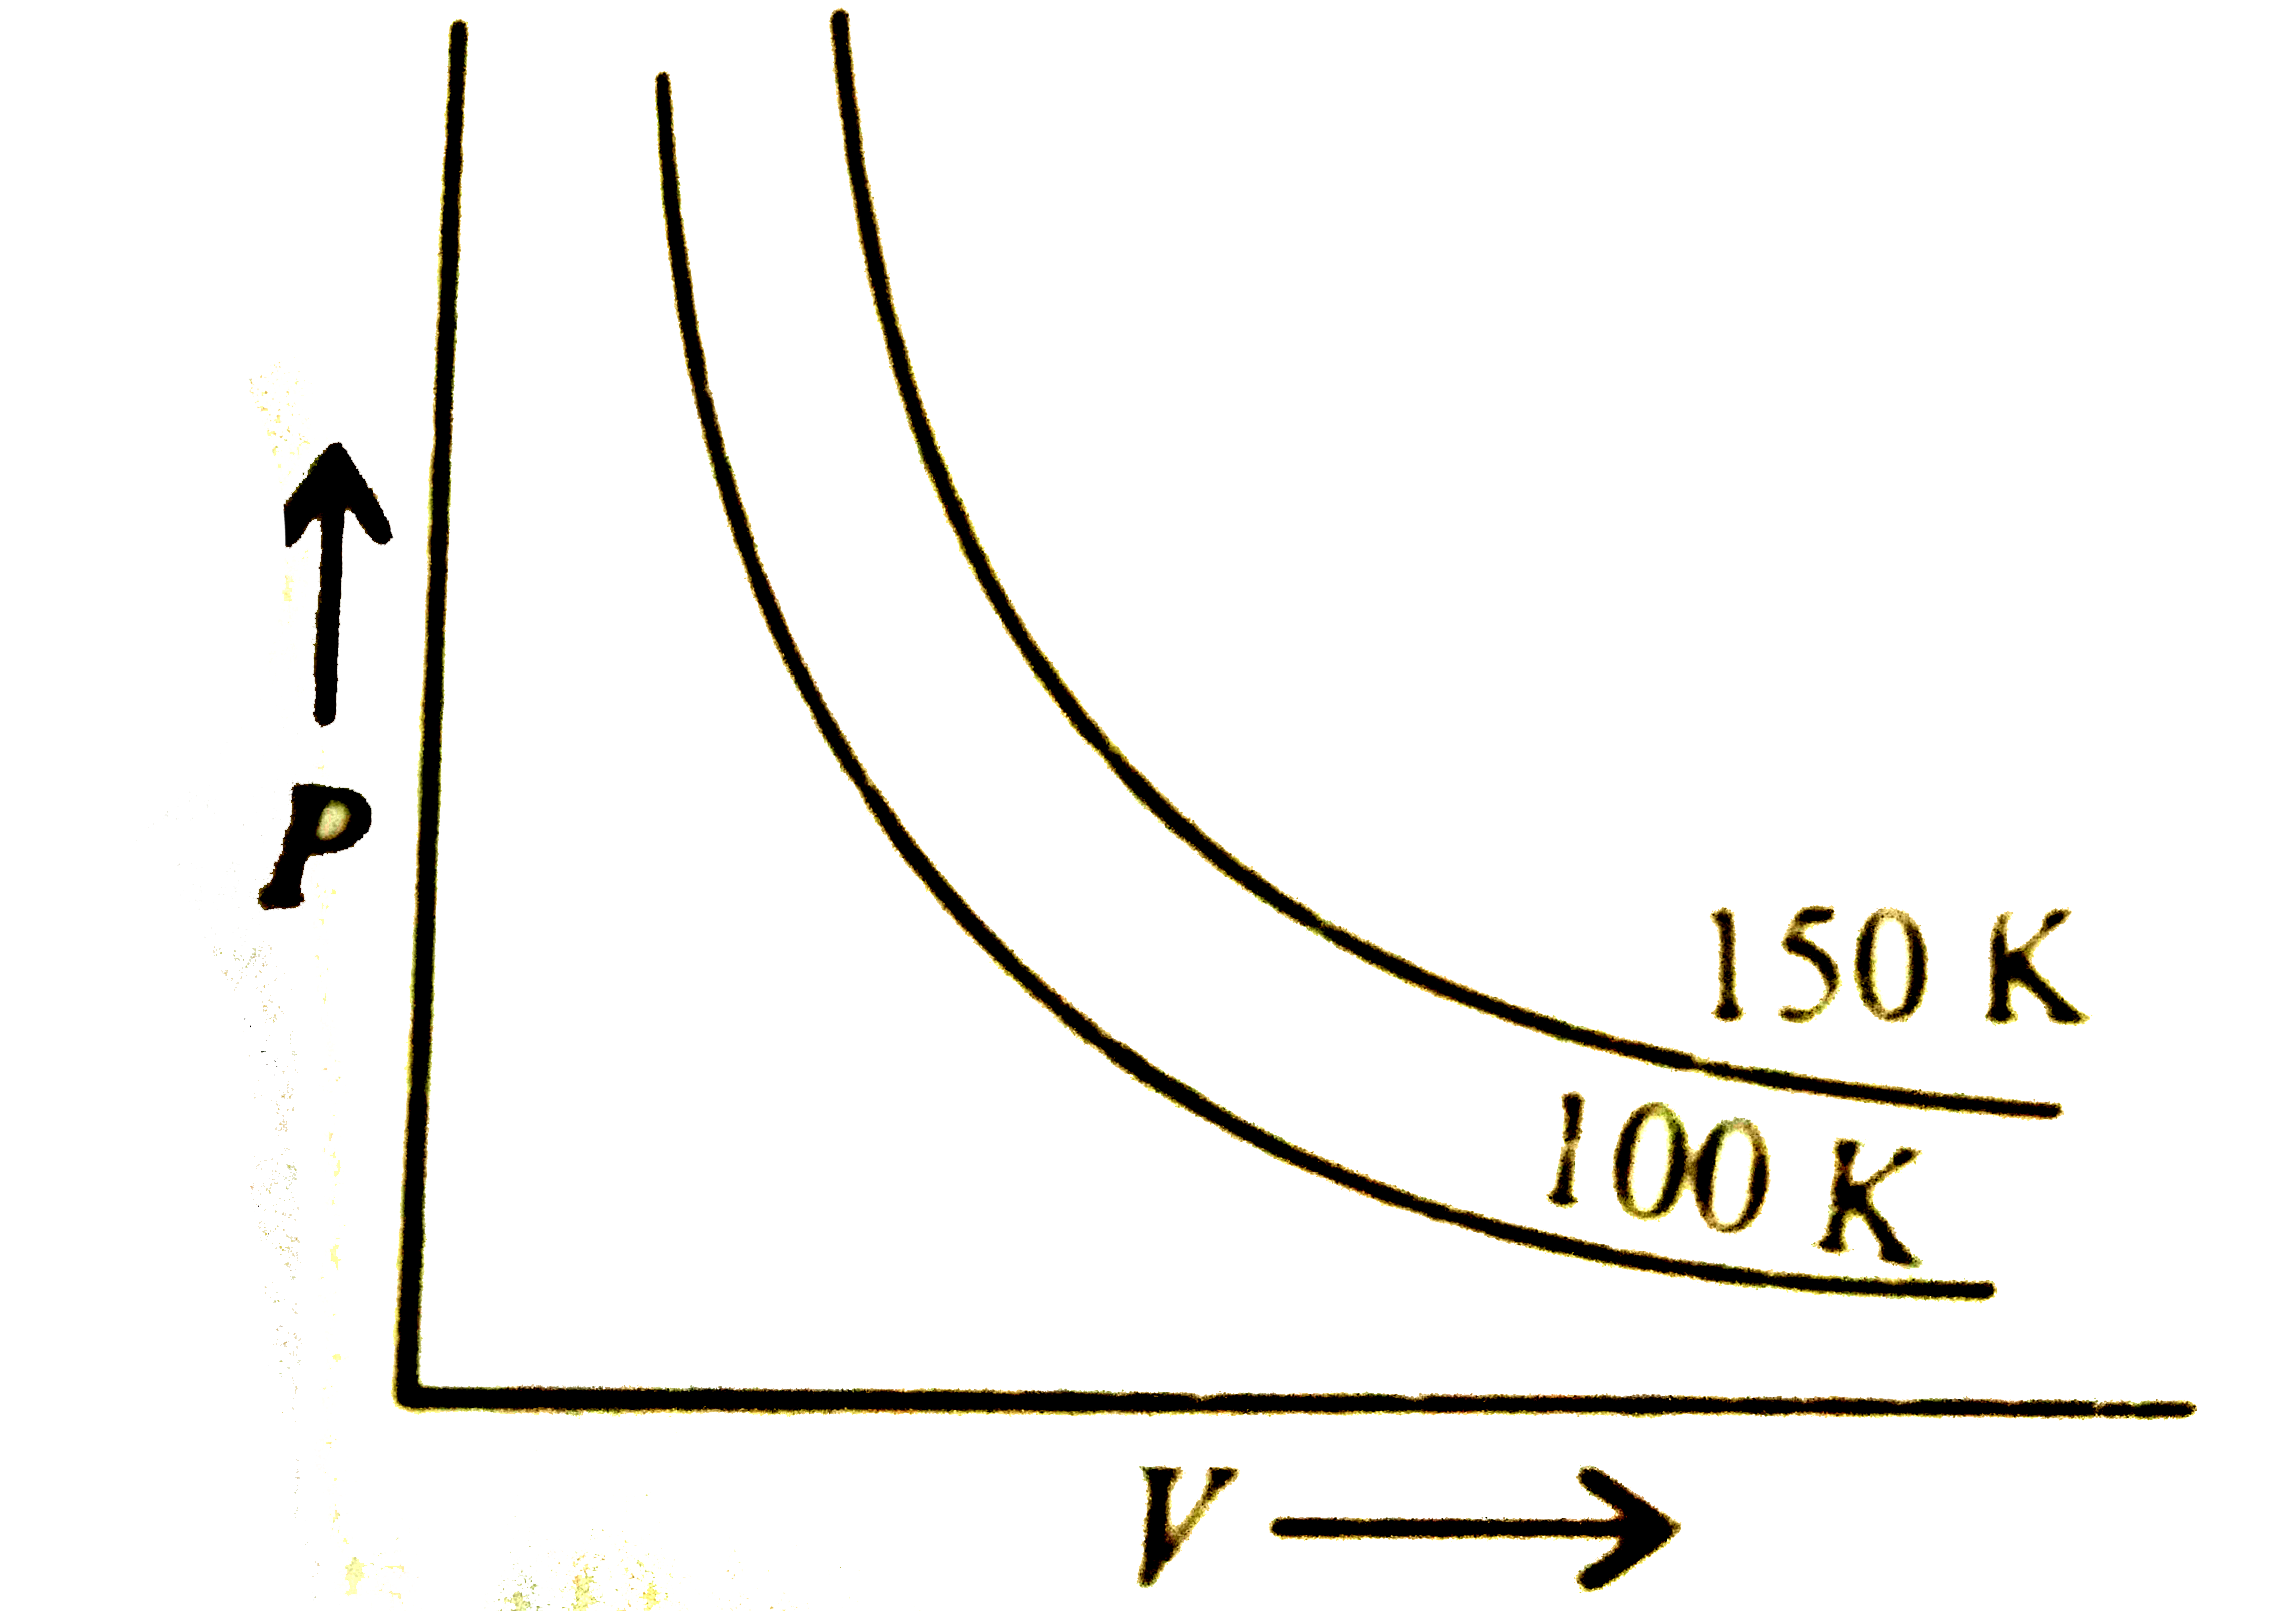
View SolutionA graph is plotted between pressure and volume at different temperatures . On the basis of the graph what changes will you observe in the volume if
(i) the pressure is increased at constant temperature .
(ii) the temperature is decreased at constant pressure .

View Solution
