The graph showing the energy spectrum of β particle is


To solve the question regarding the graph showing the energy spectrum of beta particles, we can follow these steps:
1. Understanding Beta Particles: Beta particles are high-energy, high-speed electrons or positrons emitted by certain types of radioactive nuclei. Their energy can vary.
2. Energy Spectrum of Beta Particles: The energy spectrum of beta particles is characterized by a continuous distribution of energies. This means that beta particles can have a range of energies from a minimum (0) to a maximum value (E_max).
3. Graph Characteristics: The graph representing the energy spectrum of beta particles typically starts at zero energy, rises to a maximum peak, and then returns back to zero. This indicates that there are many beta particles with low energy, fewer with medium energy, and some with maximum energy, but none with energy beyond the maximum.
4. Identifying the Correct Graph: Among the given options, we need to look for a graph that:
- Starts at zero on the energy axis.
- Rises to a peak (indicating the maximum energy).
- Falls back to zero (indicating that no beta particles have energies beyond the maximum).
5. Conclusion: After analyzing the options, we find that option D fits this description perfectly. It starts from zero, peaks at a maximum value, and returns to zero.
Thus, the correct answer is Option D.
- Starts at zero on the energy axis.
- Rises to a peak (indicating the maximum energy).
- Falls back to zero (indicating that no beta particles have energies beyond the maximum).
Similar Questions
Knowledge Check
Assertion: The graph of total energy of a particle in SHM with respect to position is a straight line with zero slope.
Reason: Total energy of particle in SHM remains constant throughout its motion.AIf both assertion and reson are true and reason is the correct explanation of assertionBIf both assertion and reason are true but reason is not the correct explanation of assertion.CIf assertion is true but reason is false.DIf both assertion and reason are false.
(a) Draw the energy level diagram showing the emission of β-particles followed by γ-rays by a .6027Co nucleus.
(b) Plot the distribution of kinetic enrgy of β-particles and state why the energy spectrum is continous.
View SolutionThe energy spectrum of β - particle [number N(E) as a function of β - energy E] emitted from a radioactive source is
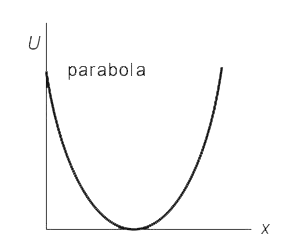
View SolutionThe first graph shows the potential energy U(x) for a particle moving on the x axis. Which of the other four graphs correctly gives the force F exerted on the particle?

View SolutionThe acceleration versus time graph of a particle is shown in. The respective v−t graph of the particle is .
 .
.
View SolutionAssertion : The graph of potential energy and kinetic energy of a particle in SHM with respect to position is a parabola.
Reason : Potential energy and kinetic energy do not vary linearly with position.
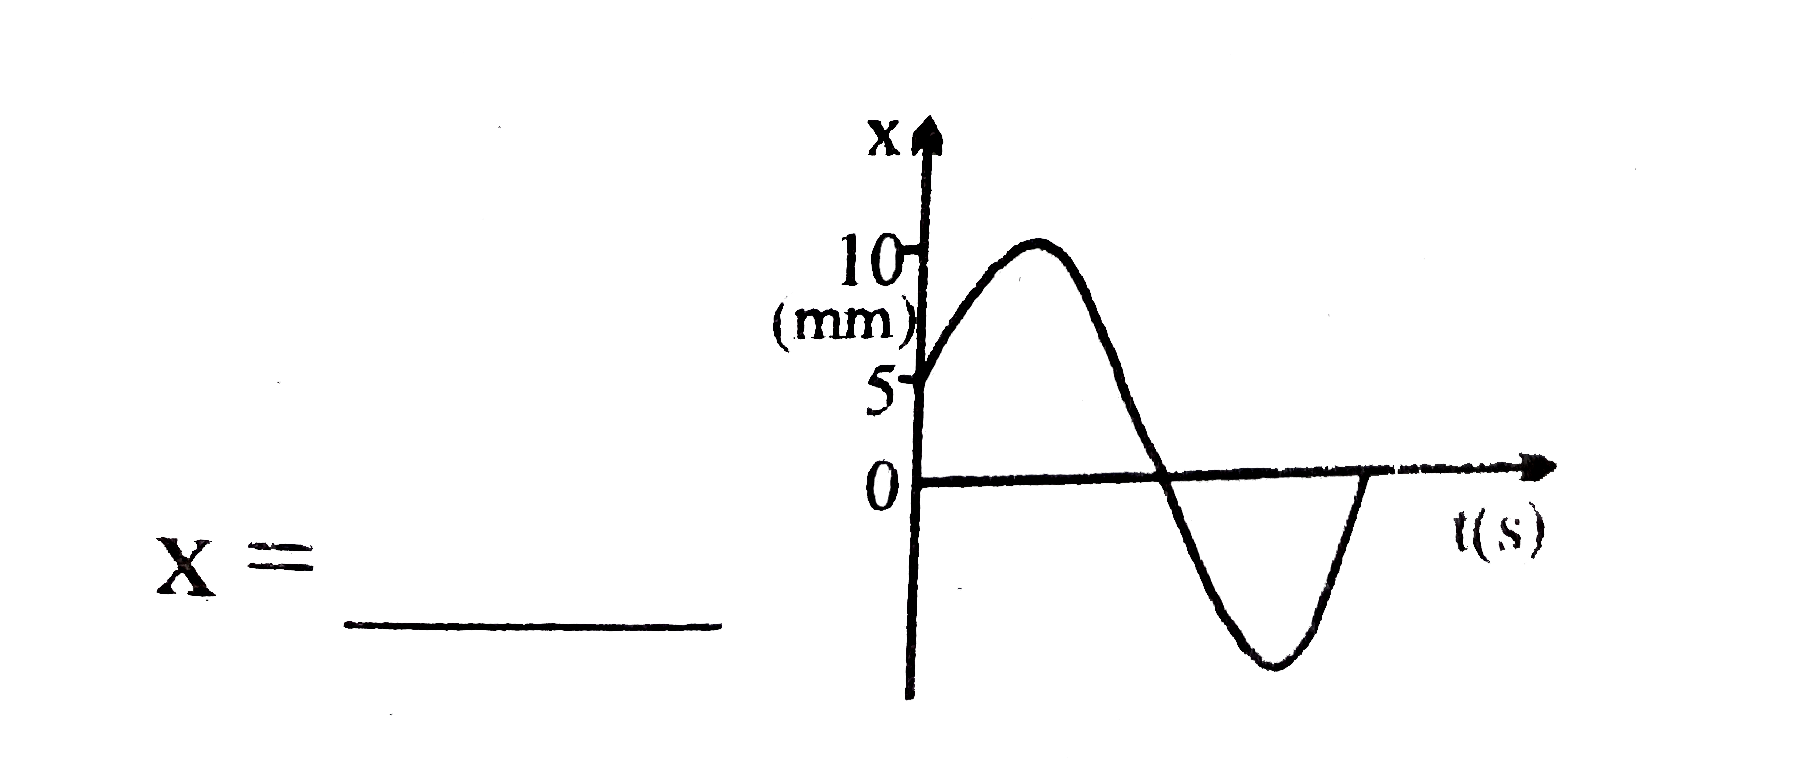
View SolutionThe figure shows the displacement-time graph of a particle executing SHM. If the time period of oscillation is 2s, then the equation of motion is given by

View SolutionThe figure shows the displacement-time graph of a particle executing SHM. If the time period of oscillation is 2s, then the equation of motion is given by

View Solution


_E01_037_Q01.png)