A population of horses is split into two population by a new river bed that forms after a flood. After many generations,the river changes course and the population mix again. Which of the following indicates that the two population have formed two separate species?
The population refuse to cross the dry river bed to interbreed
The population do not interbreed freely in nature
One population has twice as many horses with white spots as others
The horses interbreed,but the offsprings are shorter either of the parents
Step by step video & image solution for A population of horses is split into two population by a new river bed that forms after a flood. After many generations,the river changes course and the population mix again. Which of the following indicates that the two population have formed two separate species? by Biology experts to help you in doubts & scoring excellent marks in Class 12 exams.
Updated on:21/07/2023Topper's Solved these Questions
Similar Questions
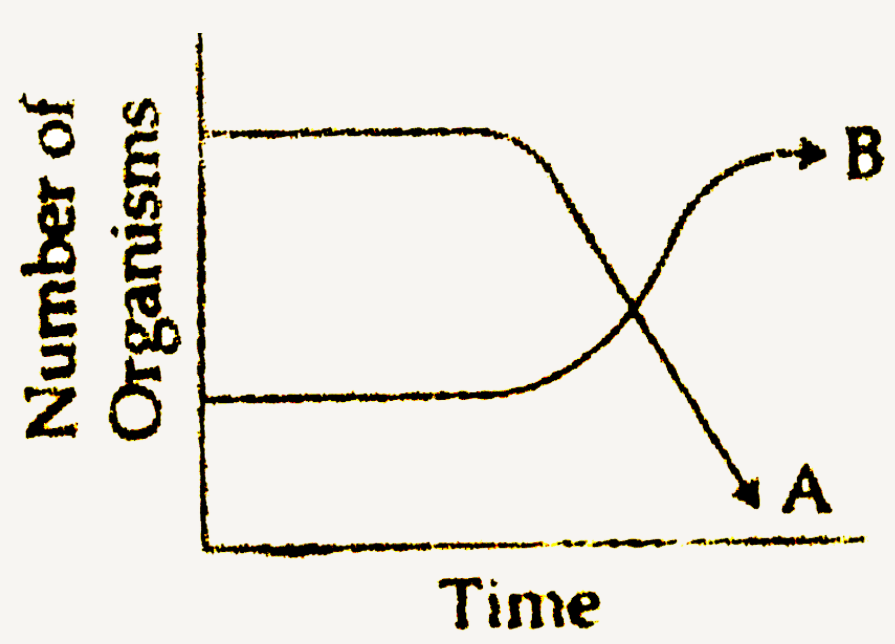
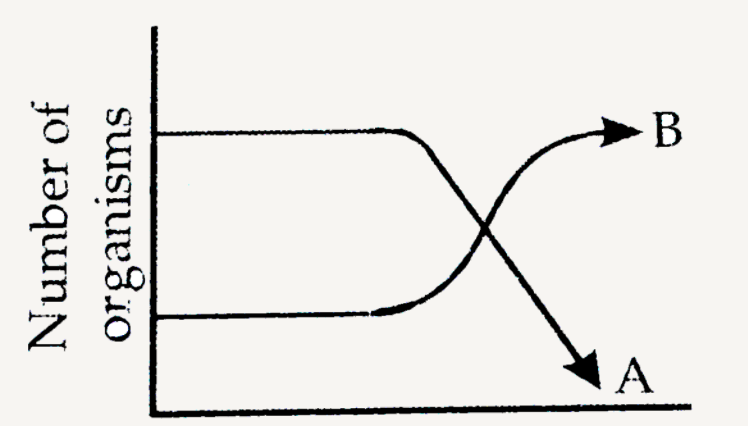
The following graph depicts changes in two populations A and B of herbivores in a grassy field. A possible reason for these changes is that

View SolutionThe population of a town is increasing at the rate of 5% per annum. What will be the population of the town on this basis after two years, if the present population is 16000?
View Solution
Knowledge Check
An inter-breeding population of finches became separated geographically, forming two isolated groups. Each group then became subect to different selective pressures. One group was then introduced into the habitat of the other.
Which one of the following would determiner wheather they now formed two district species?AThey had been separated for more than three milion years.BThey failed to produce fertile F1 hybrids.CThey showed marked differences in the shape of their beaks.DTheir plumage had become markely different.On January 1, 2015, a family living on an island releases their two pet rabbits into the wild. Due to the short gestation period of rabbits, and the fact that the rabbit population doubles each month. If p represents the rabbit population t years after January 1, 2015, then which of the following equations best models the rabbit population on this island over time?
Ap=2t+1212Bp=2t+1Cp=212tDp=212t+1Scientists plotted data for two animal populations on a scatterplot: population A, which they graphed along the x-axis, and population B, which they graphed along the y-axis. The data showed a strong negative correlation. Which of the following statements is justified ?
AThe rise in population A caused the decline in population B.BThe decline in population B caused the rise in population A.CBecause the correlation is negative, there cannot be causation between the two populations.DThe rise in populatin A is correlated to the decline in population B, but causation is unknown.
The population of a village is 20000. If the annual birth rate is 4% and the annual death rate 2%, calculate the population after two years.
View SolutionThe phenomenon in which genes have two or more alleles that are common in a population is known as
View SolutionThe following graph depicts changes in two populations (A and B) of herbivores in a grassy field. A possible reson for these changes is that

View SolutionThe following graph depicts changes in two populations (A and B) of herbivores in a grassy field A possible reason for these changes is that

View SolutionTwo bands of a population come together after a period of isolation. Speciation will have taken place if the two groups
View Solution
