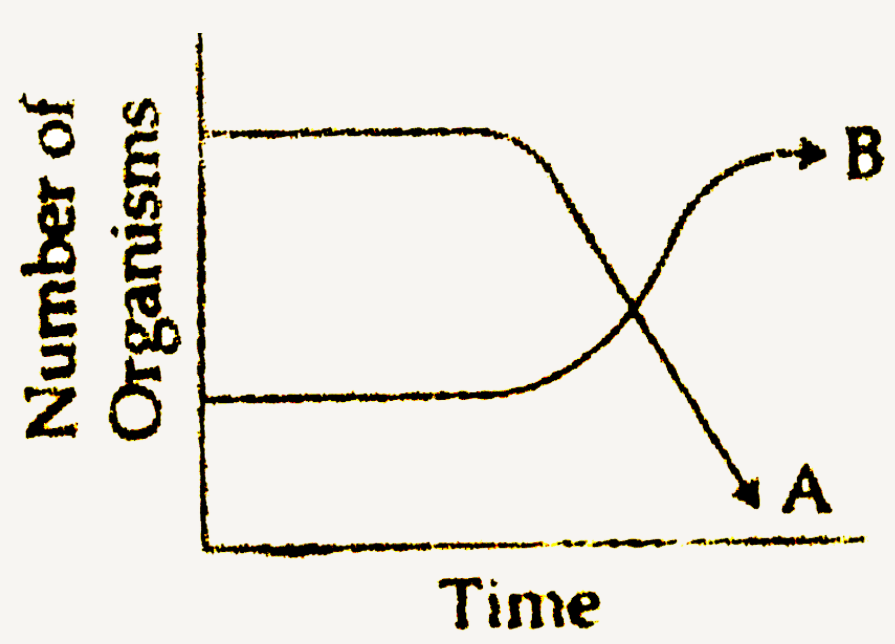
The following graph depicts changes in two populations A and B of herbivores in a grassy field. A possible reason for these changes is that

Popuation A consumed the members of population B
Both plant population in this habitat decreased
Population B competed more successfully for food than population A
Population A produced more offspring than population B
The correct Answer is:C
Step by step video & image solution for The following graph depicts changes in two populations A and B of herbivores in a grassy field. A possible reason for these changes is that by Biology experts to help you in doubts & scoring excellent marks in Class 11 exams.
Updated on:21/07/2023Topper's Solved these Questions
- ECOSYSTEMBOOK - AAKASH SERIESCHAPTER - ECOSYSTEMEXERCISE - EXERCISE-II (ECOSYSTEM SERVICES)
11 Videos
- CELL CYCLE AND CELL DIVISIONBOOK - AAKASH SERIESCHAPTER - CELL CYCLE AND CELL DIVISIONEXERCISE - Exercise-III
18 Videos
- ENVIRONMENTAL ISSUESBOOK - AAKASH SERIESCHAPTER - ENVIRONMENTAL ISSUESEXERCISE - Exercise-III (Previous AIPMT/NEET Questions)
41 Videos
Similar Questions
The following graph depicts changes in two populations (A and B) of herbivores in a grassy field. A possible reson for these changes is that

View SolutionWhich of the following graphs best depicts the changes in one cycle of PCR ?
View SolutionGive the formula for the change in population size.
View SolutionThe accompanying figure depicts a change in concentration of species A and B for the reaction A→B, as a function of time. The point of inter section of the two curves represents

View SolutionThe following graphs (A and B) depicts changes in DNA Content during cell cycle. Identify the cell divison from A and B :-

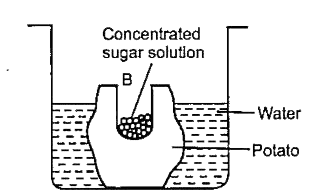
View SolutionStudy the set-up shown in the diagram and answer the following:

What change will you observe in part 'B' of the setup after one hour? Give reason for this change.
View SolutionA population of horses is split into two population by a new river bed that forms after a flood. After many generations,the river changes course and the population mix again. Which of the following indicates that the two population have formed two separate species?
View SolutionGiven an example where physisorption changes to chemisorption with rise in temperature. Explain the reason for change.
View SolutionWhich of the following change is possible in aqueous medium -
View SolutionIf change in gene frequencies in a population occurs by chance, then it is called as:
View Solution
