खालीलपैकी योग्य पर्याय निवडा.
खालील सारणीनुसार 30-40 ह्या वर्गाची वरच्या वर्गमर्यादेपेक्षा कमी संचित वारंवारता किती?
13
15
35
22
The correct Answer is:C
Step by step video & image solution for खालीलपैकी योग्य पर्याय निवडा. खालील सारणीनुसार 30-40 ह्या वर्गाची वरच्या वर्गमर्यादेपेक्षा कमी संचित वारंवारता किती? by Maths experts to help you in doubts & scoring excellent marks in Class 9 exams.
Updated on:21/07/2023Topper's Solved these Questions
Similar Questions
एका शाळेतील इयत्ता विच्या विघाथ्र्यानि प्रथम घटक चाचणीत गणितात पैकी मिळवलेले गुण खालीलप्रमाणे आहेत.20, 6, 14, 10, 13, 15,12,14,17, 17, 18,11,19,9,16,18,14, 7,17,20,8,15,16,10,15,12,18,17,12,11,11,10,16,14,16,18,10,7,17,14,20,17,13,15,18,20,12,12,15,10
येथे संकलित केलेल्या संख्यात्मक माहितीस काय म्हणतात ?....कच्ची सामग्री.
यातील प्रत्येक संख्याले काय म्हणतात ?...प्राप्तक.
वरील माहितीवरून खालील प्रश्नाची उत्तरे मिळवा.
(i) 15 गुण मिळवणारे एकूण विध्यार्थी किती ?
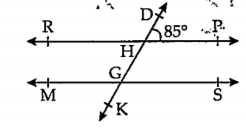
View Solutionआकृतीमध्ये रेषा RP || रेषा MS व रेषा DK ही त्यांची छेदिका आहे. ∠ DHP = 85∘ तर खालील कोनांची मापे काढा.

∠RHD
View SolutionHow many lines of symmetry does the above figure have ?
View SolutionWhich of the following are correct chain isomers of butane ? (i)
View SolutionDetermine the point of symmetry of a regular hexagon.
View SolutionDtermine the images of the following figure about the given line :
View SolutionMatch the following Column A to Column B

View SolutionMatch the following Column A to Column B

View SolutionMatch the following Column A to Column B

View SolutionFind the area of the figure given below.

View SolutionThe area of the shaded part in the figure given below is ______.

View SolutionThe inequation represented by the graph given below is :
View SolutionThe inequation that best describes the graph given below is _________
View SolutionThe inequation that best describes the following graph is _________
View SolutionWhich inequations represent the shaded region in the given figure
View SolutionIn Fig, find the value of x.
ltimg src="https://d10lpgp6xz60nq.cloudfront.net/physics_images/PS_MATH_IX_C12_S01_032_Q01.png" width="80%"gt
View Solution
