The diagram in Fig. shows three ways in which a string of length I in an instrument can vibrate.

Which of the diagram shows the principal note?
(i)
Topper's Solved these Questions
- SOUNDBOOK - ICSECHAPTER - SOUNDEXERCISE - EXERCISE -7(B)( MULTIPLE CHOICE TYPE)
2 Videos
- SOUNDBOOK - ICSECHAPTER - SOUNDEXERCISE - EXERCISE -7(C )
47 Videos
- SOUNDBOOK - ICSECHAPTER - SOUNDEXERCISE - EXERCISE -7(A) (NUMERICALS )
14 Videos
- SIMPLE MACHINES BOOK - ICSECHAPTER - SIMPLE MACHINES EXERCISE - DIAGRAM BASED MCQ
5 Videos
- SPECIMEN PAPER (SOLVED)BOOK - ICSECHAPTER - SPECIMEN PAPER (SOLVED)EXERCISE - SECTION II
78 Videos
Similar Questions
The diagram in Fig. shows three ways in which a string of length I in an instrument can vibrate.

Which vibration is of the longest wavelength ?
View SolutionThe diagram in Fig. shows three ways in which a string of length I in an instrument can vibrate.

Which vibration has a frequency four times that of the first?
View SolutionThe diagram in Fig. shows three ways in which a string of length I in an instrument can vibrate.

What is the ratio of frequency of vibrations in diagrams (i) and (ii) ?
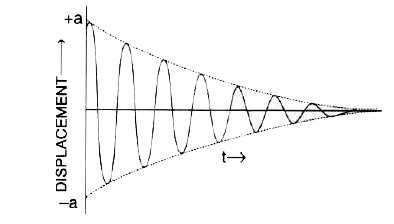
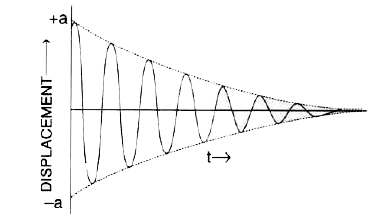
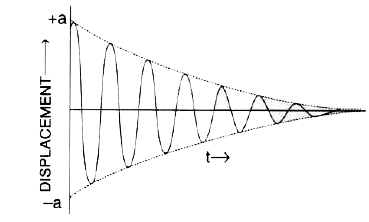
View SolutionThe diagram in Fig. shows the displacement time graph of a vibrating body.

Name the kind of vibrations.
View SolutionThe diagram in Fig. shows a three pin plug. Label the three pins.

Why are the pins splitted at the ends?
View SolutionThe diagram in Fig. shows the displacement time graph of a vibrating body.

What happens to the vibrations of the body after some time?
View SolutionThe diagram in Fig. shows the displacement time graph of a vibrating body.

Give one example of such vibrations.
View SolutionThe diagram in Fig. shows a three-pin socket marked as 1, 2 and 3.

To which part of the appliance is the terminal 1 connected ?
View SolutionThe diagram in Fig. shows a three pin plug. Label the three pins.

Why is the top pin thicker and longer than the other two ?
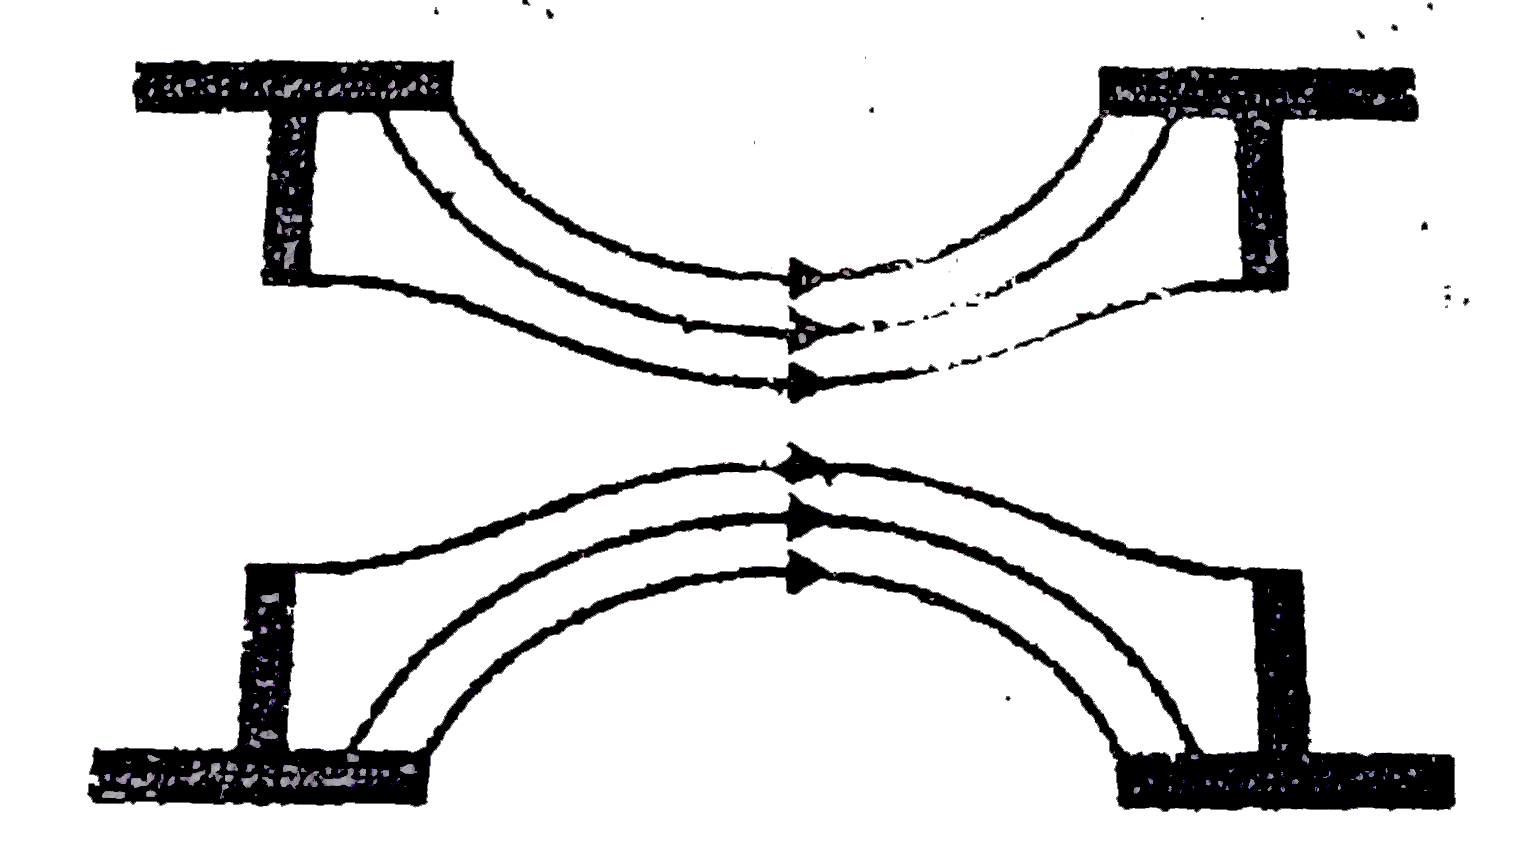
View SolutionThe diagram shows the electric field lines produced by an electrostalic focusing device.

Which one of the following diagrams best shows the corresponding equipotential lines? The electric field are shown as broken lines on each of the diagrams.
View Solution