Sketches I to IV in Fig. show sound waves, all formed in the same time interval.
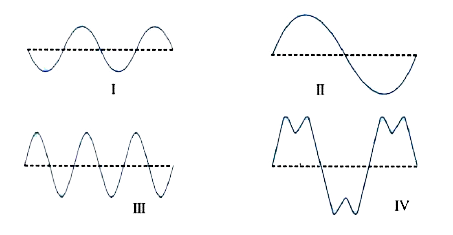
Which diagram shows
a bass (or low frequency) note.
(II)
Topper's Solved these Questions
- SOUNDBOOK - ICSECHAPTER - SOUNDEXERCISE - EXERCISE -7(C ) (MULTIPLE CHOICE TYPE)
3 Videos
- SOUNDBOOK - ICSECHAPTER - SOUNDEXERCISE - THEORY BASED MCQ
4 Videos
- SOUNDBOOK - ICSECHAPTER - SOUNDEXERCISE - EXERCISE -7(B)( MULTIPLE CHOICE TYPE)
2 Videos
- SIMPLE MACHINES BOOK - ICSECHAPTER - SIMPLE MACHINES EXERCISE - DIAGRAM BASED MCQ
5 Videos
- SPECIMEN PAPER (SOLVED)BOOK - ICSECHAPTER - SPECIMEN PAPER (SOLVED)EXERCISE - SECTION II
78 Videos
Similar Questions
Sketches I to IV in Fig. show sound waves, all formed in the same time interval.
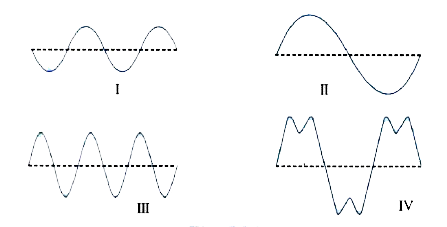
Which diagram shows
a soft (or feeble) note,
View SolutionSketches I to IV in Fig. show sound waves, all formed in the same time interval.
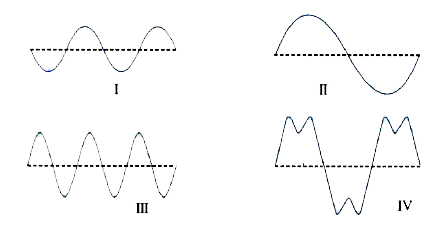
Which diagram shows
a note from a musical instrument,
View SolutionThe diagram in Fig. shows three ways in which a string of length I in an instrument can vibrate.

Which vibration has a frequency four times that of the first?
View SolutionThe diagram in Fig. shows three ways in which a string of length I in an instrument can vibrate.

Which of the diagram shows the principal note?
View SolutionThe diagram in Fig. shows three ways in which a string of length I in an instrument can vibrate.

What is the ratio of frequency of vibrations in diagrams (i) and (ii) ?
View Solution(a) What happens when two sound waves of equal frequencies and amplitude travelling in the same direction are superposed ?
(b) Draw a diagram to show the formation of beats,
(c) Derive an expression for the beat frequency.
View SolutionThe figure shows the snapshot of a sound wave in a certain medium at a certain instant.

If a wave of same type but with higher frequency is passed in the given medium, will the speed of the wave increase, decrease or remain the same?
View SolutionRepresent graphically by two separate diagrams in each case :
(i) Two sound waves having the same amplitude but different frequencies.
(ii) Two sound waves having the same frequency but different amplitudes.
(iii) Two wound waves having different amplitudes and also different wavelengths.
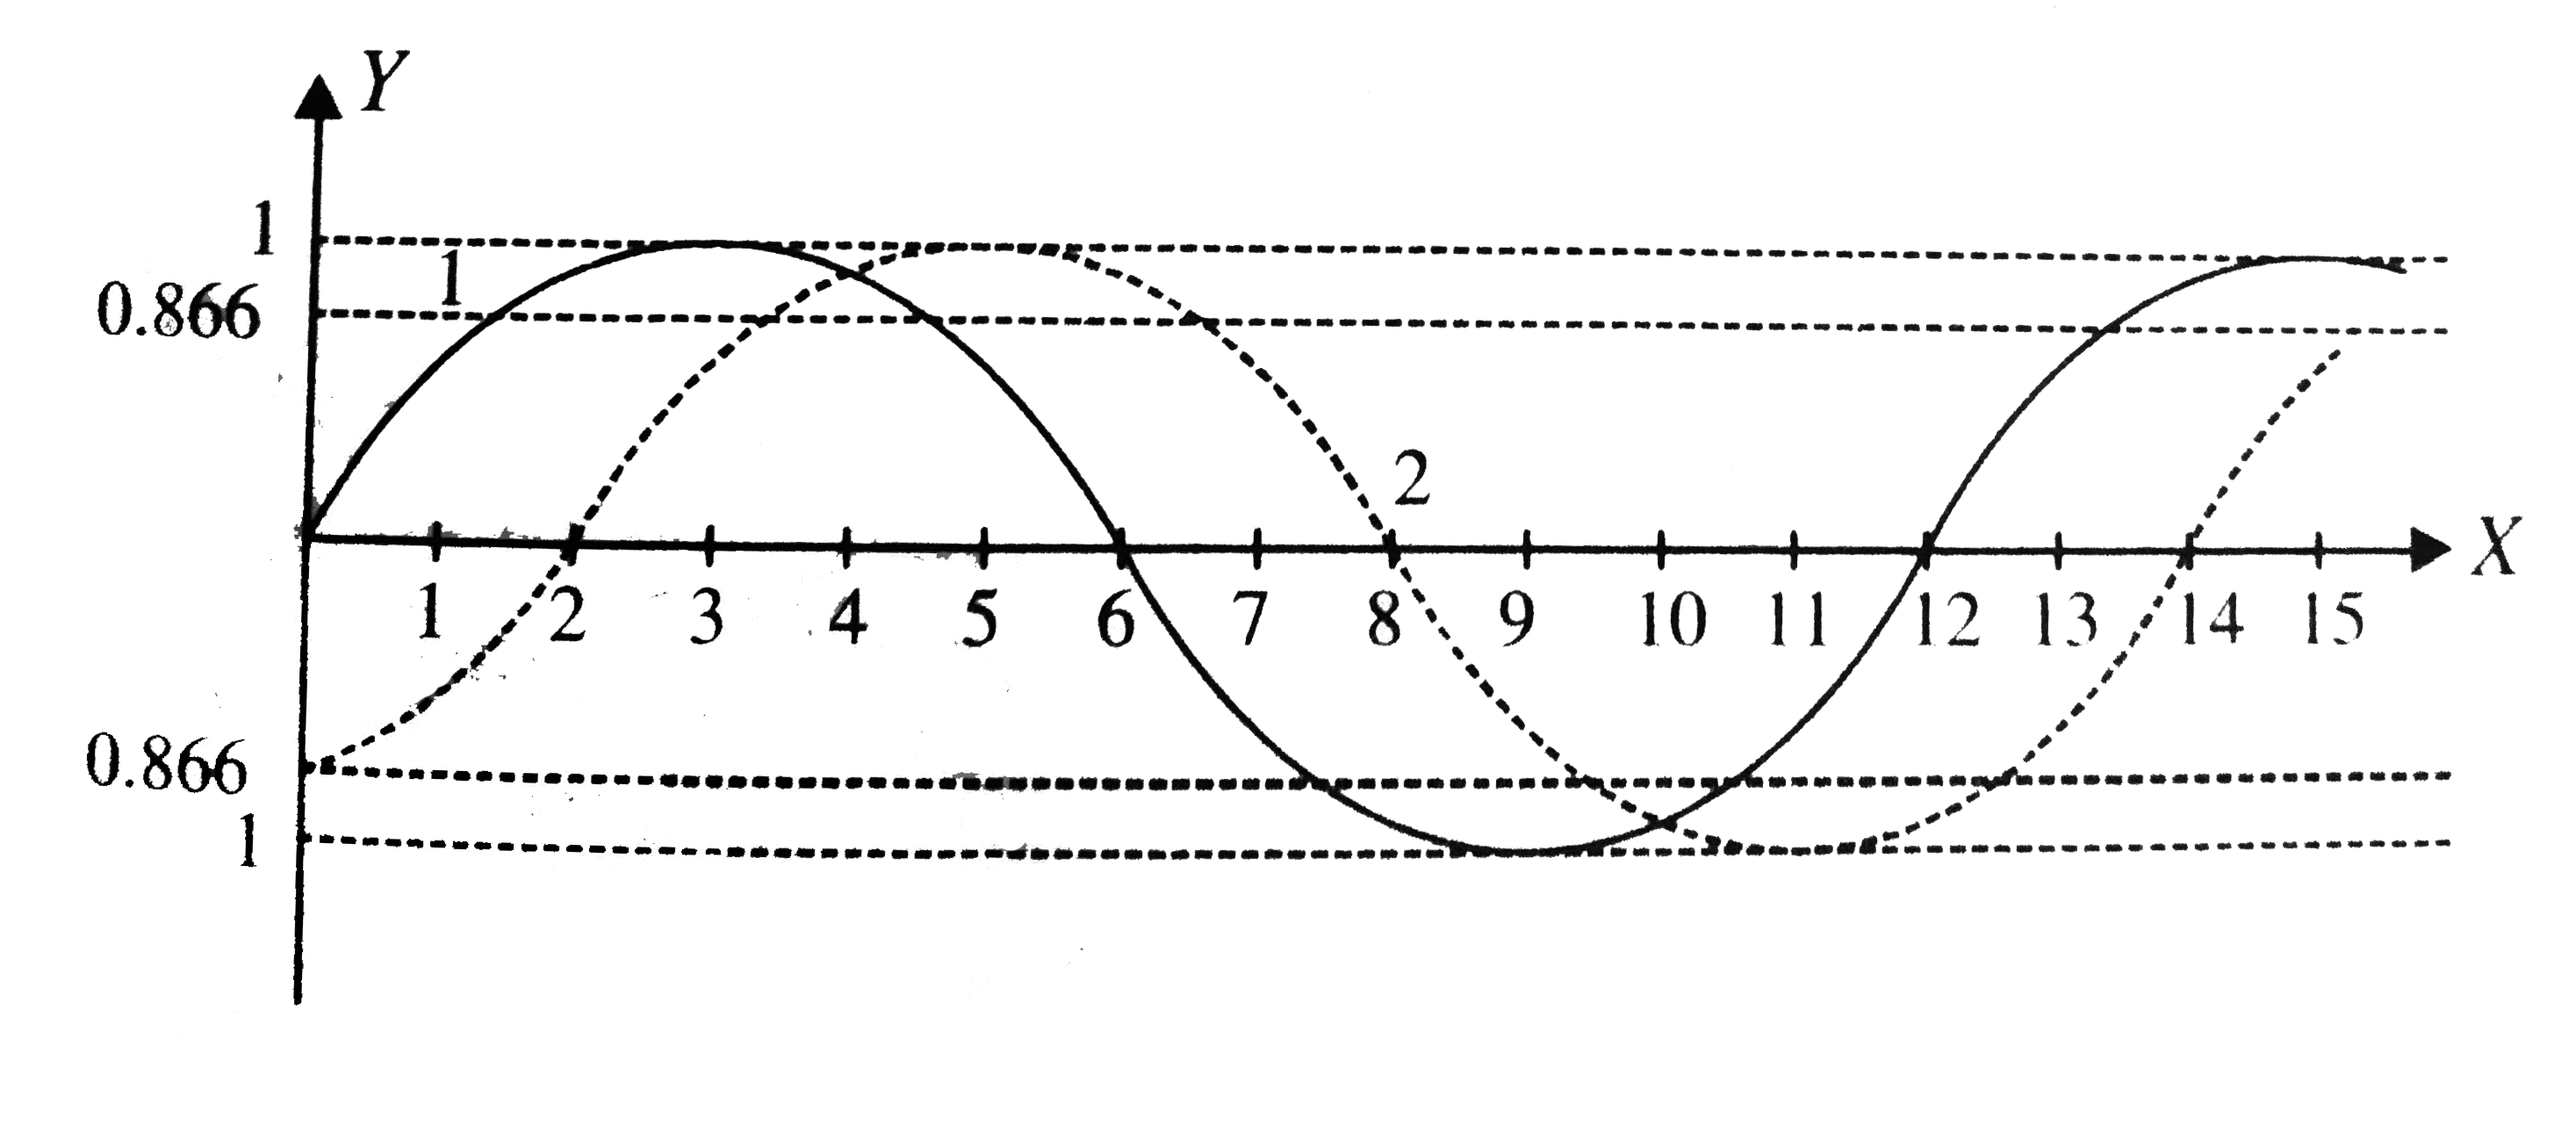
View SolutionFigure shows two snapshots of medium particle within a time interval of 160 s. find the possible time periods of the wave
View SolutionThe diagram in Fig. shows the displacement time graph of a vibrating body.
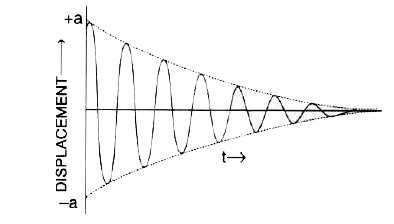
Name the kind of vibrations.
View Solution
