A slab of ice at C is constantly heated till the steam is formed at C. Draw a graph showing the change in temperature with time. Label the various parts of the graph properly.
To solve the problem of drawing a graph showing the change in temperature with time as ice is heated to form steam, we can break down the process into distinct phases. Here’s a step-by-step solution:
Step 1: Understand the phases of heating
1. Melting of Ice: The initial phase involves heating ice at 0°C. The ice will absorb heat and start melting, but the temperature will remain constant at 0°C until all the ice has melted into water.
2. Heating of Water: Once all the ice has melted, the water will begin to heat up from 0°C to 100°C. This phase will show a gradual increase in temperature.
3. Vaporization of Water: At 100°C, the water will start to vaporize into steam. During this phase, the temperature will remain constant at 100°C until all the water has turned into steam.
Step 2: Draw the axes
- Y-axis: Represents temperature (°C).
- X-axis: Represents time.
Step 3: Plot the phases on the graph
1. Phase 1 (Melting of Ice): Draw a horizontal line at 0°C for a certain duration (let's call this time T1). This line indicates that the temperature remains constant while the ice is melting.
2. Phase 2 (Heating Water): After T1, draw an upward sloping line from 0°C to 100°C over a period of time (let's call this time T2). This line represents the increase in temperature of the water.
3. Phase 3 (Vaporization of Water): After reaching 100°C, draw another horizontal line at 100°C for a certain duration (let's call this time T3). This line indicates that the temperature remains constant while the water is vaporizing into steam.
Step 4: Label the graph
- Label the horizontal line at 0°C as "Melting of Ice".
- Label the upward slope as "Heating of Water".
- Label the horizontal line at 100°C as "Vaporization of Water".
Final Graph
The final graph will show three distinct phases:
- A flat line at 0°C (Melting of Ice).
- An upward slope from 0°C to 100°C (Heating of Water).
- A flat line at 100°C (Vaporization of Water).
1. Melting of Ice: The initial phase involves heating ice at 0°C. The ice will absorb heat and start melting, but the temperature will remain constant at 0°C until all the ice has melted into water.
2. Heating of Water: Once all the ice has melted, the water will begin to heat up from 0°C to 100°C. This phase will show a gradual increase in temperature.
3. Vaporization of Water: At 100°C, the water will start to vaporize into steam. During this phase, the temperature will remain constant at 100°C until all the water has turned into steam.
- Y-axis: Represents temperature (°C).
- X-axis: Represents time.
1. Phase 1 (Melting of Ice): Draw a horizontal line at 0°C for a certain duration (let's call this time T1). This line indicates that the temperature remains constant while the ice is melting.
2. Phase 2 (Heating Water): After T1, draw an upward sloping line from 0°C to 100°C over a period of time (let's call this time T2). This line represents the increase in temperature of the water.
3. Phase 3 (Vaporization of Water): After reaching 100°C, draw another horizontal line at 100°C for a certain duration (let's call this time T3). This line indicates that the temperature remains constant while the water is vaporizing into steam.
- Label the horizontal line at 0°C as "Melting of Ice".
- Label the upward slope as "Heating of Water".
- Label the horizontal line at 100°C as "Vaporization of Water".
The final graph will show three distinct phases:
- A flat line at 0°C (Melting of Ice).
- An upward slope from 0°C to 100°C (Heating of Water).
- A flat line at 100°C (Vaporization of Water).
Topper's Solved these Questions
- BOOK - ICSECHAPTER - CALORIMETRYEXERCISE - EXERCISE-11(A)30videos
CALORIMETRY
- BOOK - ICSECHAPTER - CALORIMETRYEXERCISE - EXERCISE-11(A) (MULTIPLE CHOICE TYPE)3videos
CALORIMETRY
- BOOK - ICSECHAPTER - WORK ENERGY AND POWEREXERCISE - EXERCISE-2(C ) NUMERICALS6videos
WORK ENERGY AND POWER
- BOOK - ICSECHAPTER - CURRENT ELECTRICITYEXERCISE - EXERCISE-8(C) NUMERICALS35videos
CURRENT ELECTRICITY
Similar Questions
A certain mass of ice at 0∘C is converted to steam at 100∘C by constant heating, Draw temperature-time graph showing the change in phases.
View SolutionA certain mass of ice at 0∘C is converted to steam at 100∘C by constant heating, Draw temperature-time graph showing the change in phases.
View Solution
Knowledge Check
- Question 1 - Select One
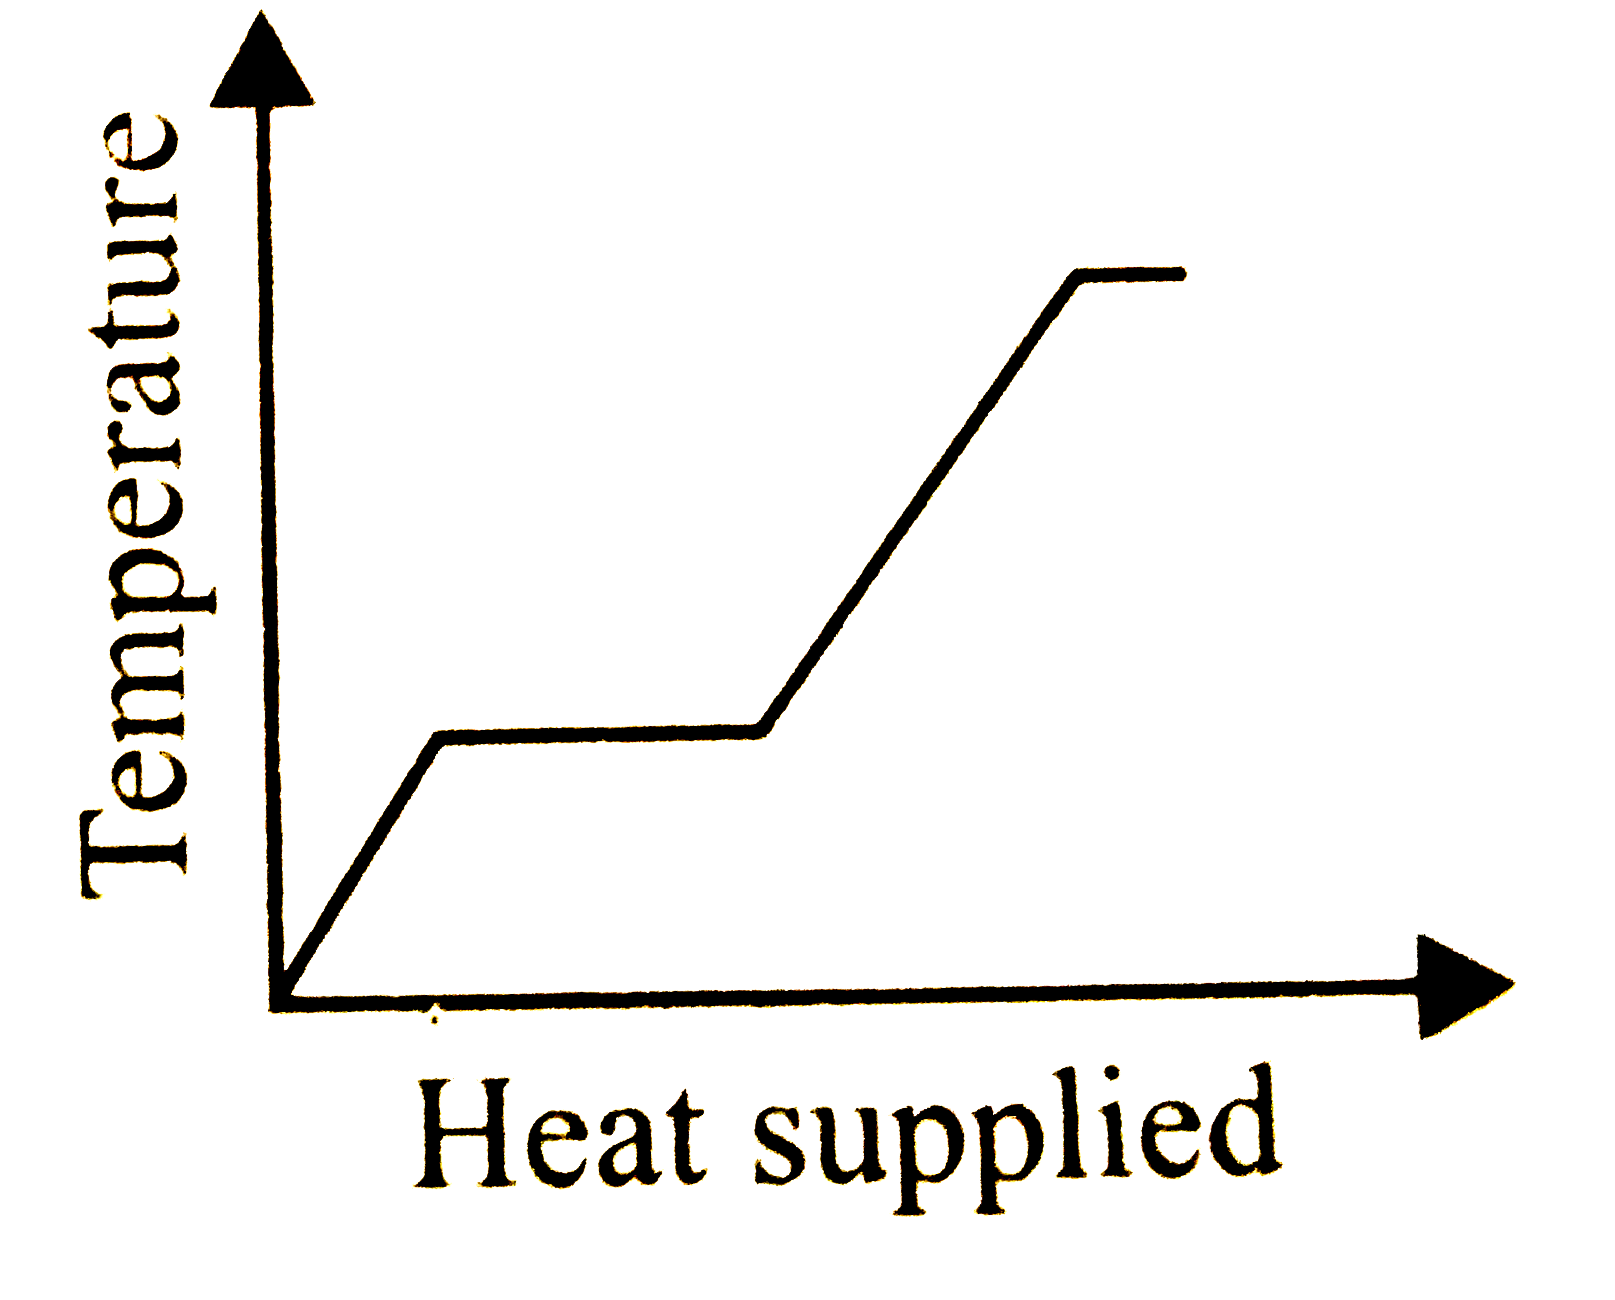
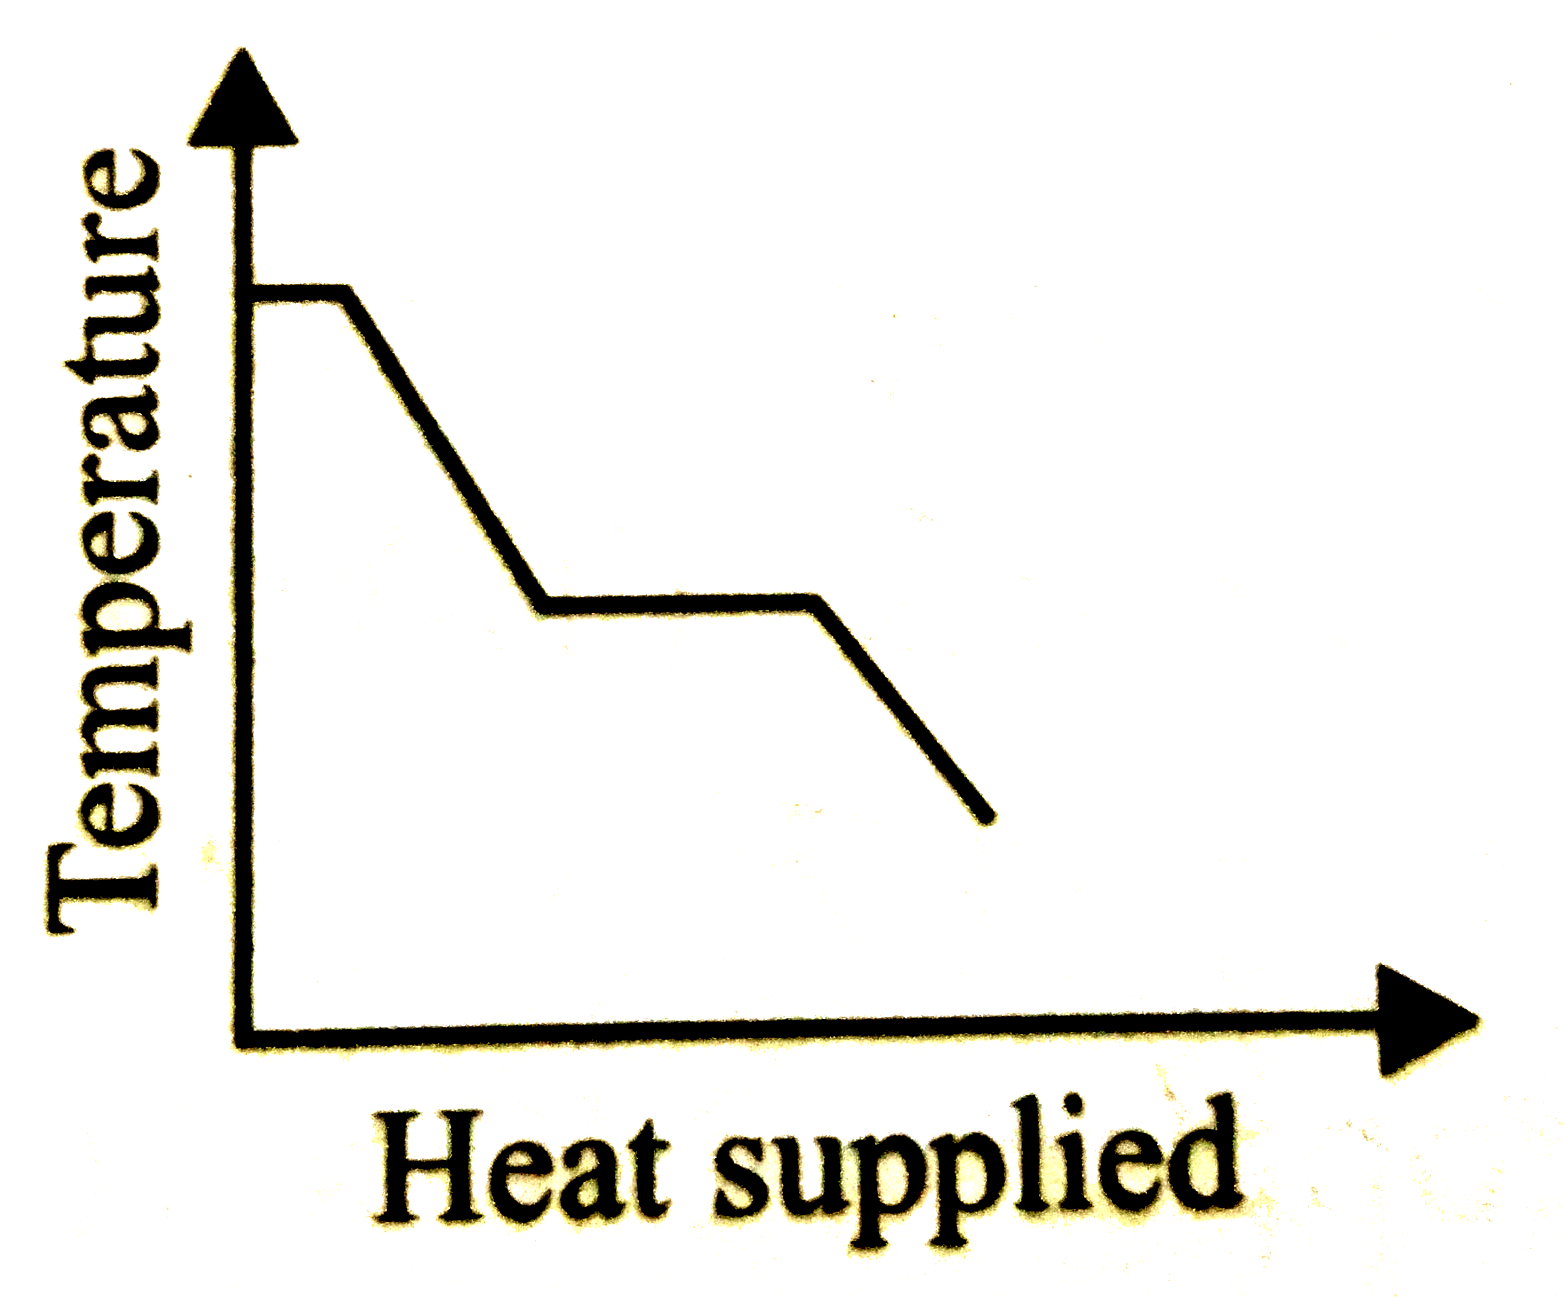
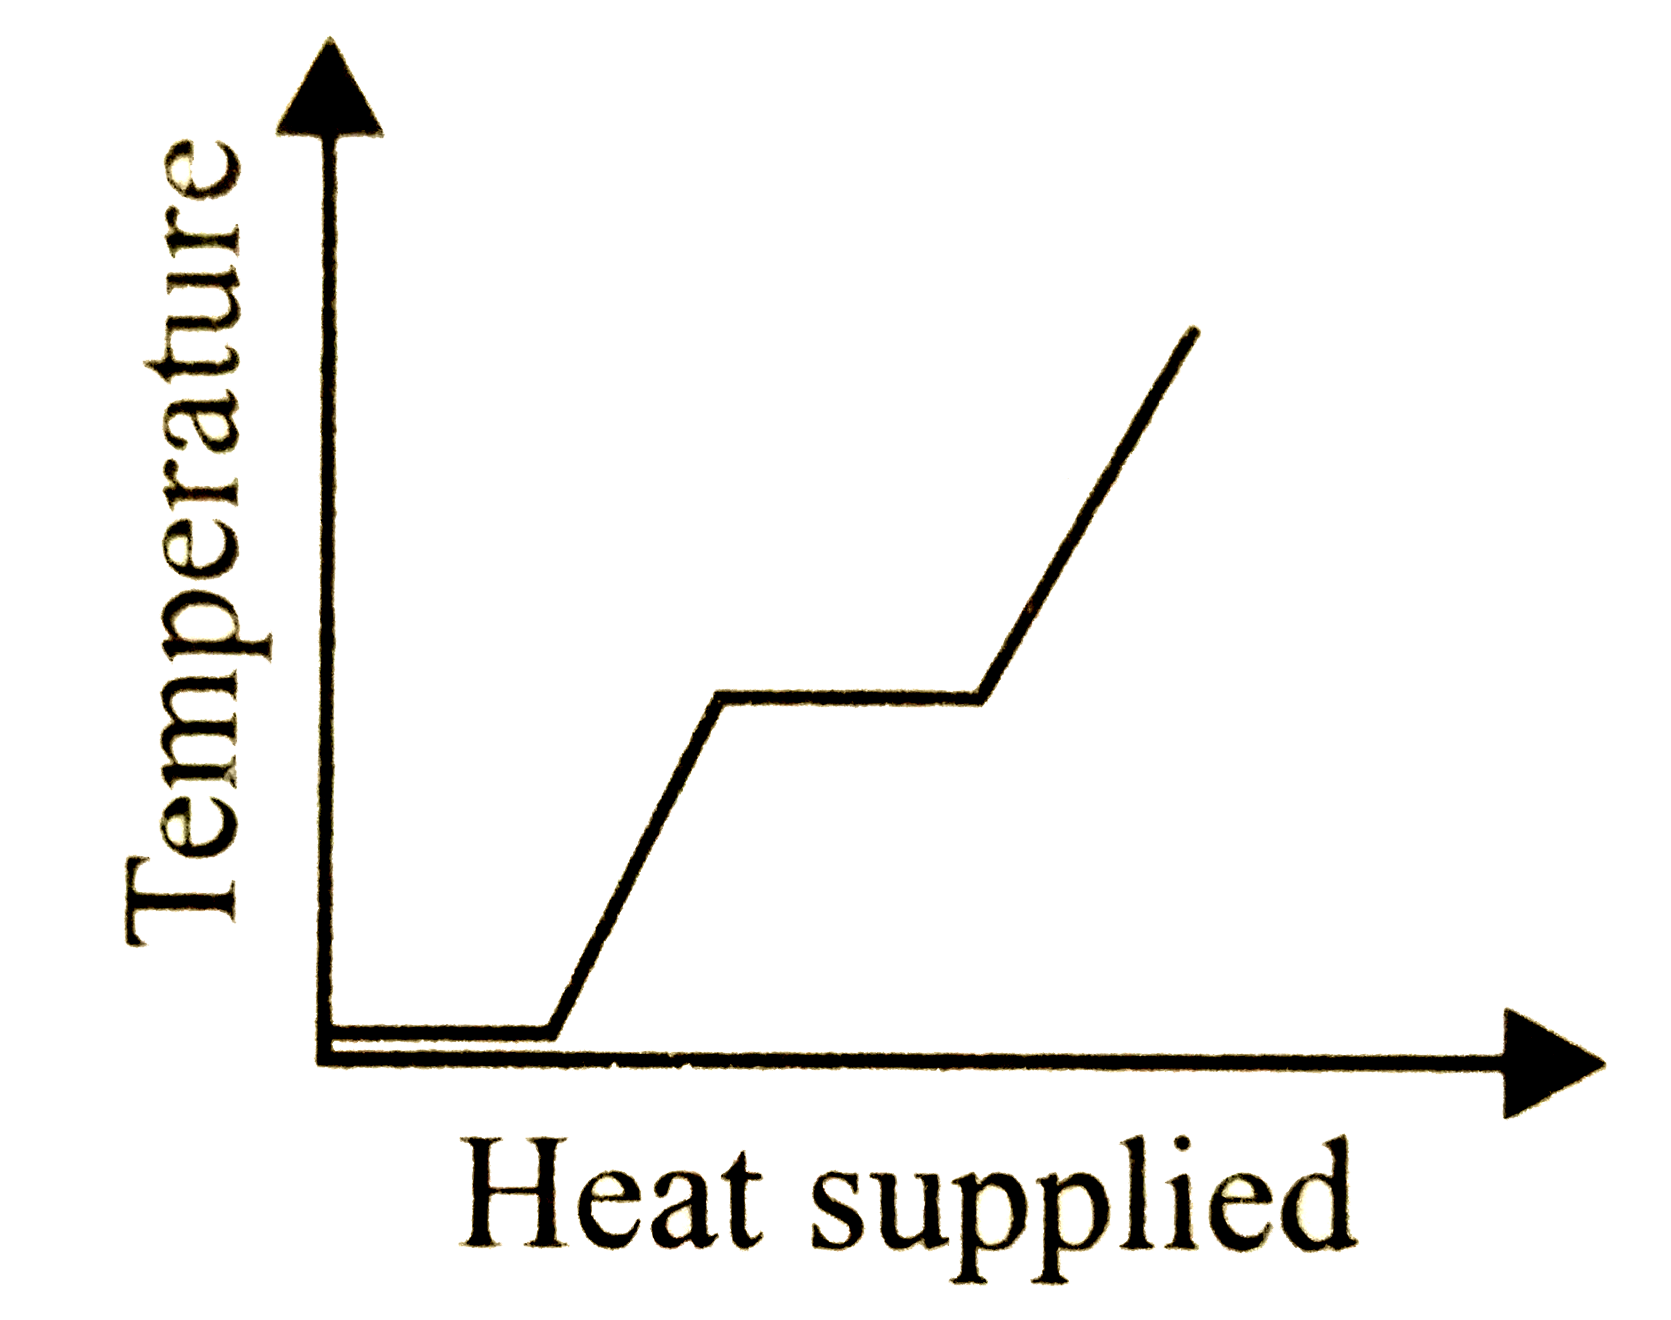
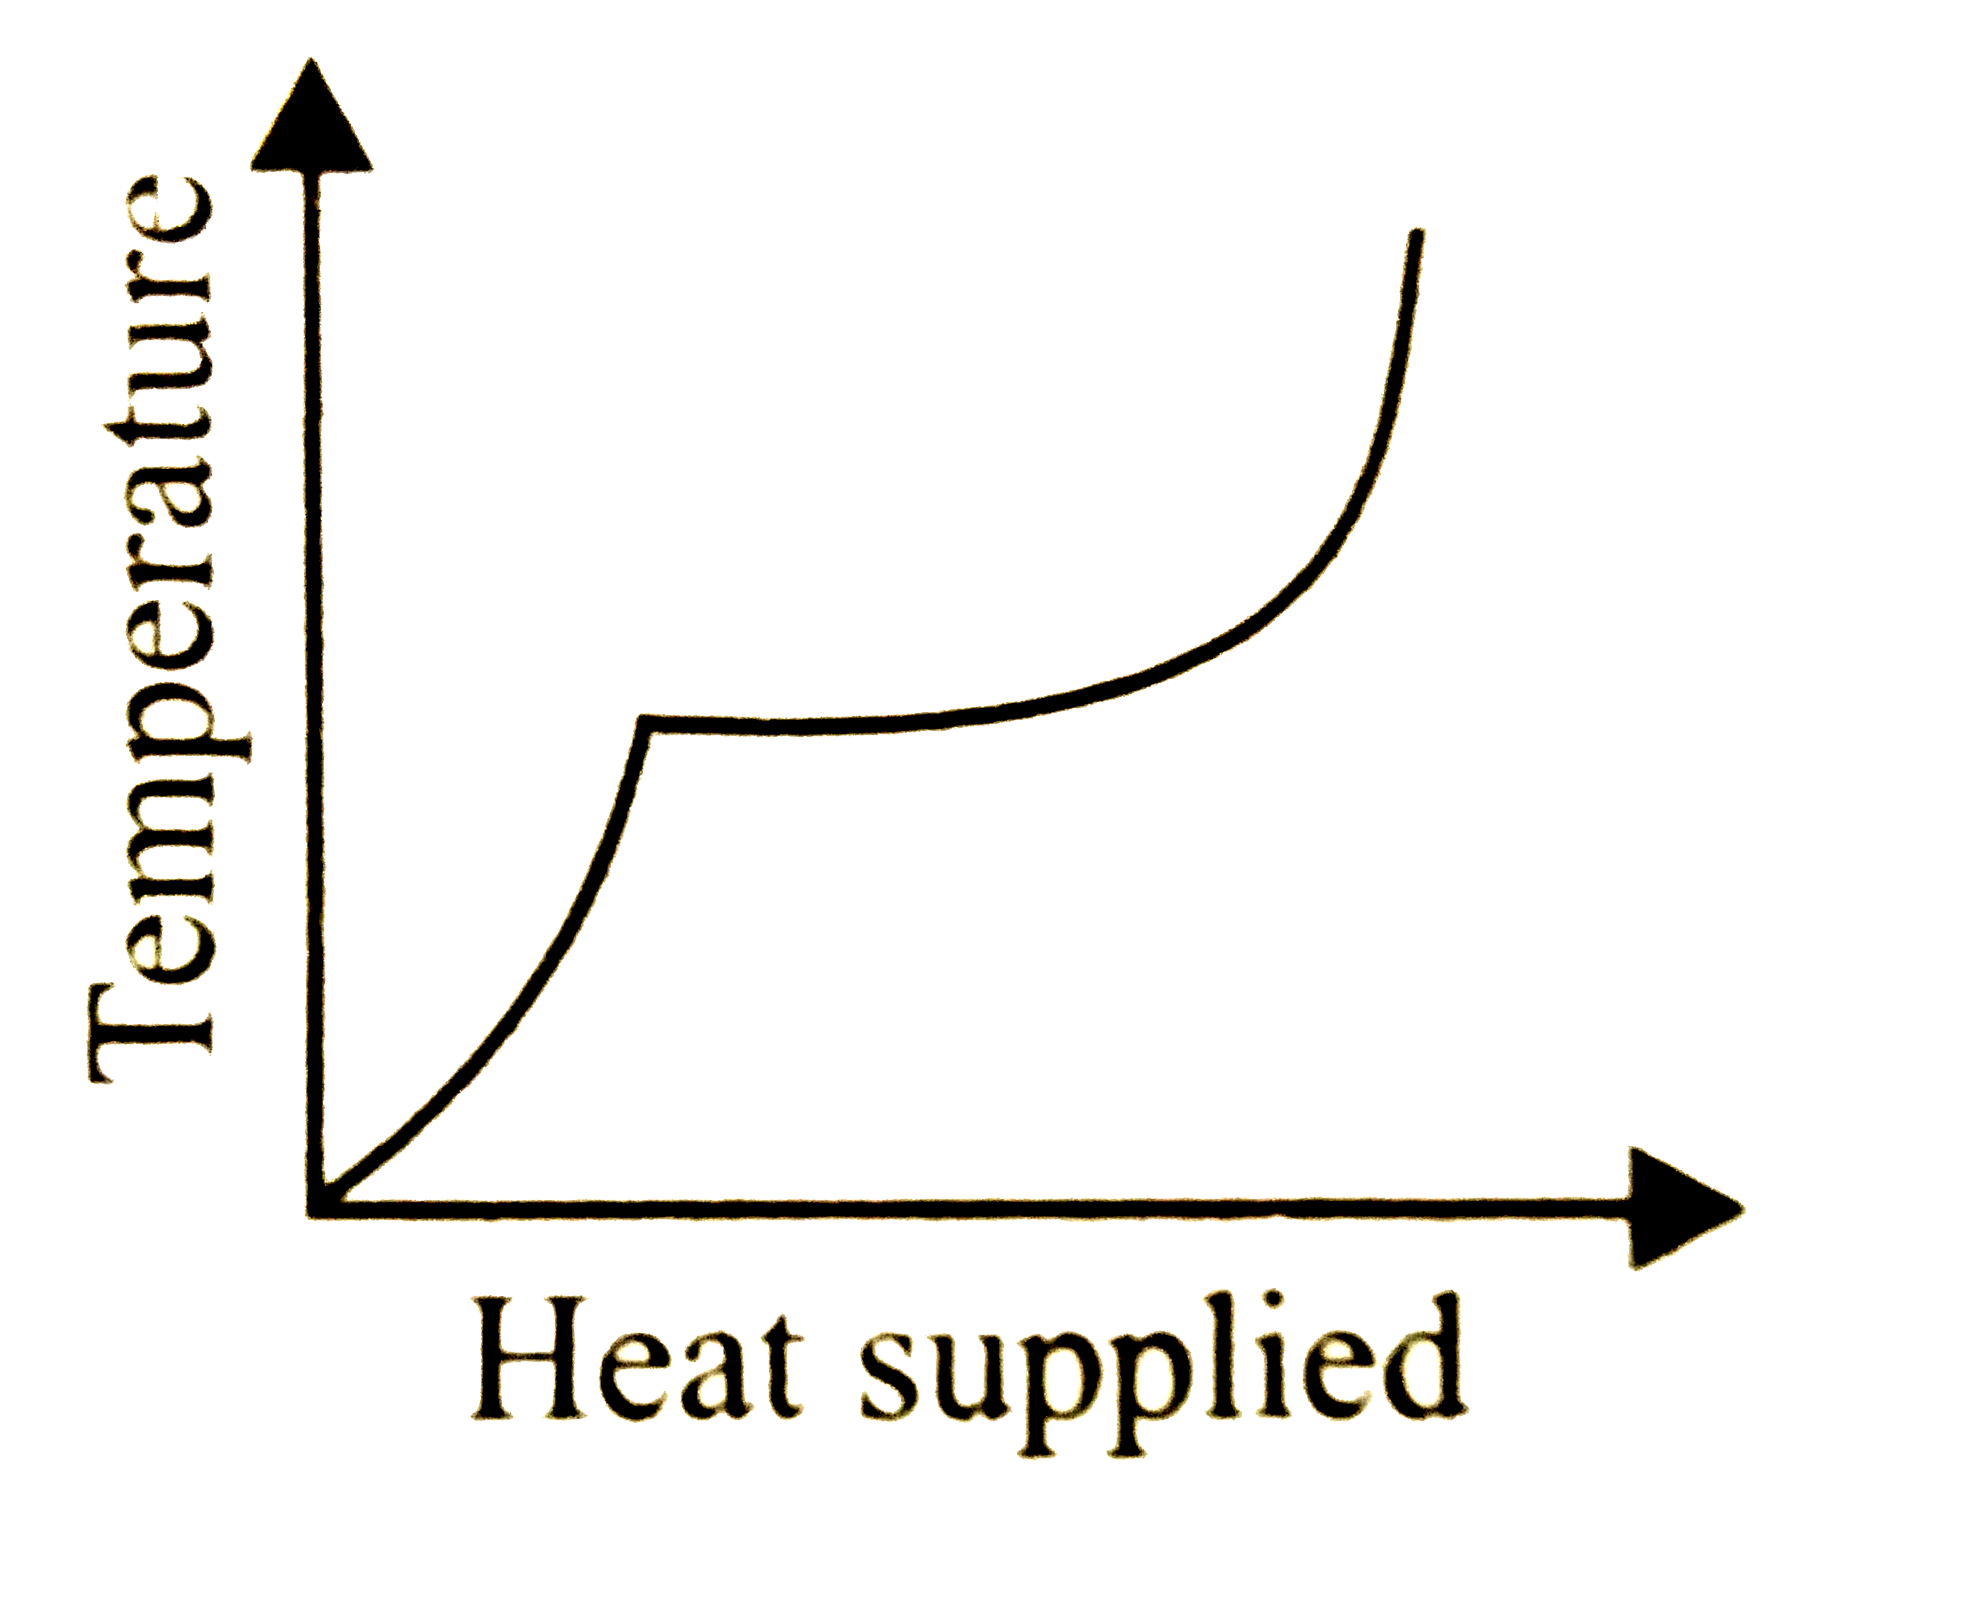
A block of ice at −10∘C is slowly heated and converted to steam at 100∘C. Which of the following curves represents the phenomenon qualitatively?
A B
B C
C D
D
A piece of ice at 0∘C is heated at a constant rate and its temperature recorded at regular intervals till steam is formed at 100∘C. Draw a temperature-time graph to represent the change in phase. Label the different parts of your graph.
View Solution1 kg of ice at 0∘C is heated at a constant rate and its temperature is recorded after every 30 s till steam is formed at 100∘C. Draw a temperature-time graph to represent the change of phases.
View Solution1 g of ice at 0∘C is mixed with 1 g of steam at 100∘C. After thermal equilibrium is achieved, the temperature of the mixture is
View SolutionA block of ice at −12∘C is slowly heated and converted into steam at 100∘C. Which of the following curves best represents the event ?
View Solution5g ice at 0∘C is mixed with 5g of steam at 100∘C. What is the final temperature?
View Solution100 g ice at 0∘C is mixed with 10 g steam at 100∘C . Find the final temperature.
View SolutionAluminium container of mass of 10 g contains 200 g of ice at−20∘C. Heat is added to the system at the rate of 100 calories per second. What is the temperature of the system after four minutes? Draw a rough sketch showing the variation of the temperature of the system as a function of time . Given:
Specific heat of ice = 0.5calg−1(.∘C)−1
Specific heat of aluminium = 0.2calg−1(.∘C)−1
Latent heat of fusion of ice = 80calg−1View Solution

