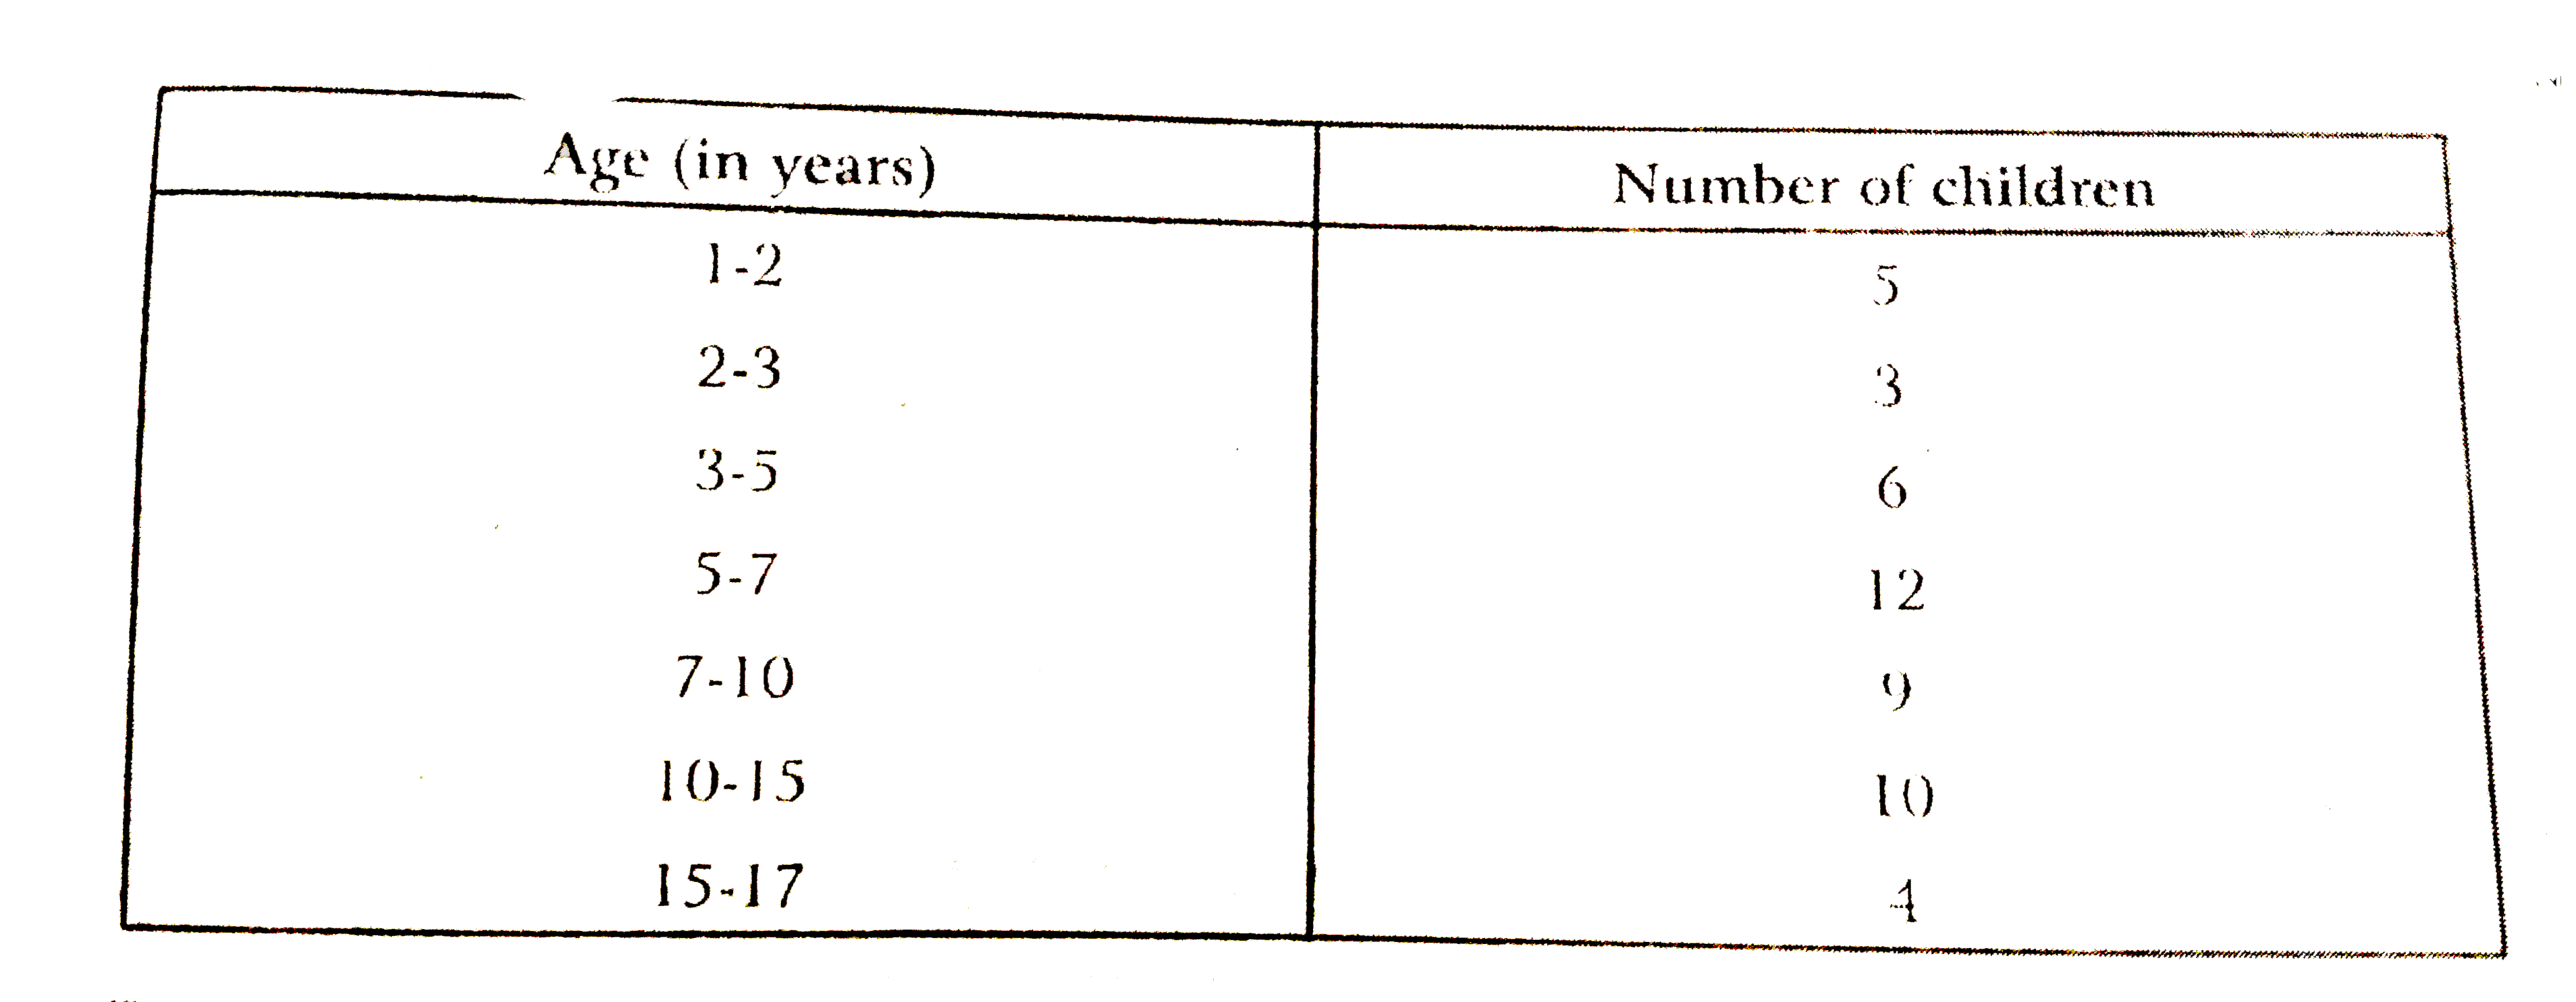
Draw a histogram to represent the following

The correct Answer is:
Step by step video, text & image solution for Draw a histogram to represent the following by Maths experts to help you in doubts & scoring excellent marks in Class 9 exams.
Updated on:21/07/2023Topper's Solved these Questions
- STATISTICSBOOK - ICSECHAPTER - STATISTICSEXERCISE - EXERCISE 18 (A)
21 Videos
- STATISTICSBOOK - ICSECHAPTER - STATISTICSEXERCISE - EXERCISE 18 (B)
6 Videos
- SOLUTION OF RIGHT TRIANGLESBOOK - ICSECHAPTER - SOLUTION OF RIGHT TRIANGLESEXERCISE - EXERCISE 24
35 Videos
- STATISTICS AND GRAPH WORK BOOK - ICSECHAPTER - STATISTICS AND GRAPH WORK EXERCISE - TOPIC - 2 (4 Marks Questions)
14 Videos
Similar Questions
In a class of 40 students, the marks obtained (out of 50) are as given below:

Draw a histogram to represent the given data.
View SolutionThe length of 40 leaves of a plant are measured correct to one millimetre, and the obtained data is represented in the following table: (i) Draw a histogram to represent the given data.(ii) Is there any other suitable graphical representation for the same data?(iii) Is it correct to conclude that the maximum number of leaves are 153 mm long?Why?
View SolutionThe following table presents the number of illiterate females in the age group (10-34) in a town: Age group: 10-14 15-19 20-24 25-29 30-34 No. of Females: 300 980 800 580 290 Draw a histogram to represent the above data:
View SolutionDraw a histogram for the following data :

View SolutionA random survey of the number of children of various are groups playing in park was found as follows :

Draw a histogram to represent the data above.
View SolutionDraw a histogram for the following data:

View SolutionDraw a histogram for the following data:

View SolutionDraw a histogram for the following data:

View SolutionDraw a histogram for the following data:

View SolutionDraw a histogram for the following frequency distribution and find the mode from the graph :

View Solution
