Construct a frequency distribution table from the following cumulative frequency distribution :
Calss IntervalCumulative Frequency10−19820−291930−392340−4930
The correct Answer is:C.IFreq10−19820−291130−39440−497
Step by step video, text & image solution for Construct a frequency distribution table from the following cumulative frequency distribution : {:("Calss Interval","Cumulative Frequency"),(10-19,8),(20-29,19),(30-39,23),(40-49,30):} by Maths experts to help you in doubts & scoring excellent marks in Class 9 exams.
Topper's Solved these Questions
- BOOK - ICSECHAPTER - STATISTICSEXERCISE - EXERCISE 18 (B)6videos
STATISTICS
- BOOK - ICSECHAPTER - STATISTICSEXERCISE - EXERCISE 18 (B)6videos
STATISTICS
- BOOK - ICSECHAPTER - SOLUTION OF RIGHT TRIANGLESEXERCISE - EXERCISE 2435videos
SOLUTION OF RIGHT TRIANGLES
- BOOK - ICSECHAPTER - STATISTICS AND GRAPH WORK EXERCISE - TOPIC - 2 (4 Marks Questions)14videos
STATISTICS AND GRAPH WORK
Similar Questions
Construct a frequency distribution table from the following cumulative frequency distribution :
Calss IntervalFrequency5−101810−153015−204620−257325−3090View SolutionFrom the frequency distribution table from the following data
 View Solution
Construct a frequency distributions table from the following cumulatvive frequency table.
Class interval Cumulative Frequency 0−91510−192320−293830−395640−496850−5990View SolutionContruct a cumulative frequency distributions table from the following frequency table:
 View Solution
Contruct a cumulative frequency distributions table from the following frequency table:
 View Solution
Construct a cumulative frequency distribution table from the frequency table given below :
Calss IntervalFrequency1−101211−201821−302331−401541−5010View SolutionConstruct a cumulative, frequency distribution table from the frequency table given below :
Calss IntervalFrequency0−898−161316−241224−32732−4015View SolutionConstruct a combined histogram and frequency polygon for the following frequency distribution :
Calss IntervalFrequency10−20320−30530−40640−50450−602View SolutionDraw a frequency polygon from the following frequency distribution
 View Solution
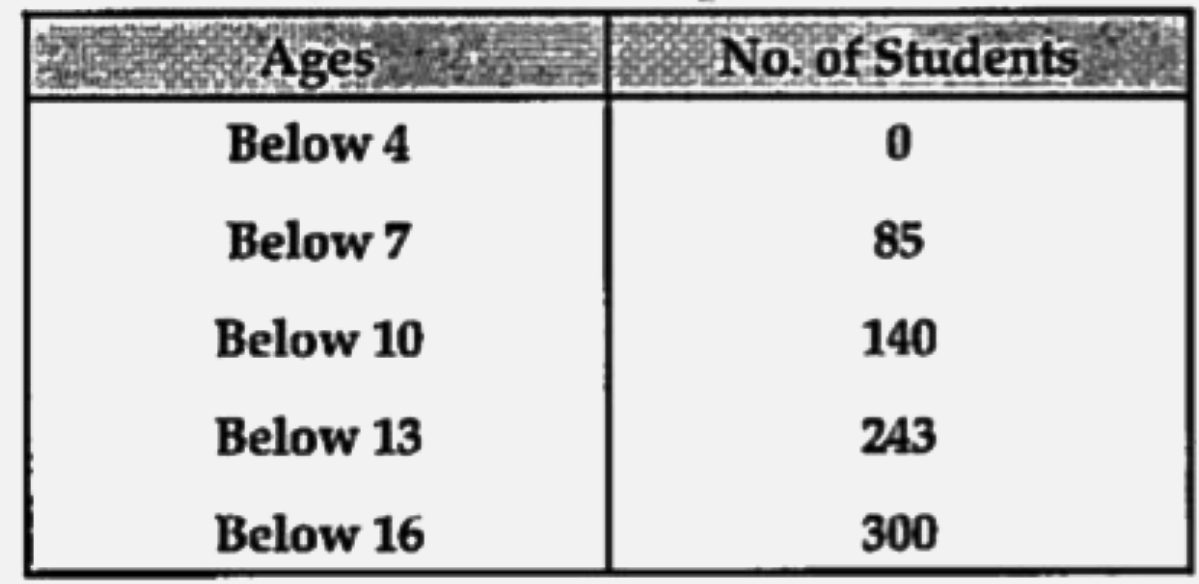
Construct the frequency distribution table from the following cumulative frequency table :

State the number of students in the age group 10 - 13.View Solution

