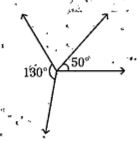
Niharika took two angles 130∘ and 50∘ and tried to check whether they form linear pair. She made the following picture.Can we say that these two augles do not for a linear pair ?If not, what is Niharika's mistake? Solution in Telugu
Step by step video & image solution for Niharika took two angles 130^@ and 50^@ and tried to check whether they form linear pair. She made the following picture.Can we say that these two augles do not for a linear pair ?If not, what is Niharika's mistake? by Maths experts to help you in doubts & scoring excellent marks in Class 7 exams.
Updated on:21/07/2023Topper's Solved these Questions
- LINES AND ANGLESBOOK - NCERT TELUGUCHAPTER - LINES AND ANGLESEXERCISE - EXAMPLE
2 Videos
- LINES AND ANGLESBOOK - NCERT TELUGUCHAPTER - LINES AND ANGLESEXERCISE - EXERCISE -1
24 Videos
- INTEGERS BOOK - NCERT TELUGUCHAPTER - INTEGERS EXERCISE - EXERCISE
411 Videos
- POWERS AND EXPONENTSBOOK - NCERT TELUGUCHAPTER - POWERS AND EXPONENTSEXERCISE - DO THIS
56 Videos
Similar Questions
In the figure given below, T and 'm' are a pair of parallel lines 'p' is a transversal. Find 'x'.

View SolutionName the figures drawn below.

View SolutionSome integers are marked on the number line which is the biggest and which is the smallest?
View SolutionWrite the following in exponential form. (values are rounded off)
Total surface area of the Earth is 510,000,000 square kilometers.
View SolutionHow many lines of symmetry does the above figure have ?
View SolutionWhich of the following are correct chain isomers of butane ? (i)
View SolutionDetermine the point of symmetry of a regular hexagon.
View SolutionDtermine the images of the following figure about the given line :
View SolutionMatch the following Column A to Column B

View SolutionMatch the following Column A to Column B

View SolutionMatch the following Column A to Column B

View SolutionThe inequation represented by the graph given below is :
View SolutionThe inequation that best describes the graph given below is _________
View SolutionThe inequation that best describes the following graph is _________
View SolutionWhich inequations represent the shaded region in the given figure
View SolutionWhat is the distance OA for the square shown in figure :- ltimg src="https://d10lpgp6xz60nq.cloudfront.net/physics_images/ALN_PHY_R05_E01_015_Q01.png" width="80%"gt
View Solution
