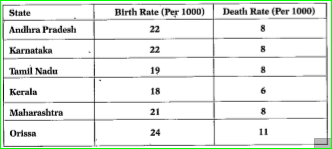
Draw a double bar graph for the following data. Birth and Death rates of different states in 1999.  Solution in Telugu
Step by step video & image solution for Draw a double bar graph for the following data. Birth and Death rates of different states in 1999. by Maths experts to help you in doubts & scoring excellent marks in Class 7 exams.
Updated on:21/07/2023Topper's Solved these Questions
- DATA HANDLINGBOOK - NCERT TELUGUCHAPTER - DATA HANDLINGEXERCISE - Example
23 Videos
- DATA HANDLINGBOOK - NCERT TELUGUCHAPTER - DATA HANDLINGEXERCISE - Try This
19 Videos
- CONSTRUCTION OF TRIANGLESBOOK - NCERT TELUGUCHAPTER - CONSTRUCTION OF TRIANGLESEXERCISE - EXERCISE -5
5 Videos
- EXPONENTSBOOK - NCERT TELUGUCHAPTER - EXPONENTSEXERCISE - EXERCISE-3
4 Videos
Similar Questions
Earnings (in rupees) of a vegetable vendor in a week are ₹200, ₹150, ₹180, ₹300, ₹160, ₹170 and ₹170. Find his average earning, per day.
View SolutionLook at your school information board. Do you find any data tables there? Find out who uses this data.
View SolutionConstruct △ ABC in which AB = 4.5 cm, AC = 4.5 cm and ∠B=50∘. Check whether you get two triangles.
View SolutionExpress the number appearing in the following statements in standard form. The distance between the Earth and the Moon is approximately 384,000,000m.
View SolutionMatch the following lists:

View SolutionHow many lines of symmetry does the above figure have ?
View SolutionWhich of the following are correct chain isomers of butane ? (i)
View SolutionDetermine the point of symmetry of a regular hexagon.
View SolutionDtermine the images of the following figure about the given line :
View SolutionDraw the bisector of ∠AOB=58∘
ltimg src="https://d10lpgp6xz60nq.cloudfront.net/physics_images/PS_MATH_VII_C05_S01_009_Q01.png" width="80%"gt
View SolutionMatch the following Column A to Column B

View SolutionMatch the following Column A to Column B

View SolutionMatch the following Column A to Column B

View SolutionThe inequation represented by the graph given below is :
View SolutionThe inequation that best describes the graph given below is _________
View Solution
