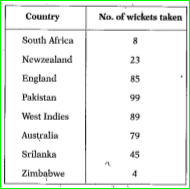
Kapildev is a Cricketer who created a world record by taking 432 wickets in Test Cricket. Here is a table giving the number of wickets taken by him against each Country. Represent the data in a pie diagram.  Solution in Telugu
Step by step video & image solution for Kapildev is a Cricketer who created a world record by taking 432 wickets in Test Cricket. Here is a table giving the number of wickets taken by him against each Country. Represent the data in a pie diagram. by Maths experts to help you in doubts & scoring excellent marks in Class 7 exams.
Updated on:21/07/2023Topper's Solved these Questions
- DATA HANDLINGBOOK - NCERT TELUGUCHAPTER - DATA HANDLINGEXERCISE - Example
23 Videos
- DATA HANDLINGBOOK - NCERT TELUGUCHAPTER - DATA HANDLINGEXERCISE - Try This
19 Videos
- CONSTRUCTION OF TRIANGLESBOOK - NCERT TELUGUCHAPTER - CONSTRUCTION OF TRIANGLESEXERCISE - EXERCISE -5
5 Videos
- EXPONENTSBOOK - NCERT TELUGUCHAPTER - EXPONENTSEXERCISE - EXERCISE-3
4 Videos
Similar Questions
Earnings (in rupees) of a vegetable vendor in a week are ₹200, ₹150, ₹180, ₹300, ₹160, ₹170 and ₹170. Find his average earning, per day.
View SolutionLook at your school information board. Do you find any data tables there? Find out who uses this data.
View SolutionConstruct △ ABC in which AB = 4.5 cm, AC = 4.5 cm and ∠B=50∘. Check whether you get two triangles.
View SolutionExpress the number appearing in the following statements in standard form. The distance between the Earth and the Moon is approximately 384,000,000m.
View SolutionHow many lines of symmetry does the above figure have ?
View SolutionWhich of the following are correct chain isomers of butane ? (i)
View SolutionDetermine the point of symmetry of a regular hexagon.
View SolutionDtermine the images of the following figure about the given line :
View SolutionMatch the following Column A to Column B

View SolutionMatch the following Column A to Column B

View SolutionMatch the following Column A to Column B

View SolutionFind the area of the figure given below.

View SolutionThe area of the shaded part in the figure given below is ______.

View SolutionThe inequation represented by the graph given below is :
View SolutionThe inequation that best describes the graph given below is _________
View Solution
