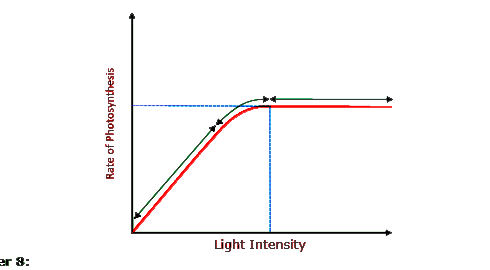
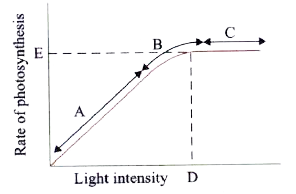
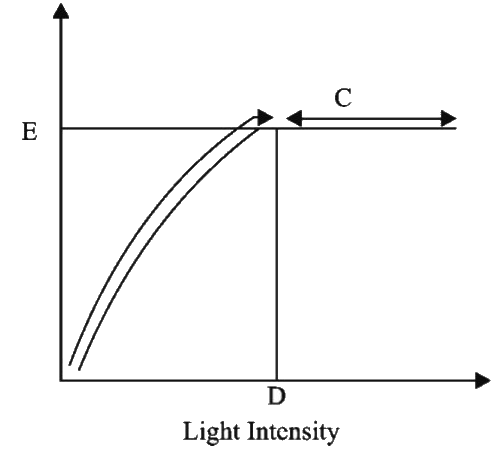
The given figure shows the effect of light on the rate of photosynthesís. Based on the graph, answer the fol'lowing questions:
'(##VPU_HSS_BIO_XI_C13_E01_008_Q01##)'
a. At which points A, B or C in the curve.is light a limiting factor?
b. What could be the limiting factor/s in region A?
c. What do C and D represent on the curve?
:a. Points $\mathrm(B)-\mathrm(C)$ of the curve, the rate did not increase with an increase in, cońcentration because under these conditions, light becomes limiting factor. b. The rate, of photosynthesis shows proportional increase upto a certain $\mathrm(CO)_(2)$ concentration in region :A. of the curve, beyond which the rate again becomes constant. c. If the light intensity is doubled $\mathrm(C) \mathrm(O)_(2)$ concentration again becomes limiting factor.
Similar Questions
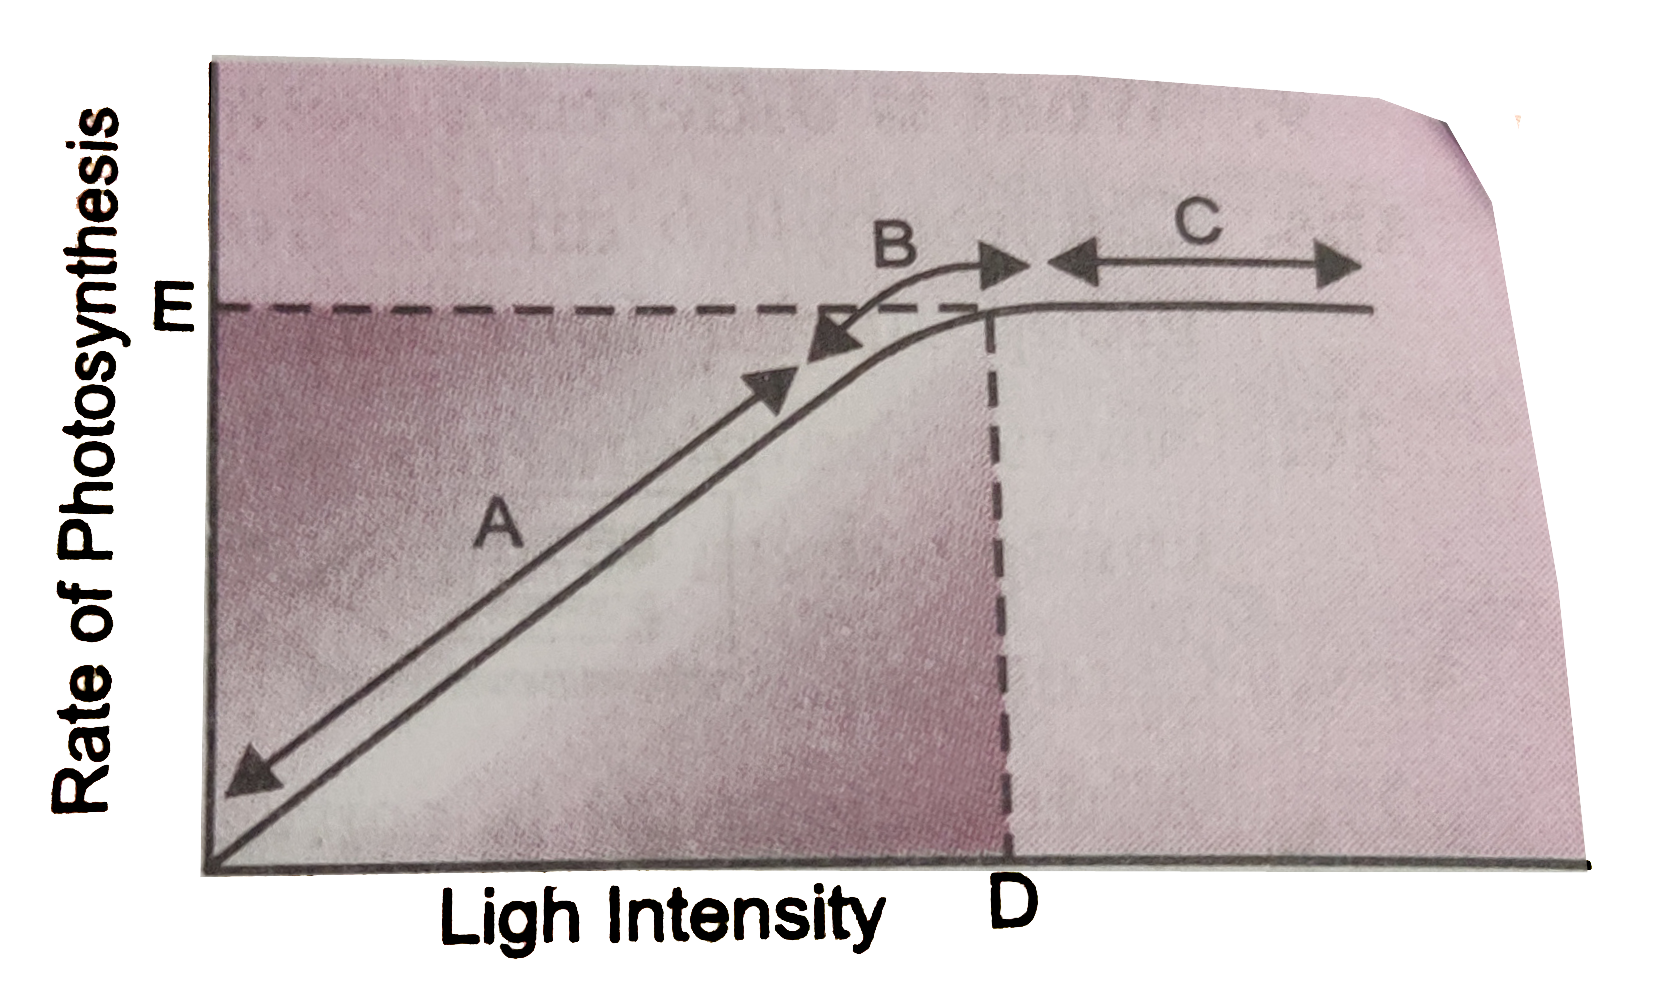
Figure 13.10 shows the effect of light on the rate of photosynthesis. Based on the graph, answer the following questions:
(a) At which point/s (A, B or C) in the curve is light a limiting factor?
(b) What could be the limiting factor/s in region A?
(c) What do C and D represent on the curve?
View SolutionFigure shows, the effect of light on the rate of photosynthesis Based on the graph, answer the following questions.
a) At which points (A,B or C) in the curve is light a limiting factor?
b) What could be the limiting factor/s in region A?
c) What do C and D represent on the curve?
View Solution
Knowledge Check
Recognise the figure and find out the correct matching
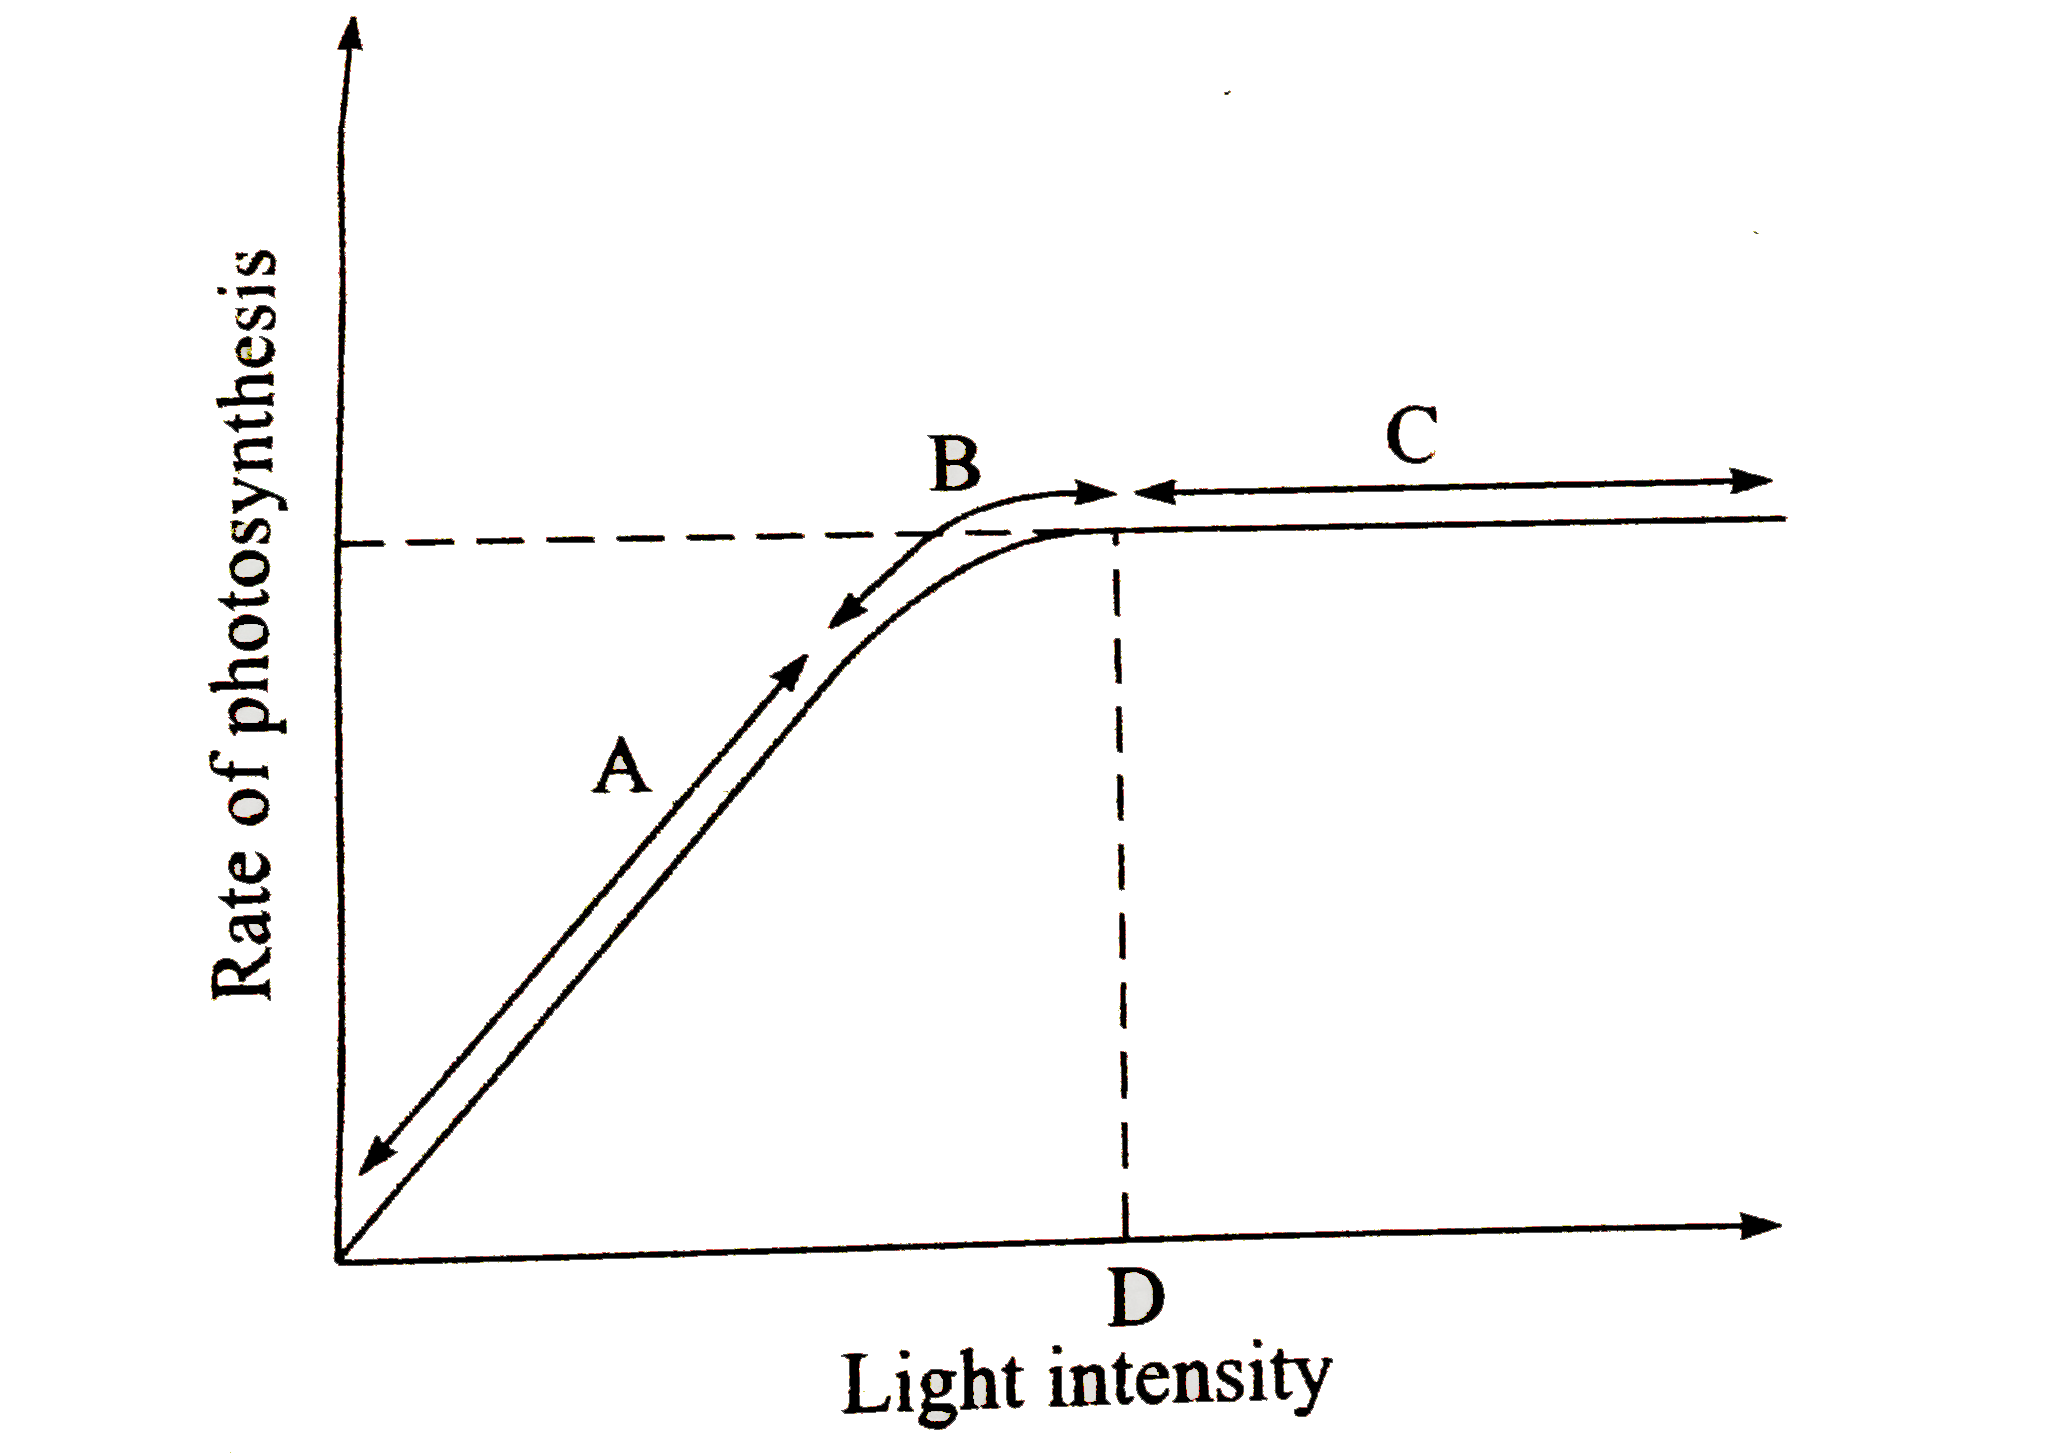
a. At which point in the curve light is a limiting factor?
b. What do 'C' represent on the curve?
c. What do 'D' represent on the curve?
d. What do 'E' represent on the curve?Aa- A, b-light saturation point, c-maximum rate of photosynthesis, d- factors other than light become limitingBa-B, b-maximum rate of photosynthesis, c- light saturation point, d-factors other than light become limitingCa- A, b-factors other than light become limiting, c-light saturation point, d-maximum rate of photosynthesisDa-A, b-factors other than light become limiting, c-maximum rate of photosynthesis, d-light saturation point
Figure shows the effect of light on the rate of photosynthesis.
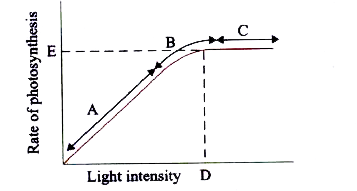
Based on the graph, answer the following questions.
At which point/s (A, B, or C) in the curve is light a limiting factor?
View SolutionFigure shows the effect of light on the rate of photosynthesis.
Based on the graph, answer the following questions.
What do C and D represent on the curve?
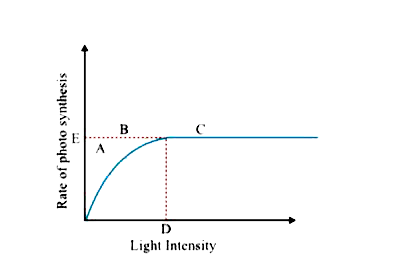
View SolutionThe figure shows the effect of light on the rate of photosynthesis. Based on the graph, answer the following questions :
What do region C and D represent on the curve ?
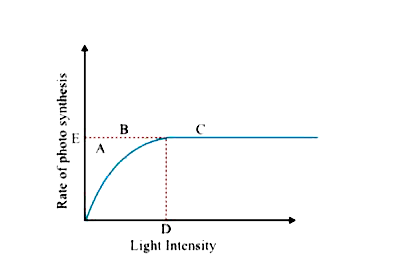
View SolutionThe figure shows the effect of light on the rate of photosynthesis. Based on the graph, answer the following questions :
What could be the limiting factor(s) in region A ?
View SolutionFigure shows the effect of light on the rate of photosynthesis.
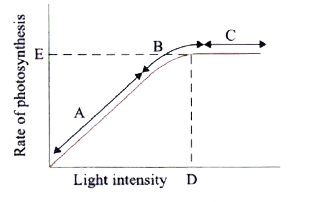
Based on the graph, answer the following questions.
What would be the limiting factors in region A?
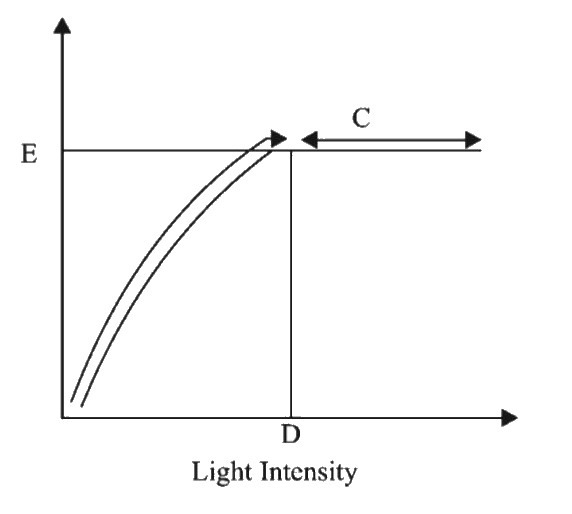
View SolutionFigure given below shows the effect of light on the role of photosynthesis. Based on graph
What could be the limiting factor/factors in region A?
View SolutionFigure given below shows the effect of light on the role of photosynthesis. Based on graph
At which point/points (A,B or C) in the curve light is a limiting fac- tor?
View Solution
