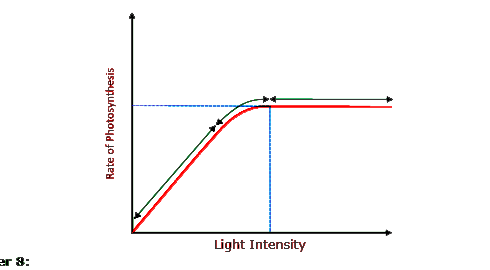
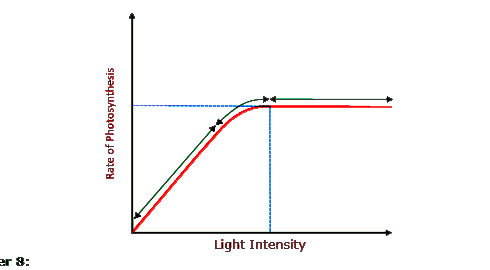
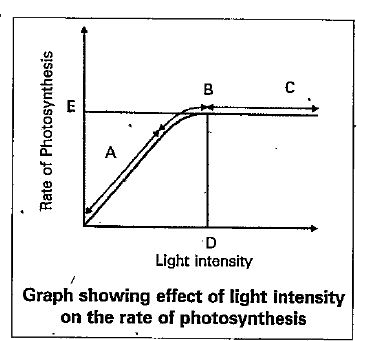
Figure 13.10 shows the effect of light on the rate of photosynthesis. Based on the graph, answer the following questions:
(a) At which point/s (A, B or C) in the curve is light a limiting factor?
(b) What could be the limiting factor/s in region A?
(c) What do C and D represent on the curve?
 Solution in Tamil
Step by step video & image solution for Figure 13.10 shows the effect of light on the rate of photosynthesis. Based on the graph, answer the following questions: (a) At which point/s (A, B or C) in the curve is light a limiting factor? (b) What could be the limiting factor/s in region A? (c) What do C and D represent on the curve? by Biology experts to help you in doubts & scoring excellent marks in Class 11 exams.
Updated on:21/07/2023Topper's Solved these Questions
Similar Questions
Assertion (A): Increase in Proton gradient inside lumen reponsible for ATP synthesis
Reason (R ): Oxygen evolving complex of PS I located on thylakoid membrane facing Stroma, releases H+ ions
View SolutionSelect the wrong statement from the following:
View SolutionFigure shows, the effect of light on the rate of photosynthesis Based on the graph, answer the following questions. a) At which points (A,B or C) in the curve is light a limiting factor? b) What could be the limiting factor/s in region A? c) What do C and D represent on the curve?
View SolutionFigure shows the effect of light on the rate of photosynthesis. Based on the graph, answer the following questions . (a) At which point /s (A,B or C) in the curve is light a limiting factor ? (b) What could be the limiting factor/ s in region A ? (b) What could be the limiting factor /s in region A ? (c) What do C and D represent the following .
View SolutionThe figure shows the effect of light on the rate of photosynthesis. Based on the graph, answer the following questions : What could be the limiting factor(s) in region A ?
View SolutionFigure 13.10 shows the effect of light on the rate of photosynthesis. Based on the graph, answer the following questions: (a) At which point/s (A, B or C) in the curve is light a limiting factor? (b) What could be the limiting factor/s in region A? (c) What do C and D represent on the curve?
View SolutionFigure 13.10 shows the effect of light on the rate of photosynthesis. Based on the graph, answer the following questions:
(a) At which point/s (A, B or C) in the curve is light a limiting factor?
(b) What could be the limiting factor/s in region A?
(c) What do C and D represent on the curve?

View SolutionFigure 13.10 shows the effect of light on the rate of photosynthesis. Based on the graph, answer the following questions: (a) At which point/s (A, B or C) in the curve is light a limiting factor? (b) What could be the limiting factor/s in region A? (c) What do C and D represent on the curve?
View SolutionFigure 13.10 shows the effect of light on the rate of photosynthesis. Based on the graph, answer the following questions: At which point/s (A, B or C) in the curve is light a limiting factor?
View SolutionFigure shows the effect of light on the rate of photosynthesis, Based on the graph, answer the following question : (a) At which point/s (A,B or C) in the curve is light a limiting factor ? (b) What could be the limiting factor/s is region A ? (c ) What do C and D represent on the curve ?
View SolutionFigure shows the effect of light on the rate of photosynthesis. Based on the graph, answer the following questions: At which points (A, B or C) in the curve is light a limiting factor?
View SolutionFigure shows the effect of light on the rate of photosynthesis. Based on the graph, answer the following questions: What could be the limiting factors in region A?
View SolutionFigure shows the effect of light on the rate of photosynthesis. Based on the graph, answer the following questions.
a. At which points (A, B or C) in the curve is light a limiting factor ?
b. What could be the limiting factor/s in region A ?
c. What do C and D represent on the curve ?

View SolutionThe given figure shows the effect of light on the rate of photosynthesís. Based on the graph, answer the fol'lowing questions: '(##VPU_HSS_BIO_XI_C13_E01_008_Q01##)' a. At which points A, B or C in the curve.is light a limiting factor? b. What could be the limiting factor/s in region A? c. What do C and D represent on the curve?
View SolutionFigure shows the effect of light on the rate of phtosynthesis. Based on the graph, answer the following question: At which points (A,B,C) in the curve is light a limiting factor?
View Solution
