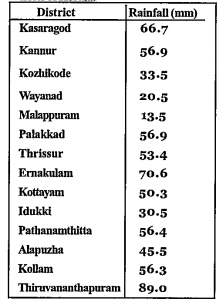
The table below gives the rainfall during one week of September 2015 in various districts of Kerala. Calculate the mean and median rain fall in Kerala during this week. Why is the mean less than median?
 .Solution in Malayalam
Step by step video & image solution for The table below gives the rainfall during one week of September 2015 in various districts of Kerala. Calculate the mean and median rain fall in Kerala during this week. Why is the mean less than median? . by Maths experts to help you in doubts & scoring excellent marks in Class 10 exams.
Updated on:21/07/2023Topper's Solved these Questions
Similar Questions
What is the surface area of a square pyramid with base edges 10 centimetres and lateral edges 13 centimetres?
View SolutionIn each of the two pictures below, a triangle is formed by a tangent to- a circle, the radius though the point of contact and a line through the centre:
'(##VPU_TTT_MAT_X_P02_C07_E01_001_Q01##)'
'(##VPU_TTT_MAT_X_P02_C07_E01_001_Q02##)'
Draw thesein, your note book.
View SolutionHow many lines of symmetry does the above figure have ?
View SolutionWhich of the following are correct chain isomers of butane ? (i)
View SolutionDetermine the point of symmetry of a regular hexagon.
View SolutionDtermine the images of the following figure about the given line :
View SolutionMatch the following Column A to Column B

View SolutionMatch the following Column A to Column B

View SolutionMatch the following Column A to Column B

View SolutionFind the area of figure given below.

View SolutionFind the perimeter of the figure given below.

View SolutionFind the area of the figure given below.

View SolutionCalculate the volume of the given solid.
ltimg src="https://d10lpgp6xz60nq.cloudfront.net/physics_images/PS_MATH_VII_C06_E03_002_Q01.png" width="80%"gt
View SolutionThe area of the shaded part in the figure given below is ______.

View SolutionThe inequation represented by the graph given below is :
View SolutionThe inequation that best describes the graph given below is _________
View Solution
