The table below shows the employees in an office, sorted according to thelr age:
'(##VPU_TTT_MAT_X_P02_C11_E03_001_Q01##)'Solution in Malayalam
Step by step video solution for The table below shows the employees in an office, sorted according to thelr age:'(##VPU_TTT_MAT_X_P02_C11_E03_001_Q01##)' by Maths experts to help you in doubts & scoring excellent marks in Class 10 exams.
Updated on:21/07/2023Topper's Solved these Questions
Similar Questions
What is the surface area of a square pyramid with base edges 10 centimetres and lateral edges 13 centimetres?
View SolutionIn each of the two pictures below, a triangle is formed by a tangent to- a circle, the radius though the point of contact and a line through the centre:
'(##VPU_TTT_MAT_X_P02_C07_E01_001_Q01##)'
'(##VPU_TTT_MAT_X_P02_C07_E01_001_Q02##)'
Draw thesein, your note book.
View SolutionAges of the First 12 United States Presidents at the Beginning of Their Terms in Office
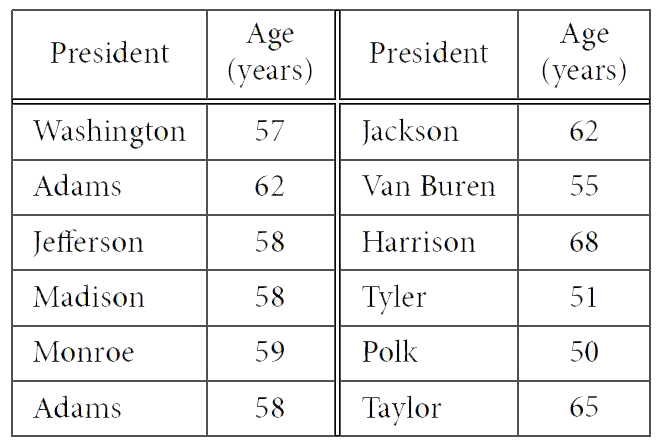
The table above lists the ages of the first 12 United States presidents when they began their terms in office. According to the table, what was the mean age, in years, of these presidents at the beginning of their terms? (Round your answer to the nearest tenth.)
View SolutionThe average age of the all the 100 employees in an office is 29 years where 2/5 employees are ladies and the ratio of average age of men to women is 5:7. the average age of female employees is :
View SolutionIn my office the average age of all the female employees is 21 years and that of male employees is 32 years, where the average age of all the (male and female) employees is 28 years. The total no. of employees in my office could be :
View Solutionएक कार्यालय के 60 कार्मिकों का विशेष दिवस का जेब खर्च निचे दिया हुआ बंटन दर्शा रहा है | कार्मिकों का माध्यका जेब खर्च ज्ञात कीजिए |

View SolutionThe following table shows the household expenditure of employees in a city:
View Solutiona public Opinion polling agency surveyed 200 government employees . The following table shows the ages of the employees interviewed:
Calculate the mean age of the employees interview.

View Solutiona public Opinion polling agency surveyed 200 government employees . The following table shows the ages of the employees interviewed:
Compute the mean deviation of the ages about the mean age.

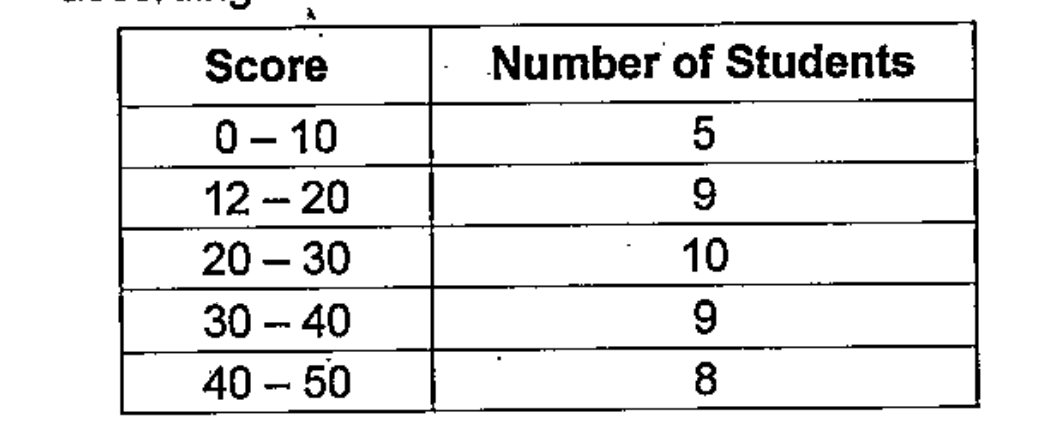
View SolutionThe table below shows the students of a class sorted according to their scores in a test
If the students are arranged in the increasing order of their scores, the score of the student at what position is taken as the median?
 .
.
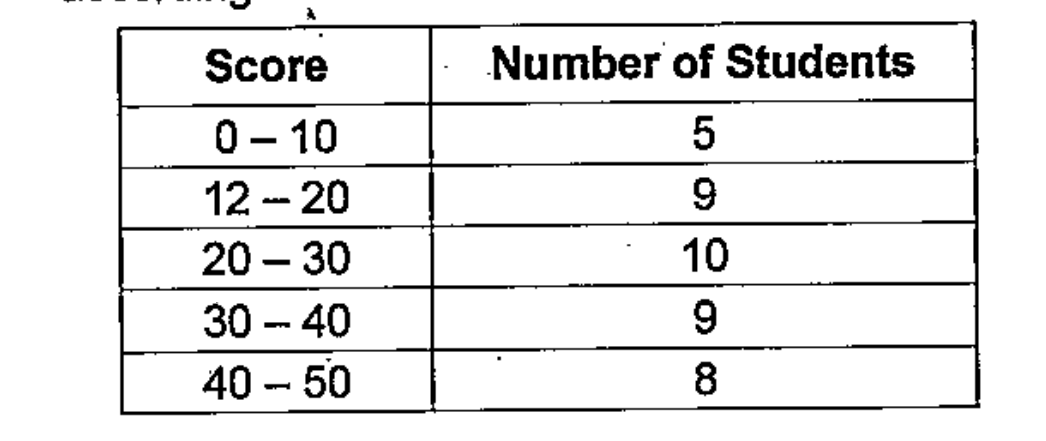
View SolutionThe table below shows the students of a class sorted according to their scores in a test
What may be assumed as the score of the 15th student in the arrangement?
 .
.
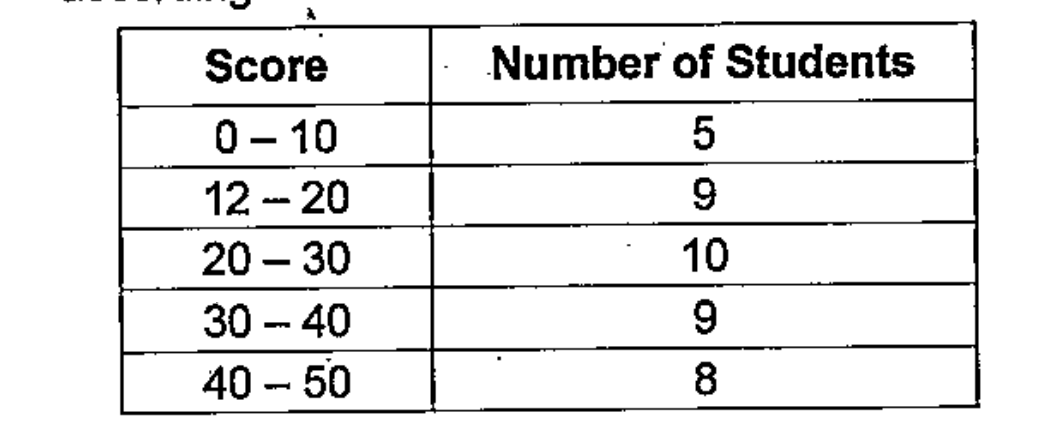
View SolutionThe table below shows the students of a class sorted according to their scores in a test
Find the median score.
 .
.
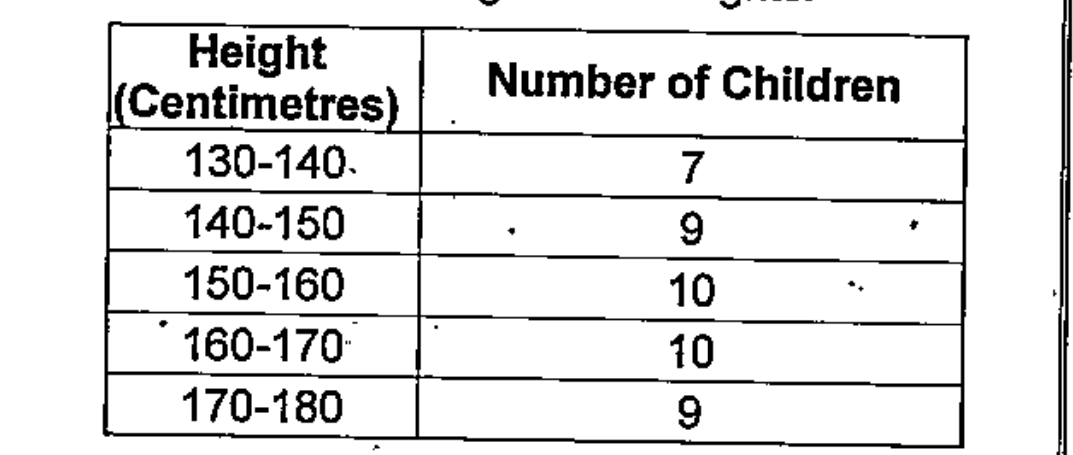
View SolutionThe table below shows the number of children is a class, sorted according to their heights.
If the students are directed to stand in a line according to the order of their heights starting from the smallest, then
Find the median height.
 .
.
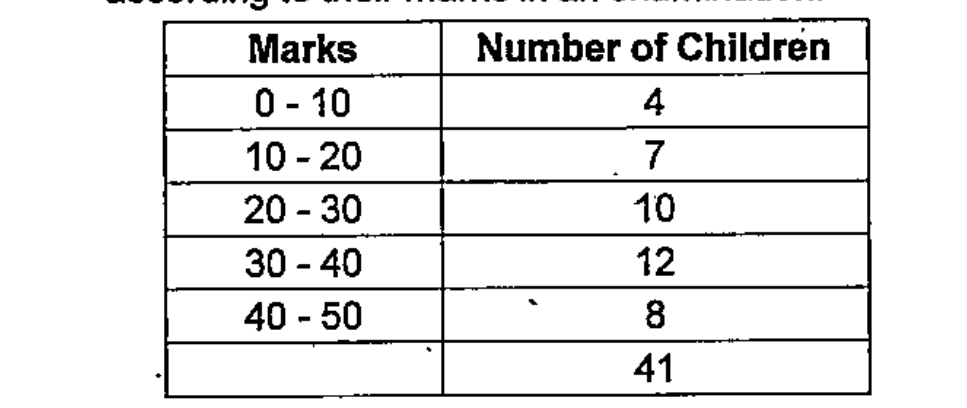
View SolutionThe table below shows, children of a class sorted according to their marks in an examination.
Compute the median mark.
 .
.
View SolutionThe average age of the all the 100 employees in an office is 29 years where 2/5 employees are ladies and the ratio of average age of men to women is 5:7. the average age of female employees is :
View SolutionIn my office the average age of all the female employees is 21 years and that of male employees is 32 years, where the average age of all the (male and female) employees is 28 years. The total no. of employee in my office could be:
View Solution
