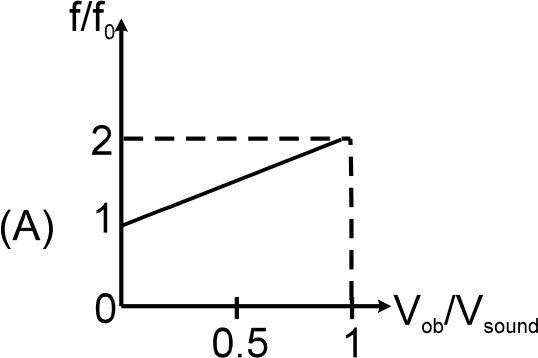
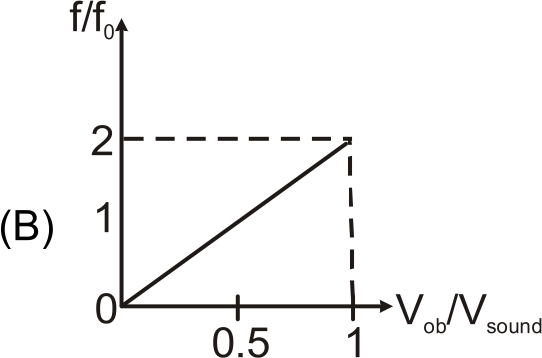
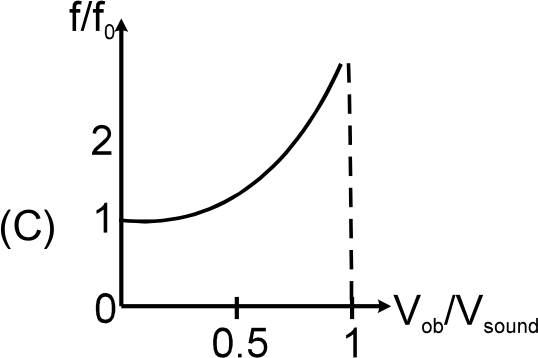
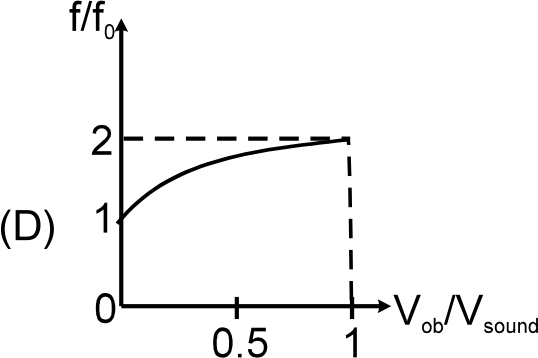
A curve is plotted to represenet the dependence of the ratio of the received frequency f to the frequency f0 emitted by the source on the ratio of the speed of obsever Vob to the speed of sound Vsound in a situation in which an observer is moving towards a stationary sound source. The curve is best represnted by :
f=f0(1+VobVsound)
⇒ff0=1+VobVsound(straight line) , when VobVsound=0,ff0=1
and as VobVsound→1⇒ff0→2
Topper's Solved these Questions
Similar Questions
When source of sound moves towards a stationary observer, the wavelength of sound received by him
View Solutionif the speed of a sound source is equal to the speed fo sound and the source is moving away from the observer, then the ratio of apparent frequency to the original frequency is
View Solution
Knowledge Check
- Question 1 - Select One
An observer moves towards a stationary source of sound. The percentage change in the apparent frequency is
AzeroB0.05C0.1D0.2 - Question 2 - Select One
To a stationary man the frequency of a sound source moving towards the man appears to be
Alower than the original frequencyBsame as the original frequencyChigher than the original frequencyDlower as well as higher than the original frequency depending upon the speed of the source. - Question 3 - Select One
A sound source is moving towards a stationary observer with 1/10 of the speed of sound. The ratio of apparent to real frequency is
A109B(109)2C(1110)2D1110
A listener and a source of sound are moving with the same speed in the same direction. The ratio of the frequency of the source and the frequency which is heard by the listerner is
View SolutionA source of sound is travelling towards a stationary observer. The frequency of sound heard by the observer is 25% more that the actual frequency. If the speed of sound is v, that of the source is
View SolutionA car moves towards a hill with speed vc.It blows a horn of frequency f which is heard by an observer following the car with speed v0.The speed of sound in air is v.
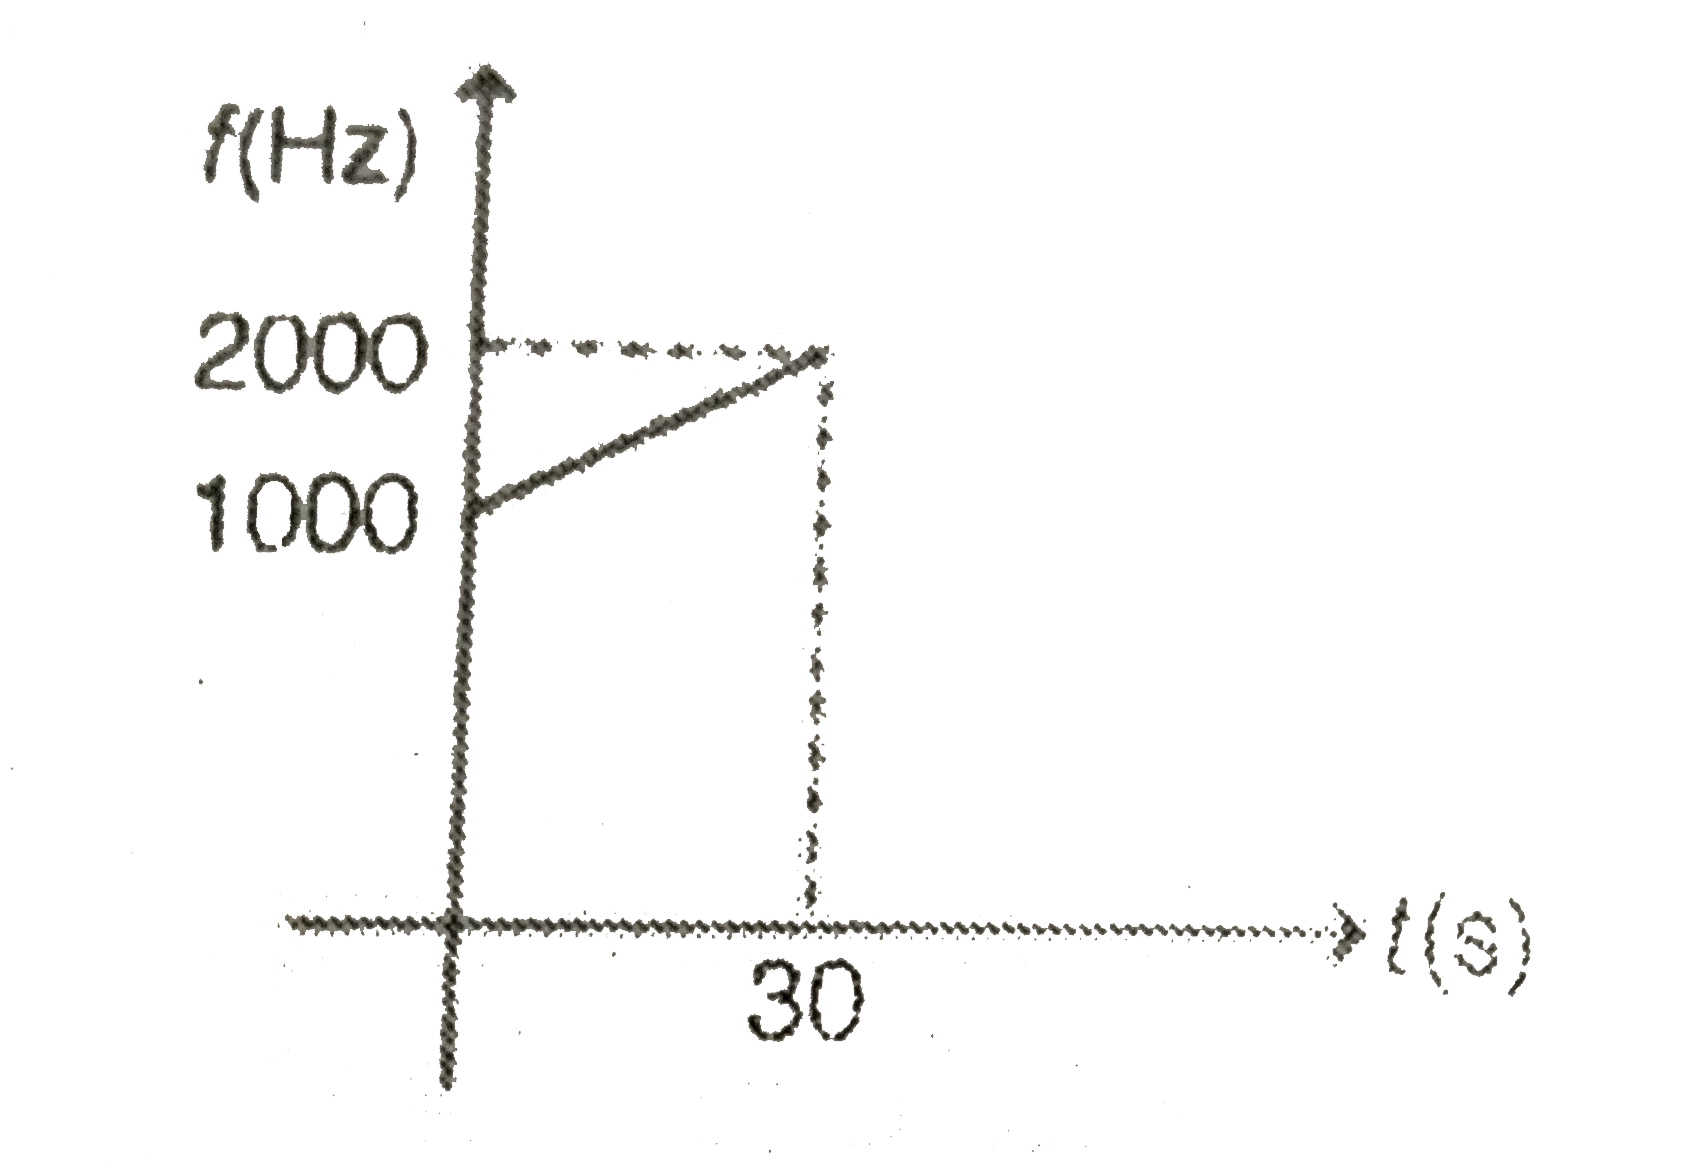
View SolutionA detector is released from rest over a source of sound of frequency f0=103Hz. The frequency observed by the detector at time t is plotted in the graph. The speed of sound in air is (g=10m/s2)
 View Solution
A train is moving towards a stationary observer. Which of the following curve best represents the frequency recived by observer f as a function of time?
View Solution
