A train is moving towards a stationary observer. Which of the following curve best represents the frequency recived by observer f as a function of time?
(#3DCP_V03_C19_E01_035_Q01.png" width="30%">
(#3DCP_V03_C19_E01_035_Q02.png" width="30%">
(#3DCP_V03_C19_E01_035_Q03.png" width="30%">
(#3DCP_V03_C19_E01_035_Q04.png" width="30%">
The correct Answer is:B
To solve the problem of how the frequency received by a stationary observer changes as a train moves towards and then away from them, we can break it down into clear steps.
1. Identify the Scenario:
- We have a train moving towards a stationary observer. Initially, the observer hears a higher frequency as the train approaches.
2. Understand the Doppler Effect:
- The Doppler Effect explains how the frequency of a wave changes for an observer moving relative to the source of the wave. When the source moves towards the observer, the frequency increases; when it moves away, the frequency decreases.
3. Define Frequencies:
- Let the original frequency of the train be f.
- When the train approaches the observer, the apparent frequency f1 can be given by:
f1=f(vsvs−vt)
where vs is the speed of sound, and vt is the speed of the train.
- When the train moves away from the observer after passing, the apparent frequency f2 is:
f2=f(vsvs+vt)
4. Analyze the Frequencies:
- Since vt is positive when the train is approaching, f1>f.
- After the train passes, f2<f.
5. Plot the Frequencies Over Time:
- At time t0, the frequency is f.
- As the train approaches, the frequency increases to f1.
- After the train passes the observer, the frequency decreases to f2.
6. Draw the Graph:
- On the graph, the x-axis represents time, and the y-axis represents frequency.
- The curve starts at f, rises to f1 as the train approaches, and then falls back to f2 as the train moves away.
Conclusion:
The graph representing the frequency received by the observer as a function of time will show an increase in frequency as the train approaches and a decrease as it moves away.
- We have a train moving towards a stationary observer. Initially, the observer hears a higher frequency as the train approaches.
- The Doppler Effect explains how the frequency of a wave changes for an observer moving relative to the source of the wave. When the source moves towards the observer, the frequency increases; when it moves away, the frequency decreases.
- Let the original frequency of the train be f.
- When the train approaches the observer, the apparent frequency f1 can be given by:
f1=f(vsvs−vt)
where vs is the speed of sound, and vt is the speed of the train.
f2=f(vsvs+vt)
- Since vt is positive when the train is approaching, f1>f.
- After the train passes, f2<f.
- At time t0, the frequency is f.
- As the train approaches, the frequency increases to f1.
- After the train passes the observer, the frequency decreases to f2.
- On the graph, the x-axis represents time, and the y-axis represents frequency.
- The curve starts at f, rises to f1 as the train approaches, and then falls back to f2 as the train moves away.
The graph representing the frequency received by the observer as a function of time will show an increase in frequency as the train approaches and a decrease as it moves away.
Topper's Solved these Questions
- BOOK - DC PANDEY ENGLISHCHAPTER - SOUND WAVESEXERCISE - Level 1 Subjective45videos
SOUND WAVES
- BOOK - DC PANDEY ENGLISHCHAPTER - SOUND WAVESEXERCISE - Subjective Questions1videos
SOUND WAVES
- BOOK - DC PANDEY ENGLISHCHAPTER - SOUND WAVESEXERCISE - Level 1 Assertion And Reason10videos
SOUND WAVES
- BOOK - DC PANDEY ENGLISHCHAPTER - SOLVD PAPERS 2017 NEET, AIIMS & JIPMEREXERCISE - Solved paper 2018(JIPMER)38videos
SOLVD PAPERS 2017 NEET, AIIMS & JIPMER
- BOOK - DC PANDEY ENGLISHCHAPTER - SUPERPOSITION OF WAVESEXERCISE - Level 2 Subjective8videos
SUPERPOSITION OF WAVES
Similar Questions
A roller skater carrying a portable stereo skates at constant speed an observer at rest. Which of the following accurately represents how are frequency perceived by the observer changes with time?
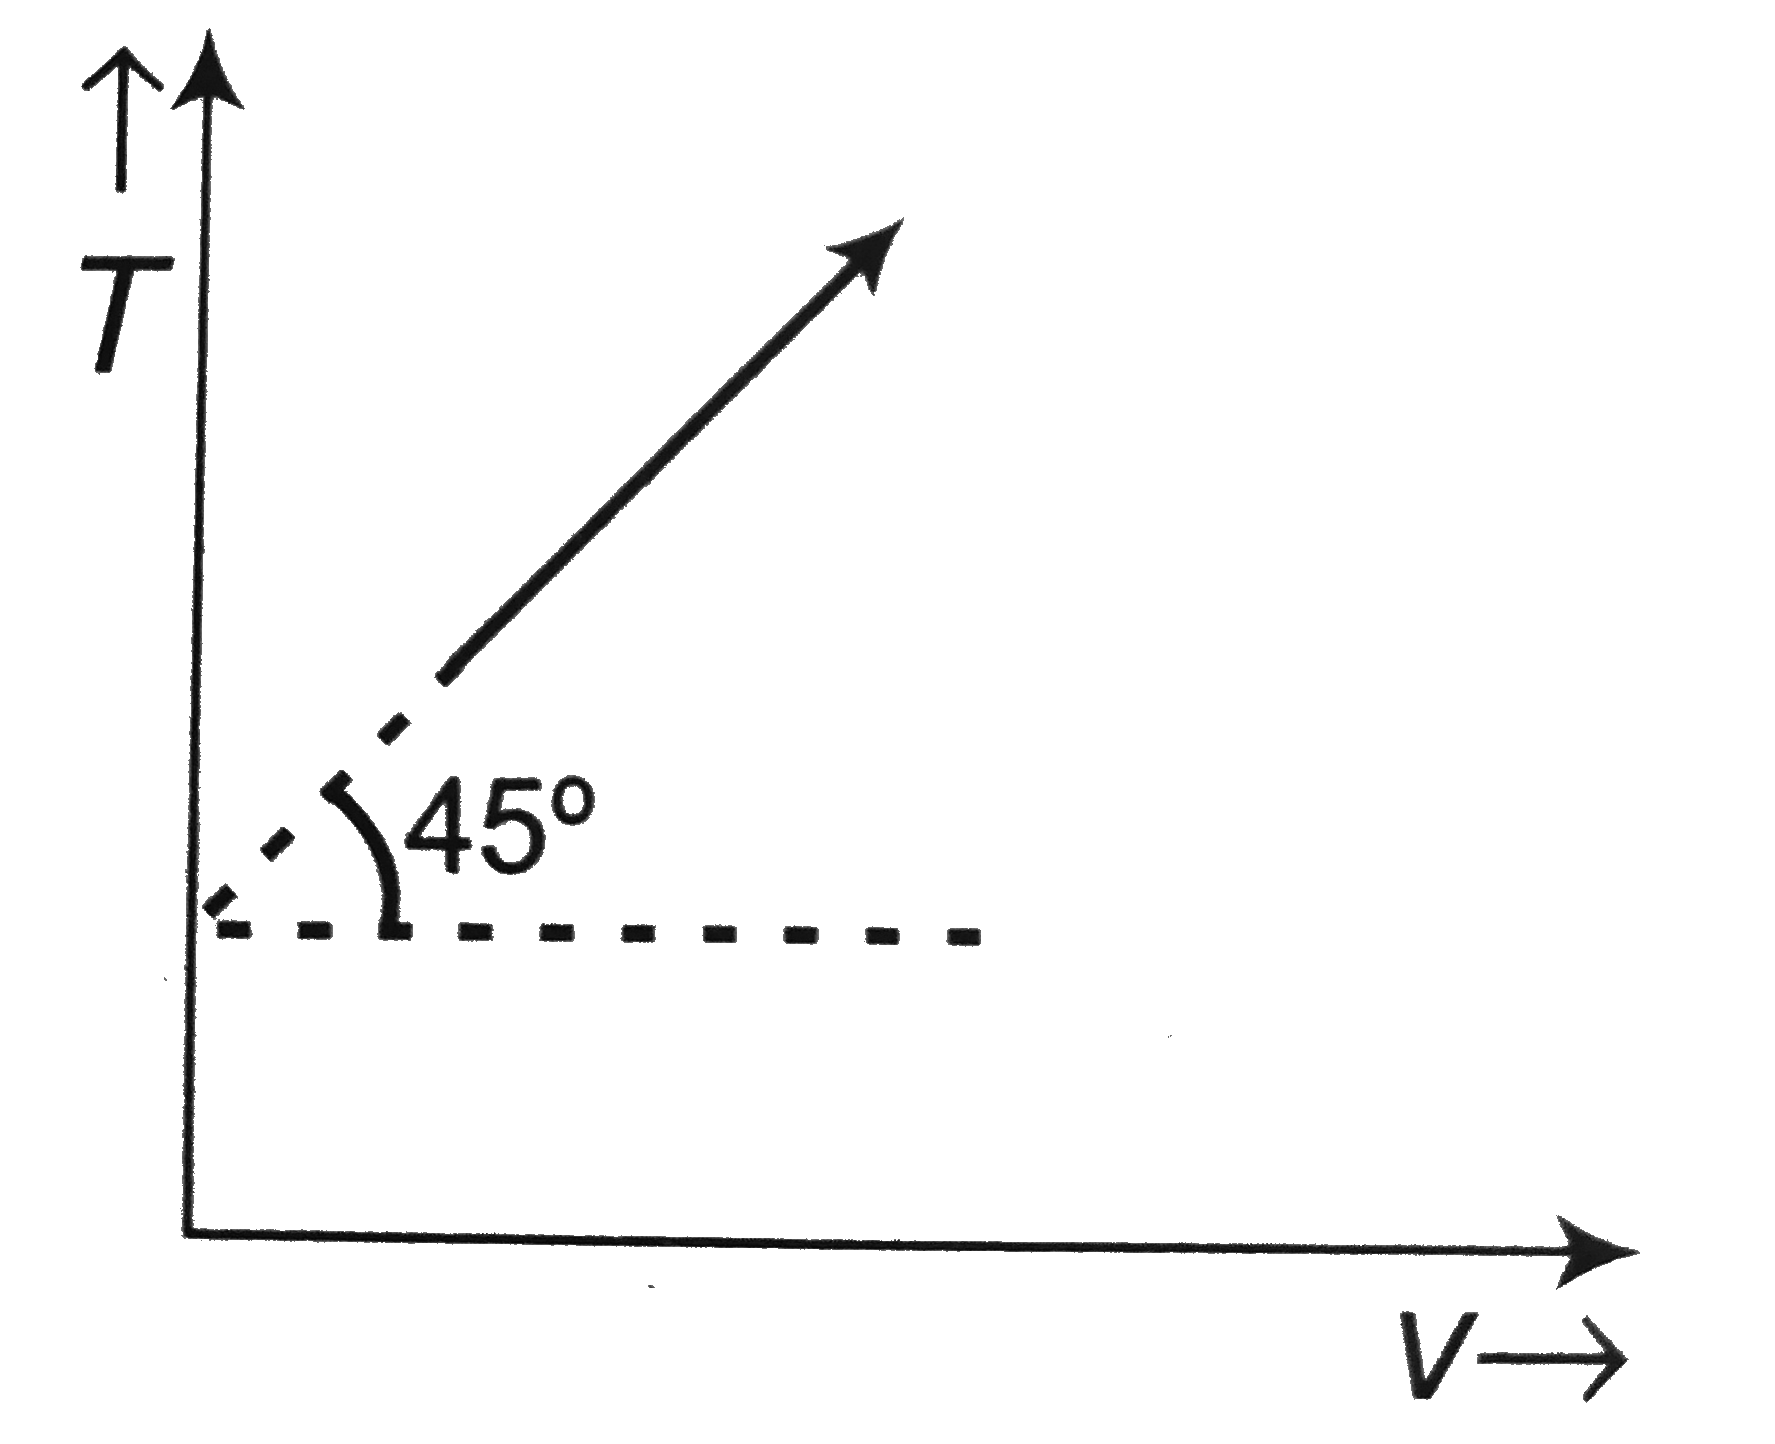
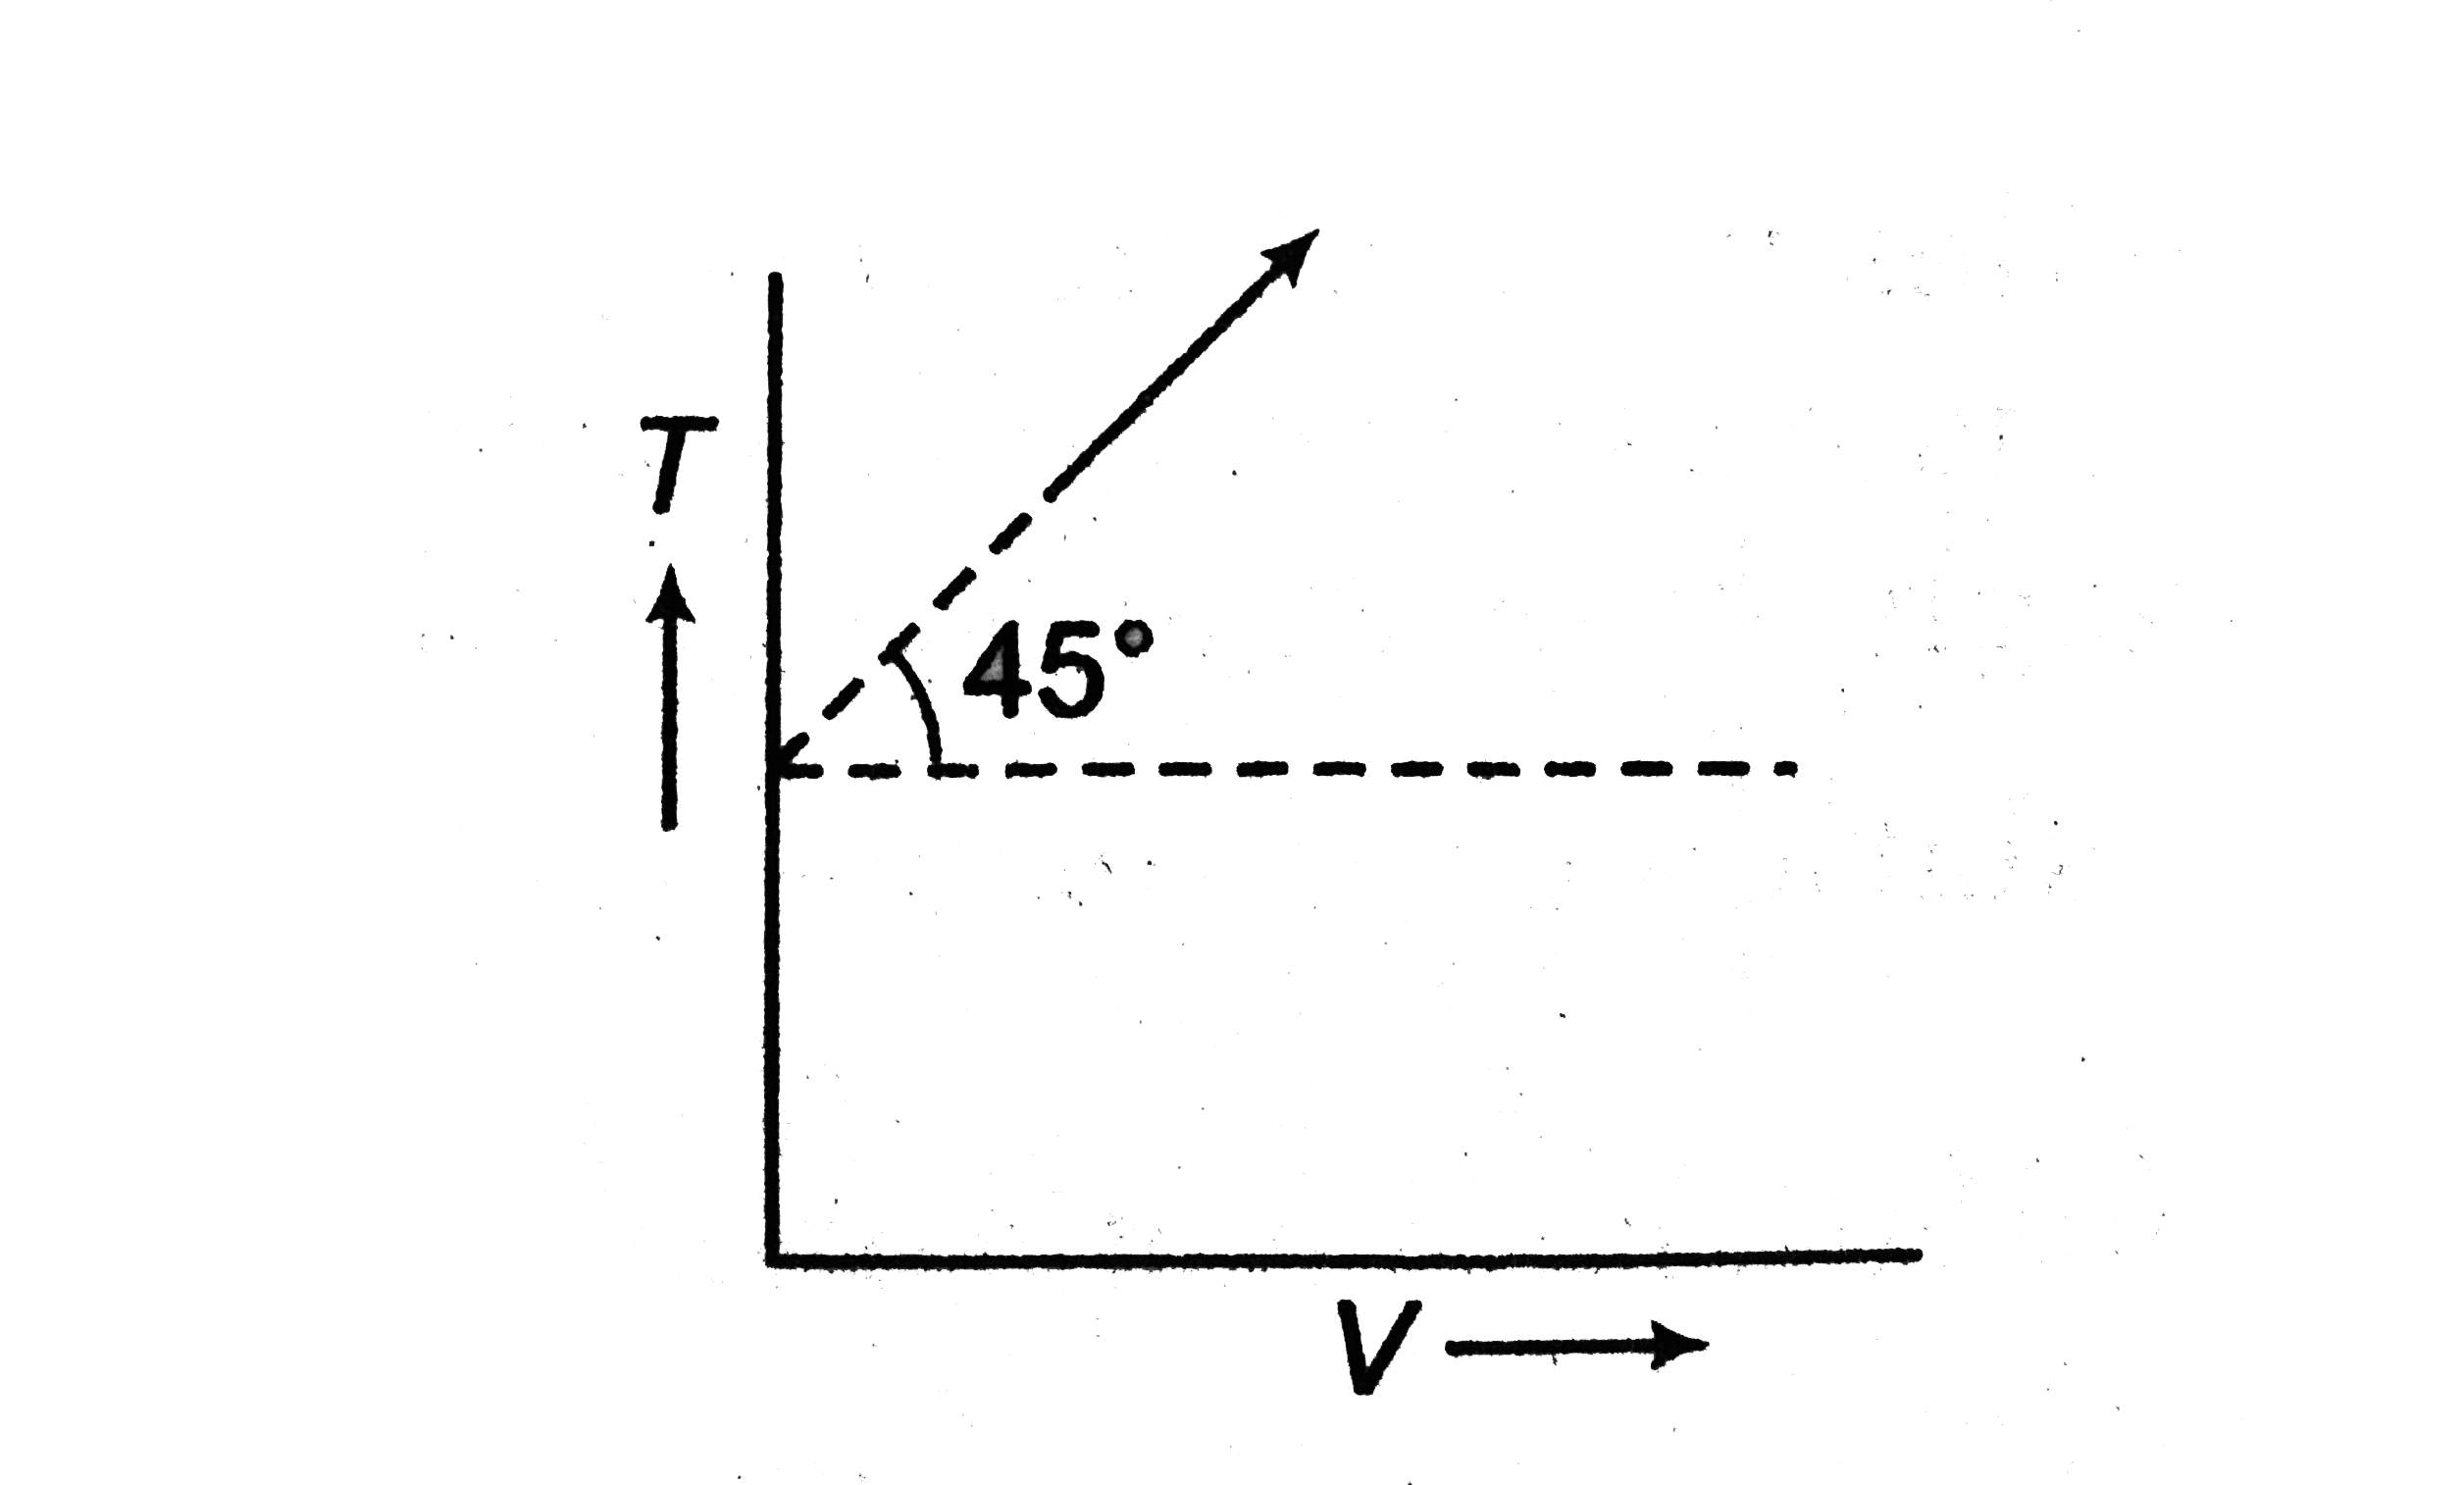
View SolutionThe given curve represents the variation of temperature as a function of volume for one mole of an ideal gas. Which of the following curves best represents the variation of pressure as a function of volume?
 View Solution
Knowledge Check
- Question 1 - Select One
A sound source is moving towards a stationary observer with 1/10 of the speed of sound. The ratio of apparent to real frequency is
A109B(109)2C(1110)2D1110
The given curve represents the variation of temperature as a function of volume for one mole of an ideal gas. Which of the following curves best represents the variation of pressure as a function of volume?
 View Solution
The given curve represents the variation of temperatue as a function of volume for one mole of an ideal gas. Which of the following curves best represents the variation of pressure as a function of volume ?
 .View Solution
The given curve represents the variation of temperatue as a function of volume for one mole of an ideal gas. Which of the following curves best represents the variation of pressure as a function of volume ?
 .View Solution
A train moves towards a stationary observer with speed 34 m/s. The train sounds a whistle and its frequency registered by the observer is f1. If the speed of train is reduced to 17 m/s, the frequency registered is f2. If speed fo sound is 340 m/s, then the ratio f1/f2 is :
View SolutionA train moves towards a stationary observer with speed 34m/s. The train sounds a whistle and its frequency registered by the observer is f1. If the train's speed is reduced to 17m/s, the frequency registered is f2. If the speed of sound of 340m/s, then the ratio f1/f2is
View SolutionA train moves towards a stationary observer with speed 34m/s. The train sounds a whistle and its frequency registered by the observer is f1. If the train's speed is reduced to 17m/s, the frequency registered is f2. If the speed of sound of 340m/s, then the ratio f1/f2is
View SolutionA train whistling at constant frequency is moving towards a station at a constant speed V. The train goes past a stationary observer on the station. The frequency n′ of the sound as heard by the observer is plotted as a function of time t, figure. Identify the expected curve.
View Solution

