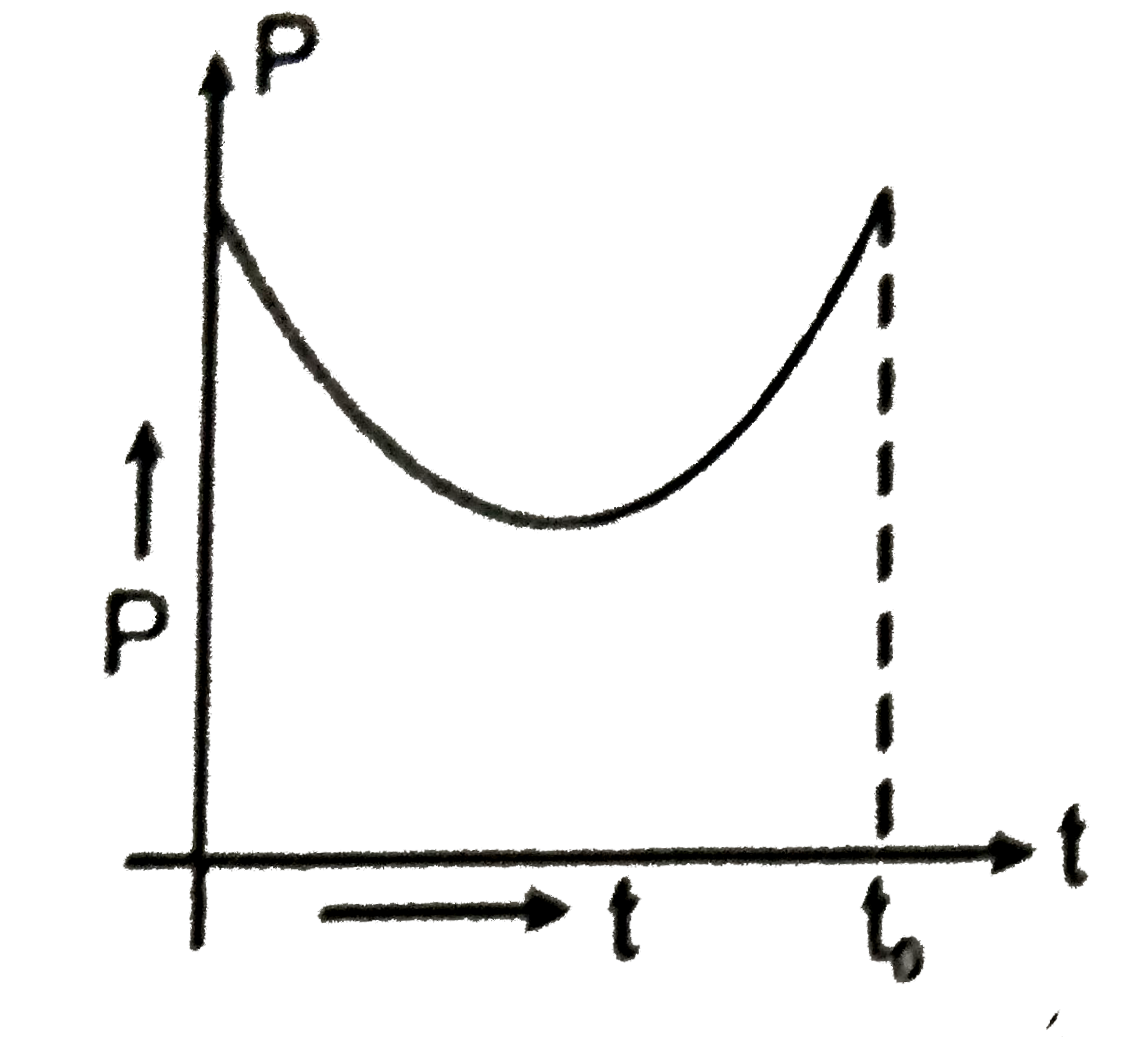
Power versus time graph for a give force is given below. Work done
by the force upto time t(≤t0).

A
First decreases then increases
B
First increases then decreases
C
Always increases
D
Always decreases
Video Solution
Text Solution
The correct Answer is:C
The work done by force from time t=0 to t=tsec. is given by shaded area in graphs below. Hence as t increases, this area increses.

∴Work done by force keeps on increasing .
|
Updated on:21/07/2023
Topper's Solved these Questions
- BOOK - RESONANCE ENGLISHCHAPTER - DAILY PRACTICE PROBLEMSEXERCISE - dpp 417videos
DAILY PRACTICE PROBLEMS
- BOOK - RESONANCE ENGLISHCHAPTER - DAILY PRACTICE PROBLEMSEXERCISE - dpp 427videos
DAILY PRACTICE PROBLEMS
- BOOK - RESONANCE ENGLISHCHAPTER - DAILY PRACTICE PROBLEMSEXERCISE - dpp 393videos
DAILY PRACTICE PROBLEMS
- BOOK - RESONANCE ENGLISHCHAPTER - CURRENT ELECTRICITYEXERCISE - Exercise53videos
CURRENT ELECTRICITY
- BOOK - RESONANCE ENGLISHCHAPTER - ELASTICITY AND VISCOCITYEXERCISE - Advanced Level Problems9videos
ELASTICITY AND VISCOCITY
Similar Questions
Knowledge Check
- Question 1 - Select One
the work done by applied force is
A10 JB50 JC100 JD150 J - Question 2 - Select One
Work done = force × ………..
AdistanceBvelocityCtimeDdisplacement - Question 3 - Select One
Work done by buoyant force is .......
ApositiveBnegativeCzeroDcannot definitely say
Work done by a spring force is
View SolutionWork done by a frictional force is
View SolutionWork done by a frictional force is
View SolutionWork done by force of static friction .
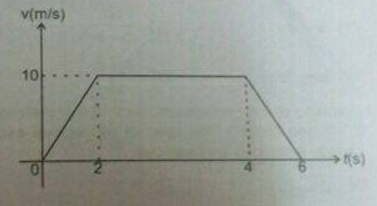
View SolutionA particle of mass 1 kg is moved under the action of a force and velocity time graph of the particle is shown in figure.Work done by the force from t=0 to t=6 s Is
 View Solution

