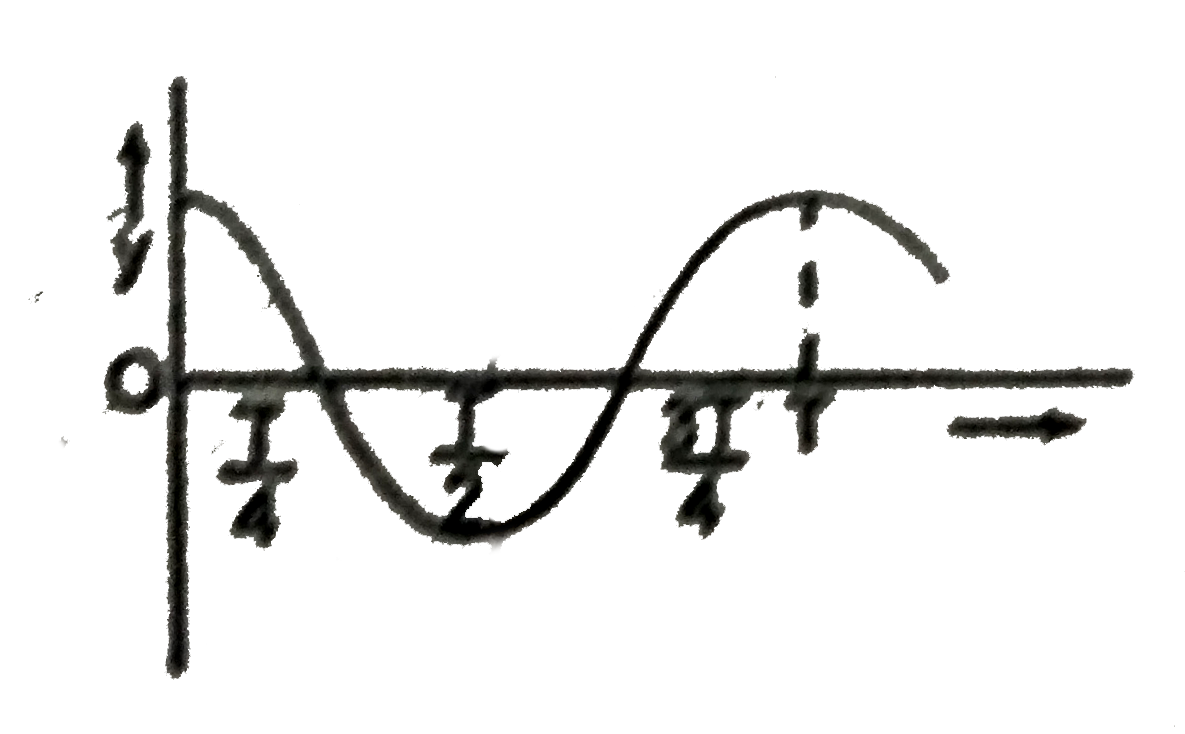
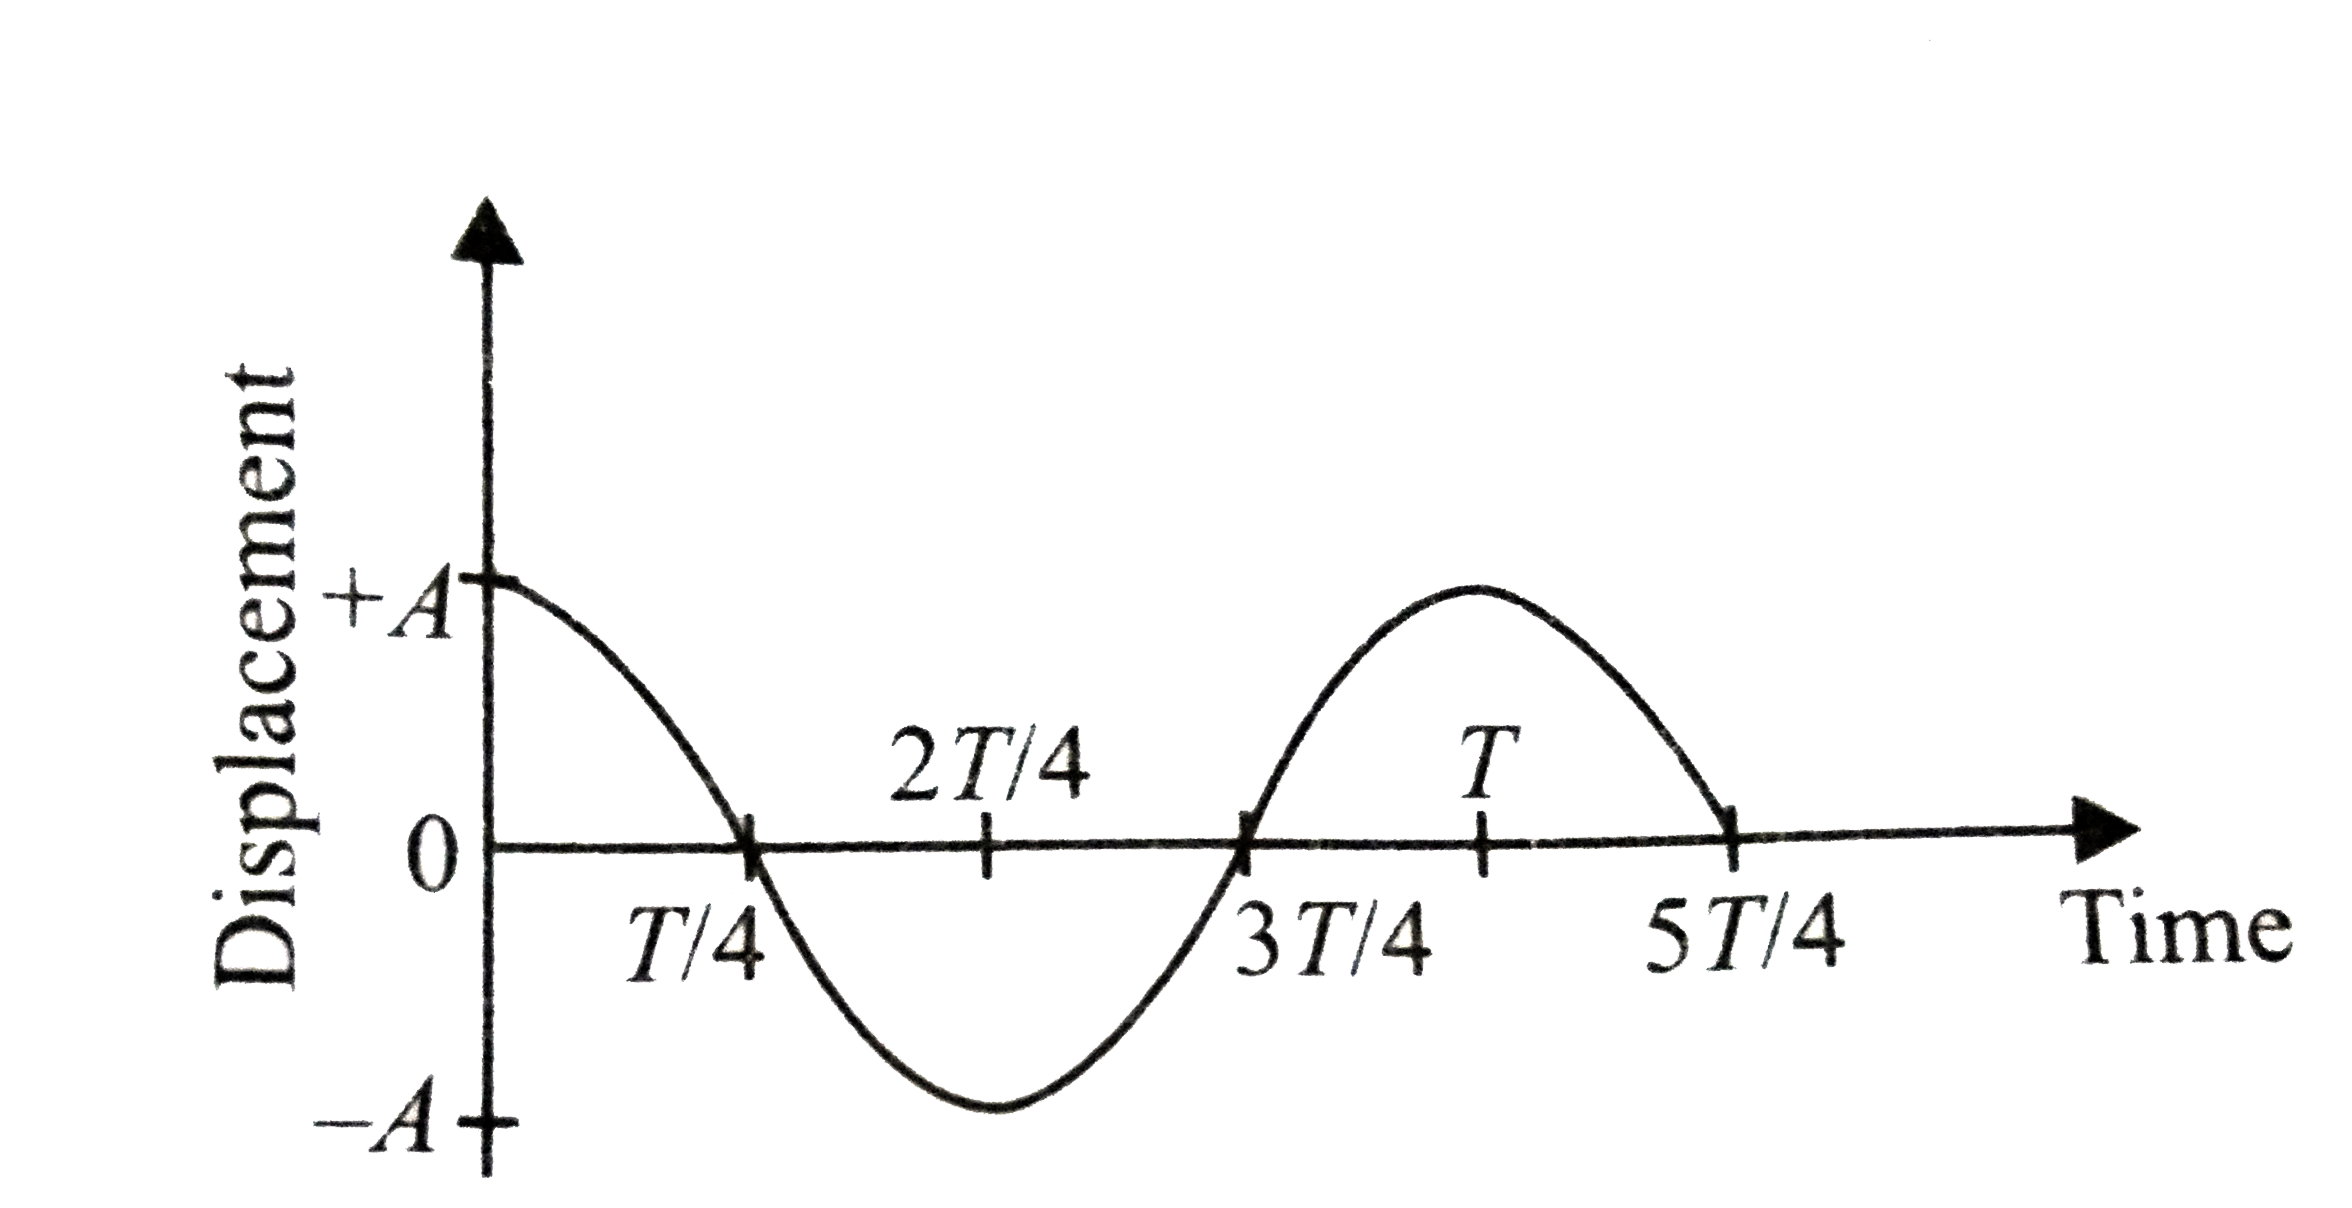
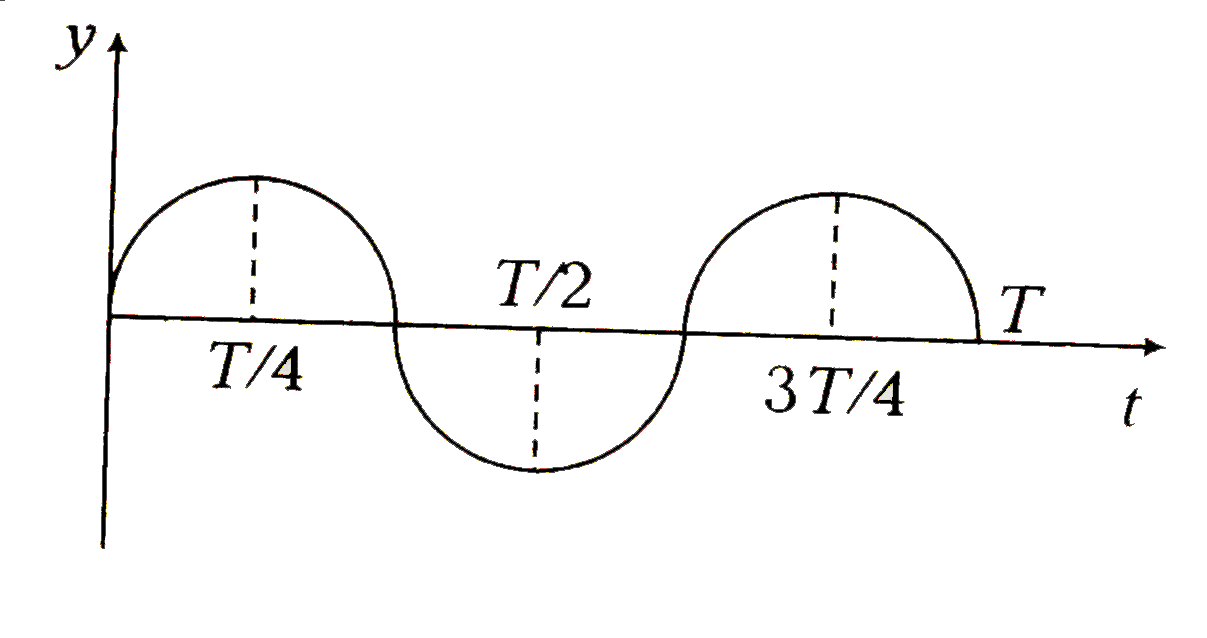
The graph in the figure shows how the displacement of a particle describing S.H.M. varies with time. Which one of the following statements is not true ?
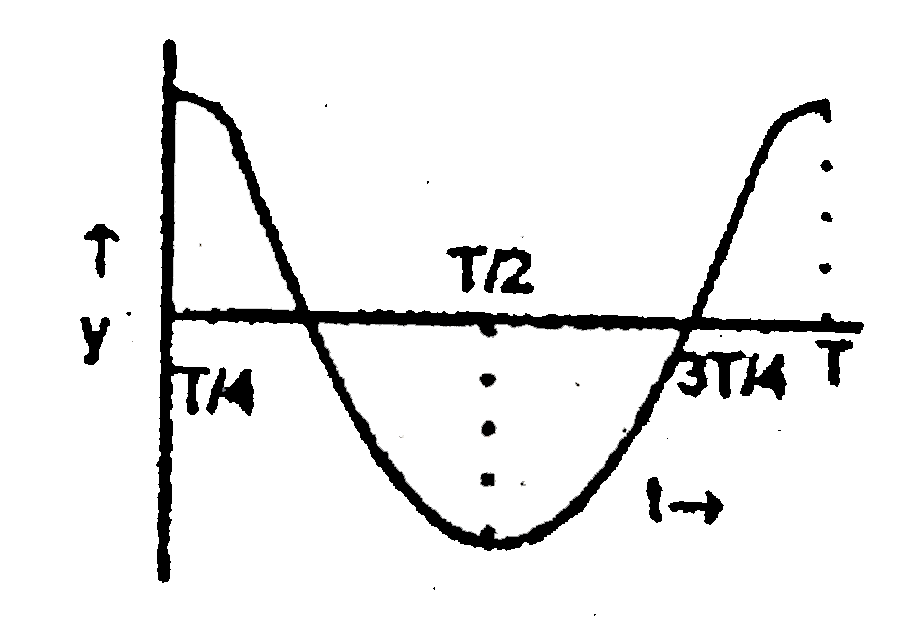
the force is zero at time 3T4
the velocity is maximum at time T/2
the acceleration is maximum at time T
the P.E = total energy at time T/2
The correct Answer is:B
The velocity is maximum at time T/2
Topper's Solved these Questions
- DAILY PRACTICE PROBLEMBOOK - RESONANCE ENGLISHCHAPTER - DAILY PRACTICE PROBLEMEXERCISE - DPP No.30
9 Videos
- DAILY PRACTICE PROBLEMBOOK - RESONANCE ENGLISHCHAPTER - DAILY PRACTICE PROBLEMEXERCISE - DPP No.31
20 Videos
- DAILY PRACTICE PROBLEMBOOK - RESONANCE ENGLISHCHAPTER - DAILY PRACTICE PROBLEMEXERCISE - DPP No.28
9 Videos
- CURRENT ELECTRICITYBOOK - RESONANCE ENGLISHCHAPTER - CURRENT ELECTRICITYEXERCISE - High Level Problems (HIP)
19 Videos
- ELECTRO MAGNETIC WAVESBOOK - RESONANCE ENGLISHCHAPTER - ELECTRO MAGNETIC WAVESEXERCISE - Exercise 3
27 Videos
Similar Questions
The displacement-time graph of a particle executing SHM is shown in figure. Which of the following statement is/are true ?
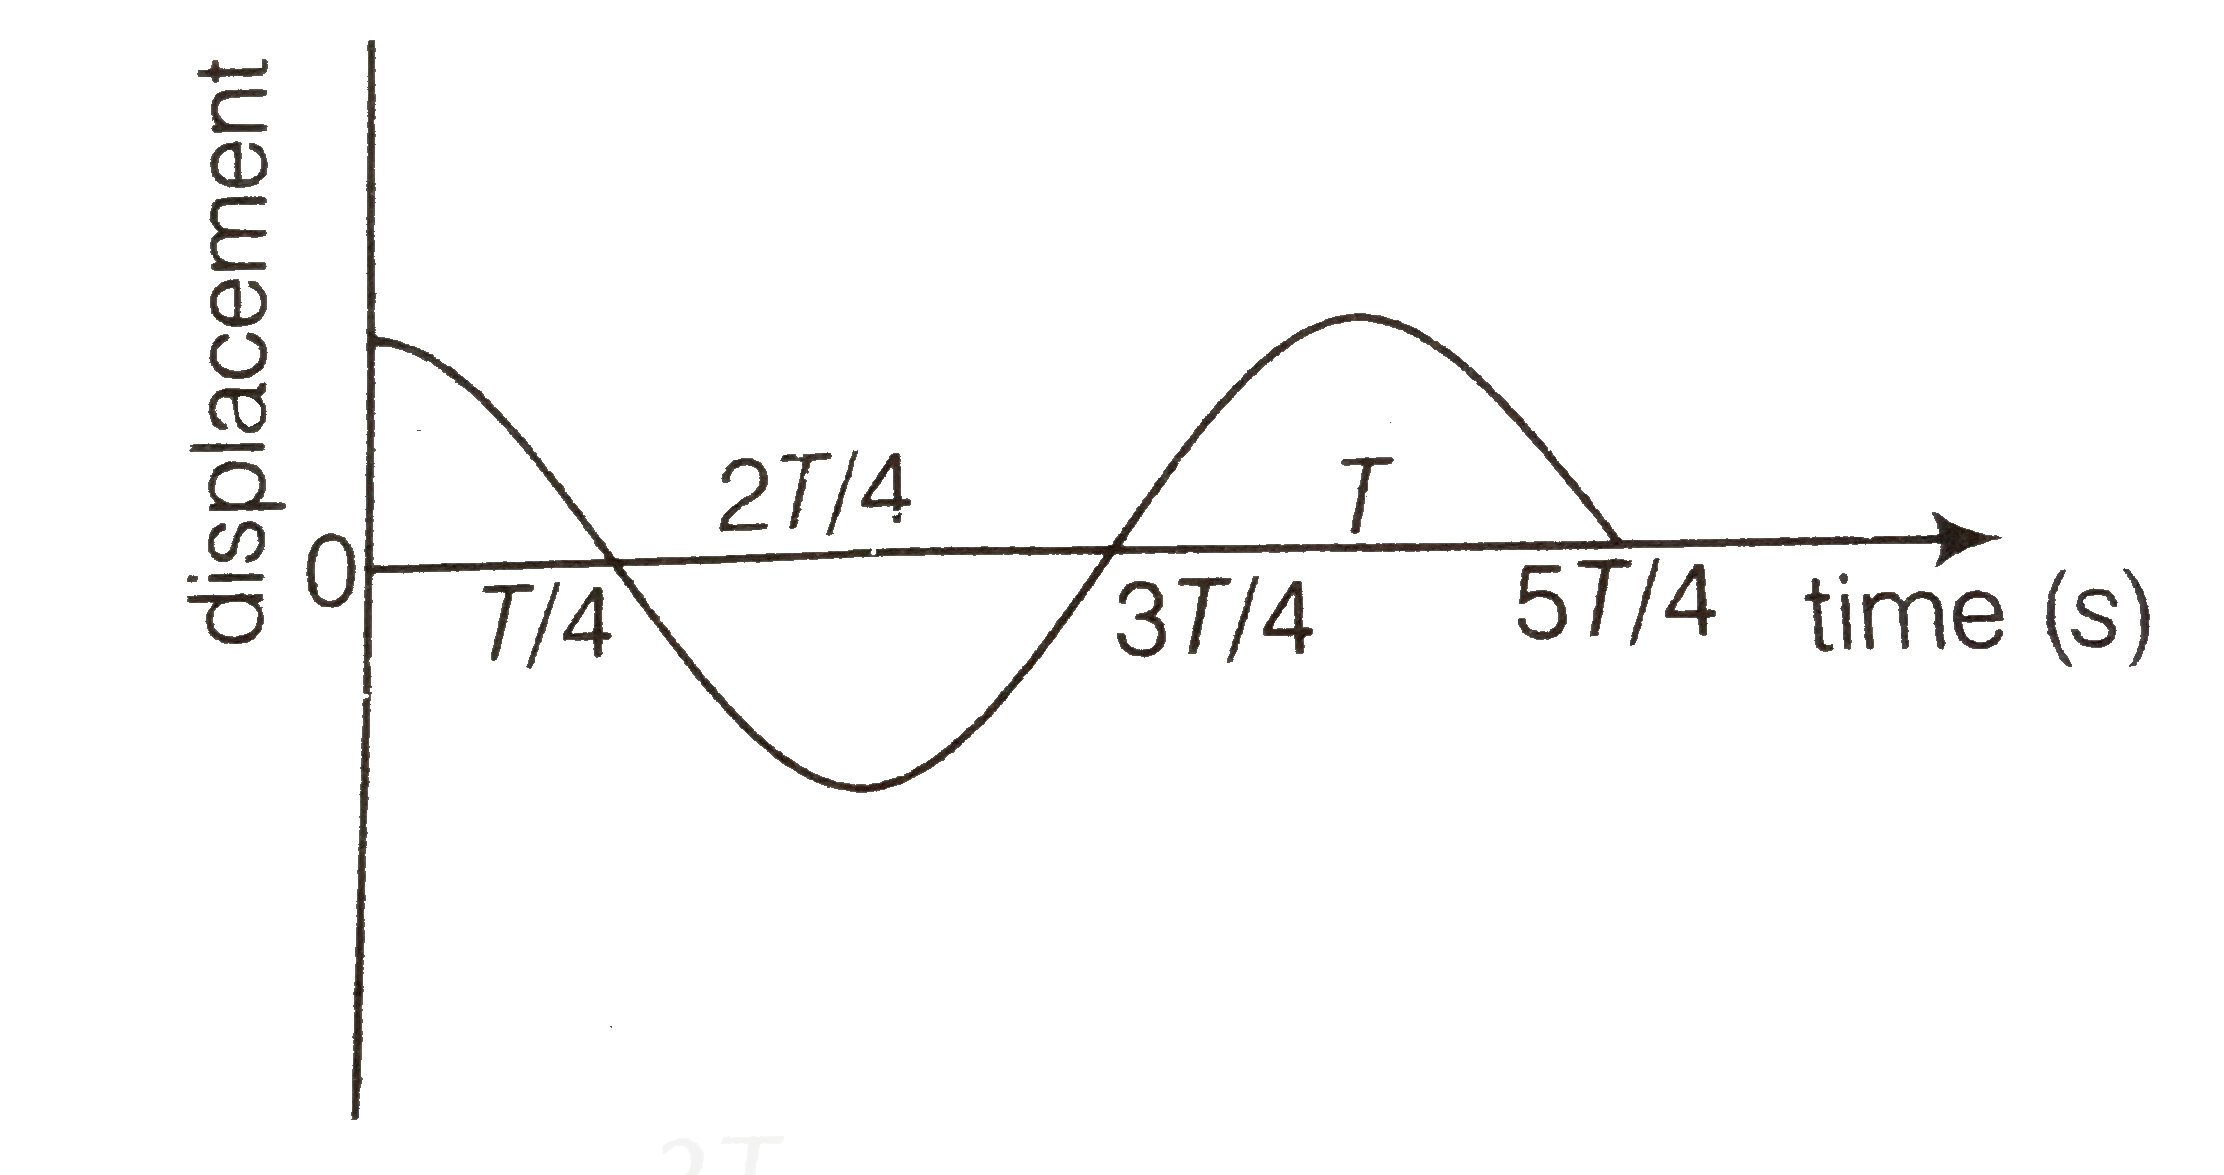
View SolutionThe displecement-time graph of a particle execting SHM is shown in figure. Which of the following statements is false?
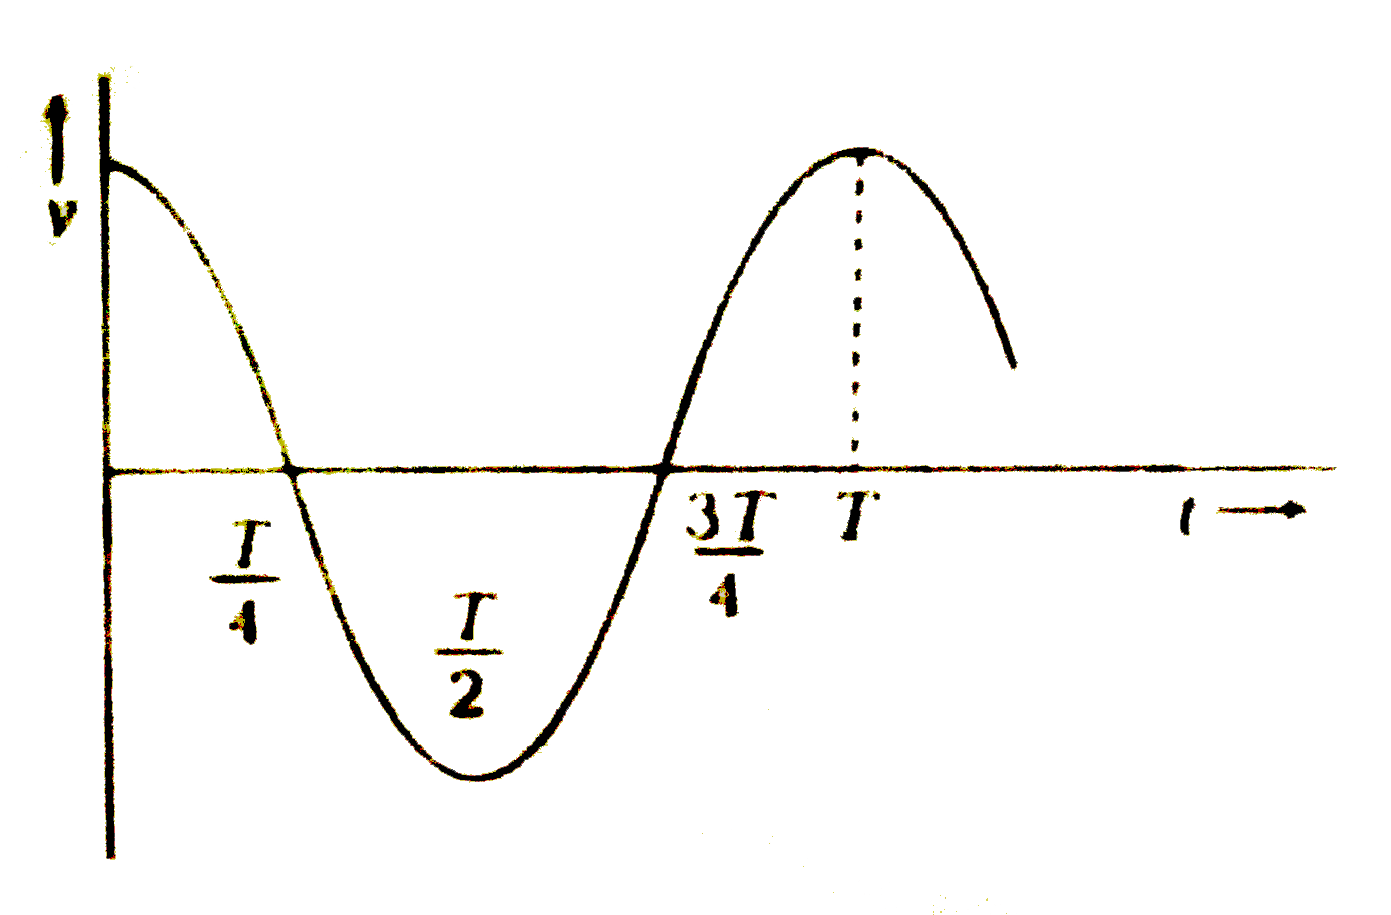
View SolutionThe displacement - time graph of a particle executing SHM is shown in figure. Which of the following statements is//are true ?
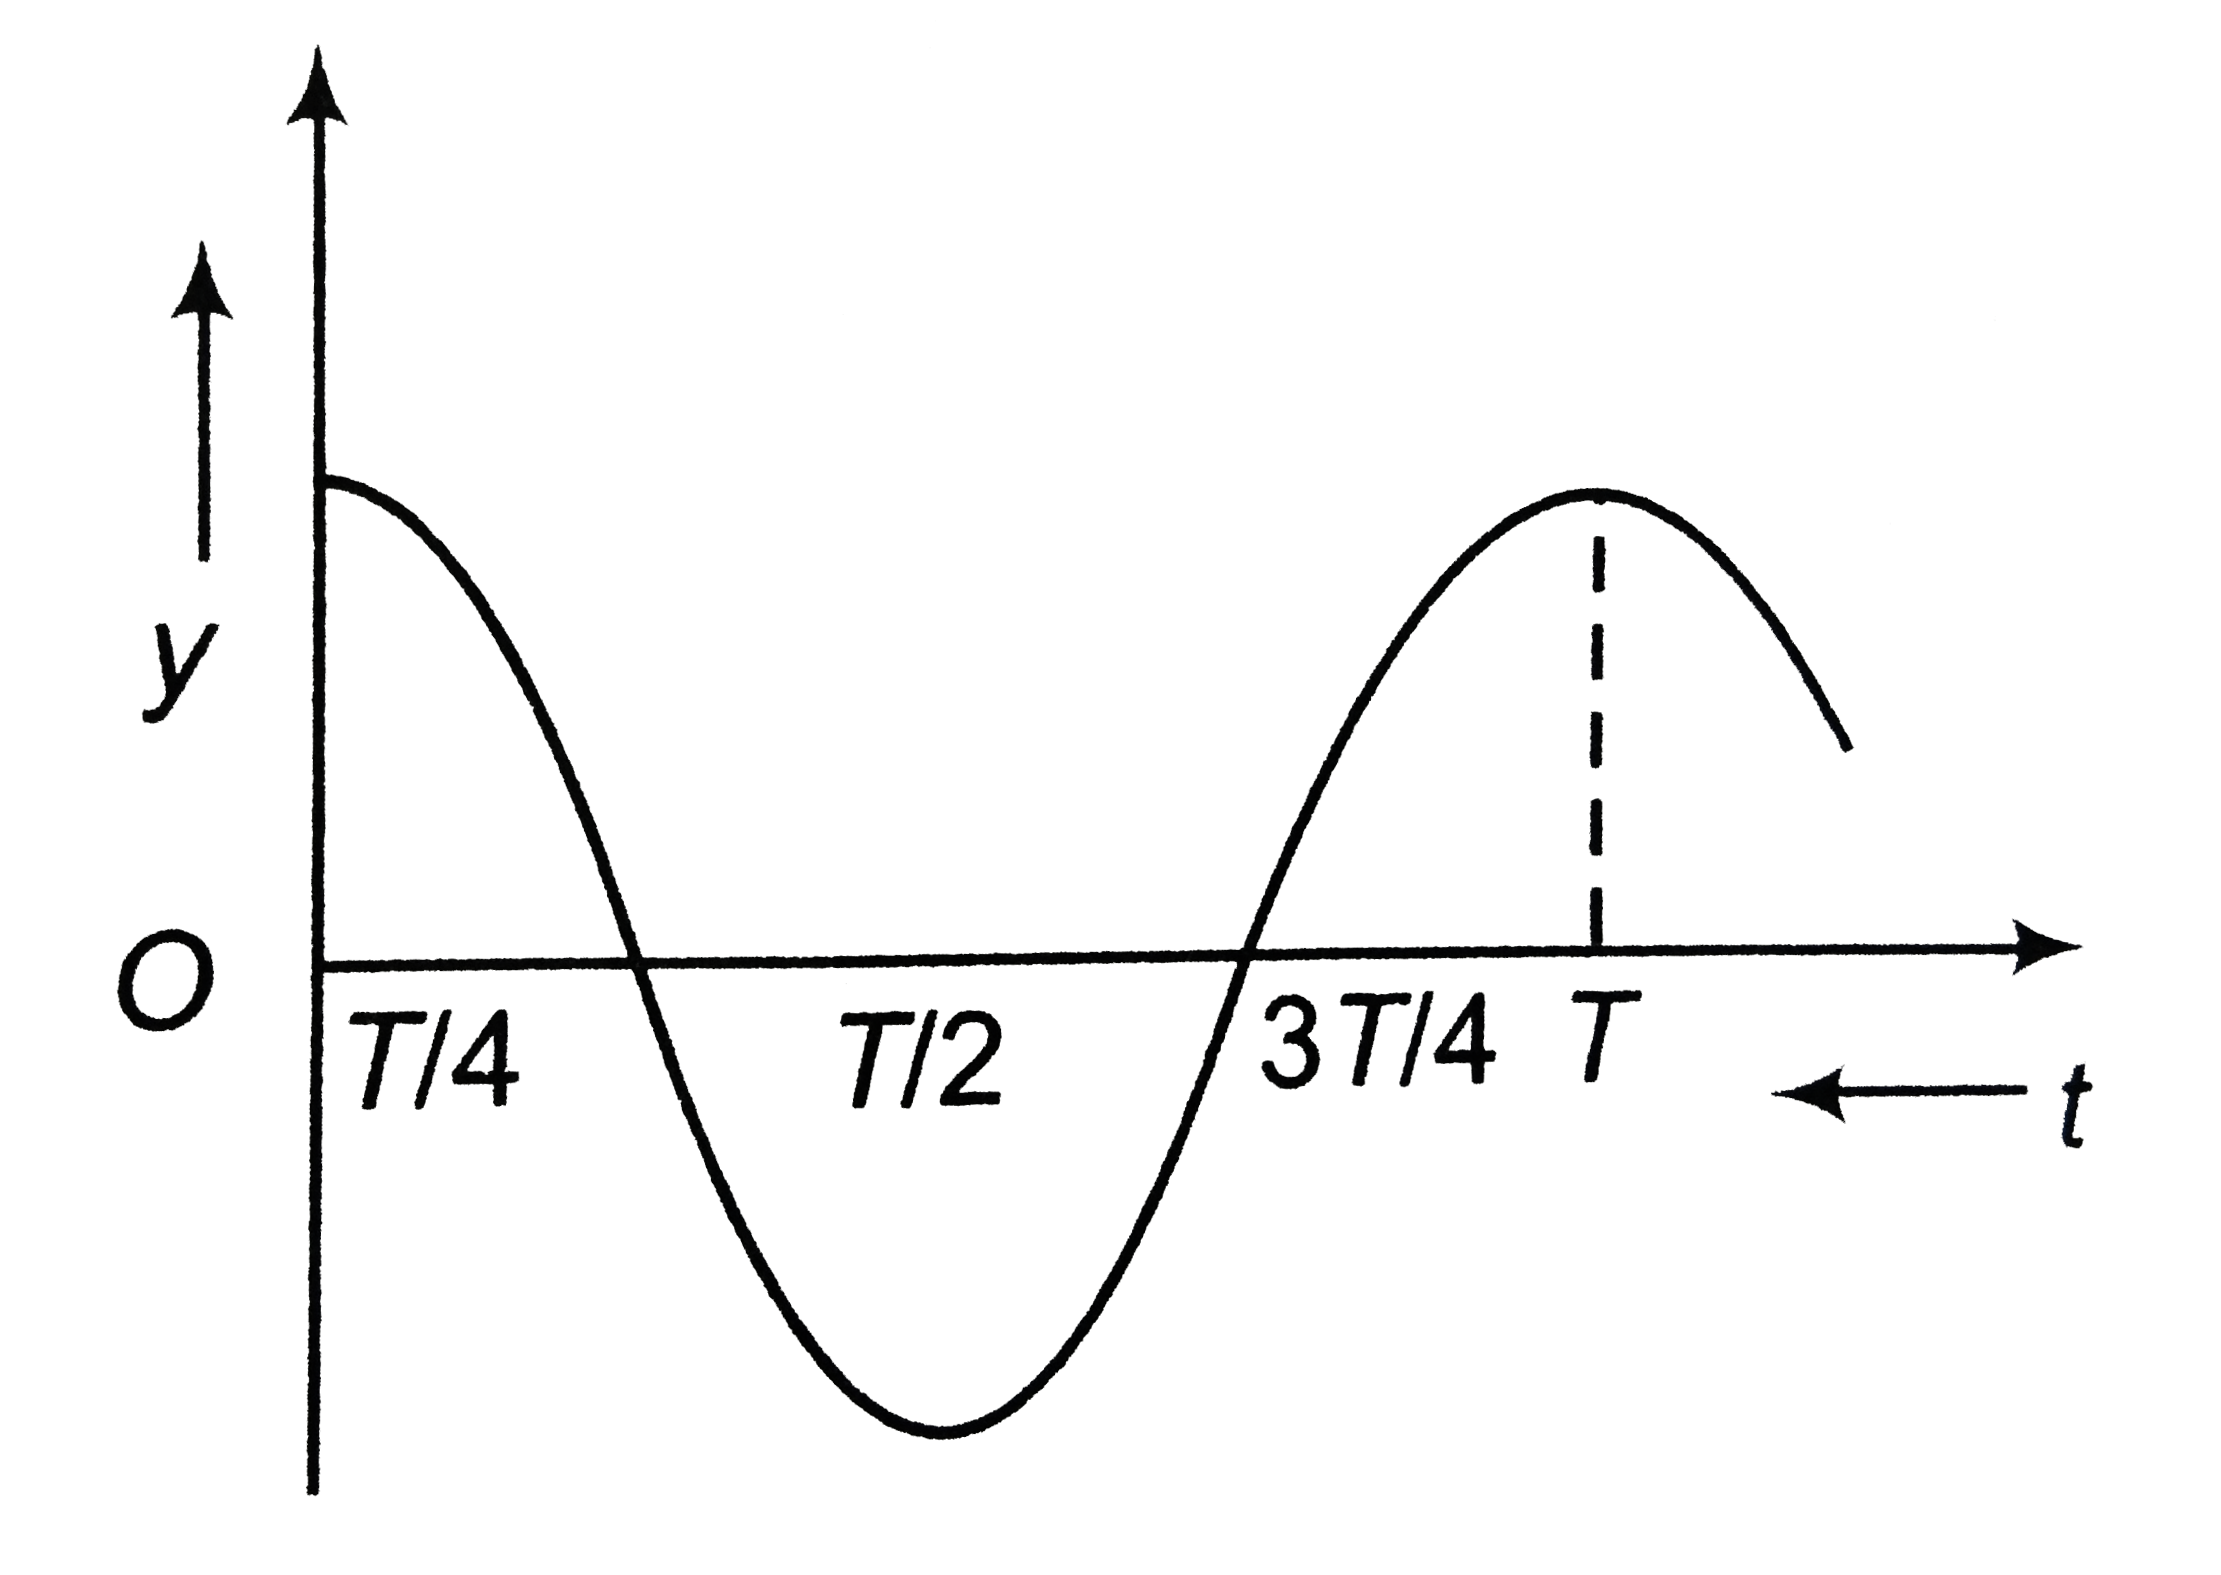
View SolutionThe displacement time graph of a particle executing S.H.M. (in straight line) is shown. Which of the following statements is true?
View SolutionThe displacement-time graph for a particle executing SHM is as shown in figure. Which of the following statements is correct?
View Solution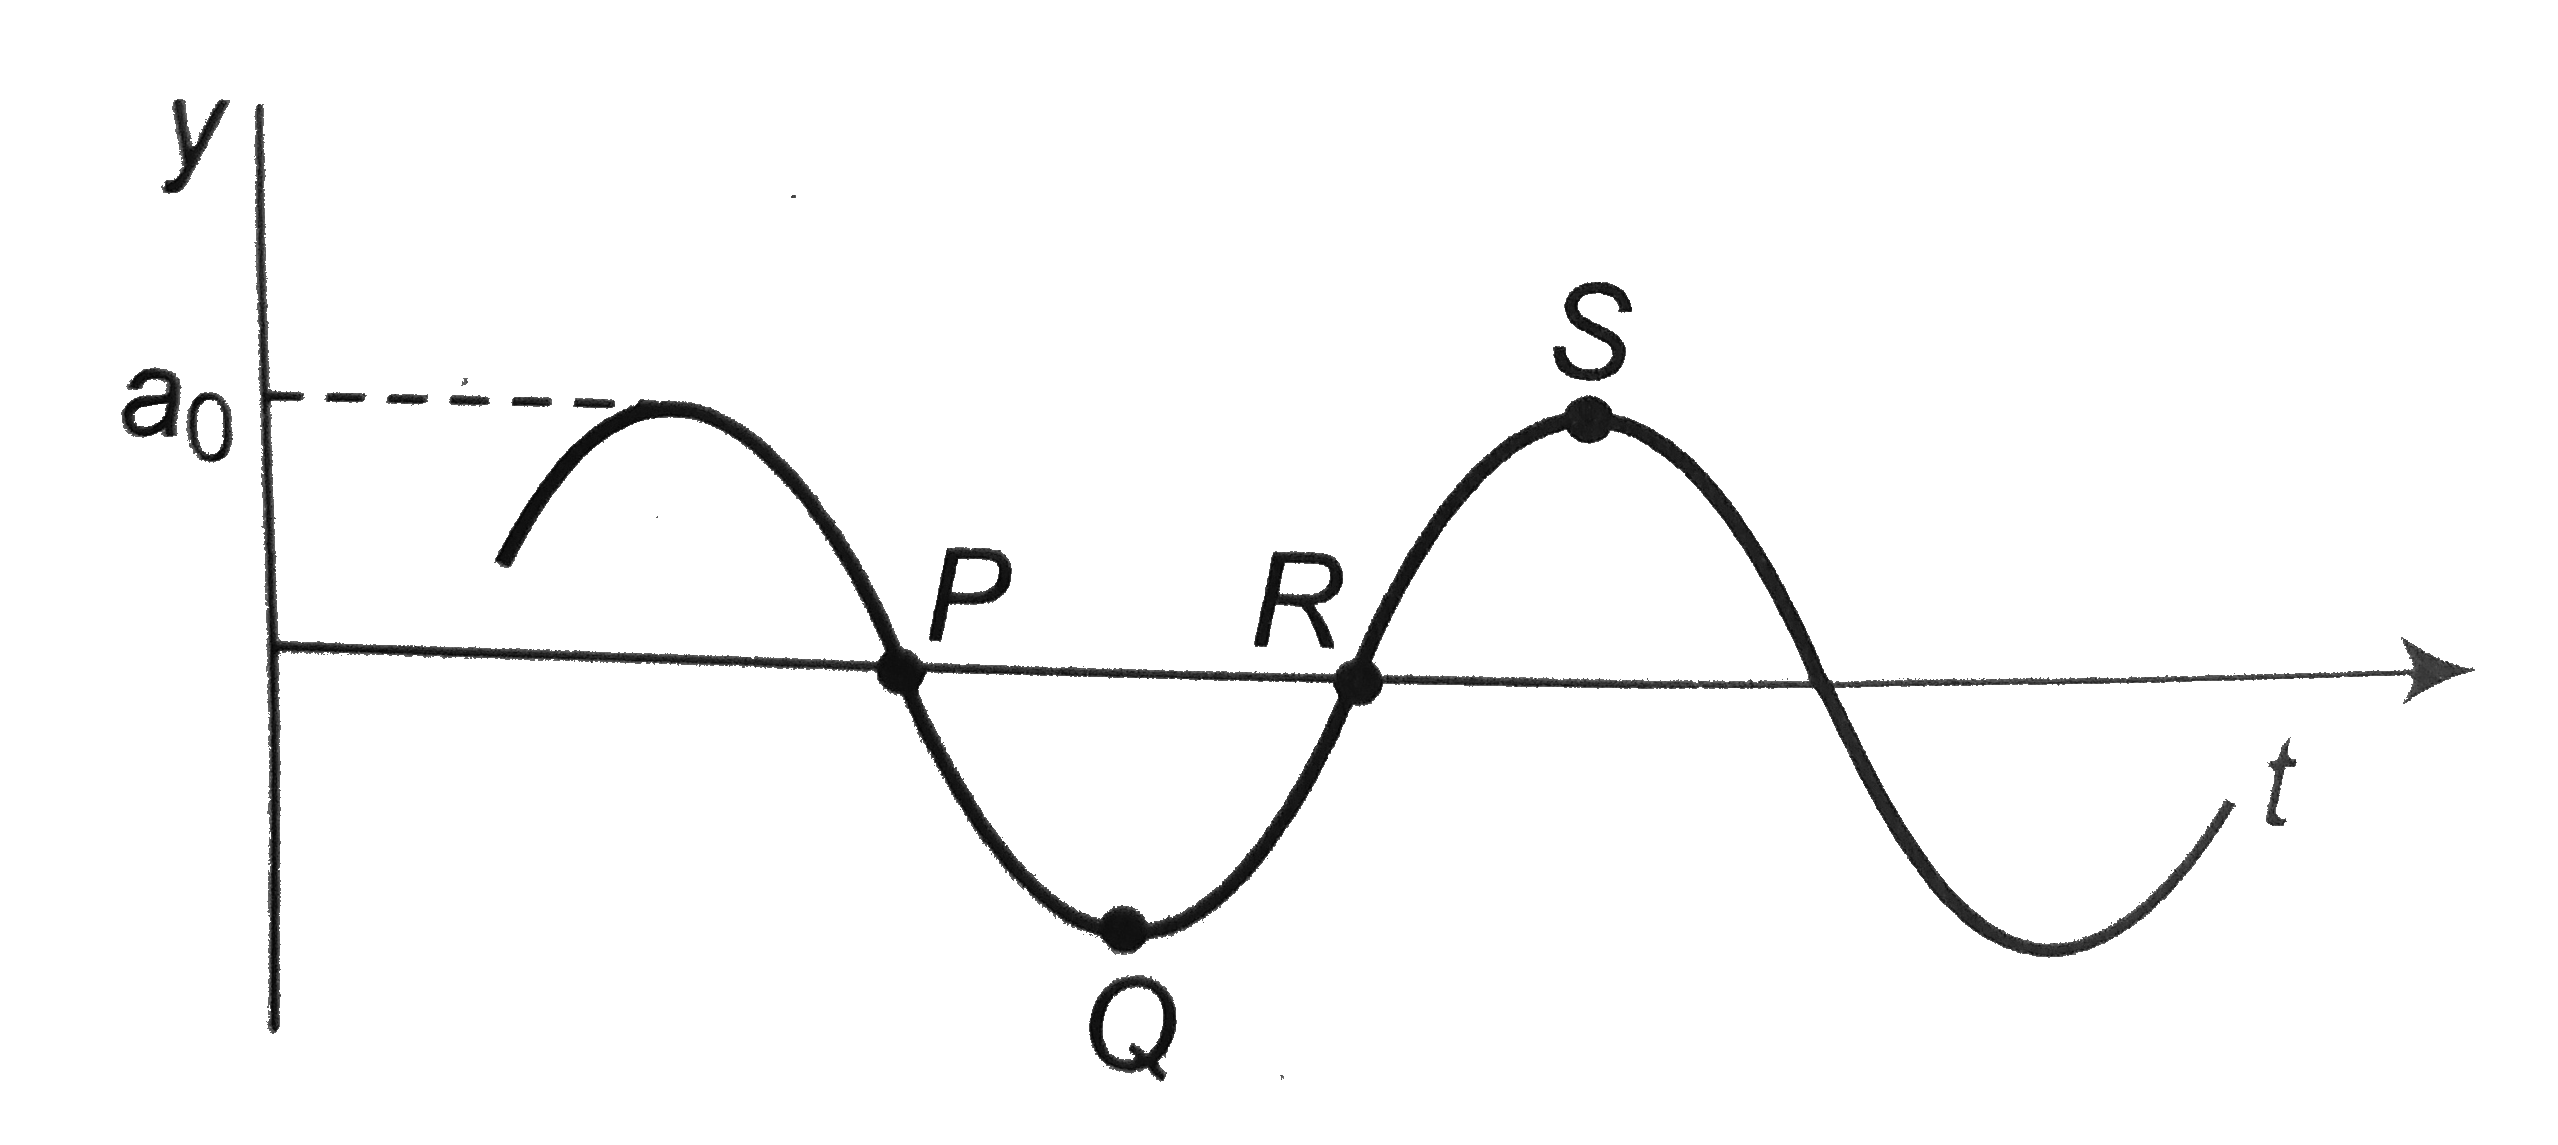
A wave motion has the function y=a0sin(ωt−kx). The graph in figure shows how the displacement y at a fixed point varies with time t. Which one of the labelled points Shows a displacement equal to that at the position x=π2k at time t=0?
View SolutionFigure shows the displacement time graph of a particle moving on the X-axis

View SolutionFigure shows the displacement-time graph of a particle moving on the X-axis

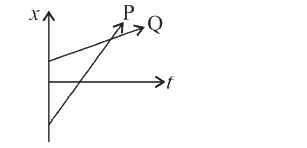
View SolutionFigure shows the displacement -time curve of the particles P and Q. Which of the following statement is correct ?
View SolutionThe graph shows the variation of displacement of a particle execting SHM with time . We infer from this graph that
View Solution
