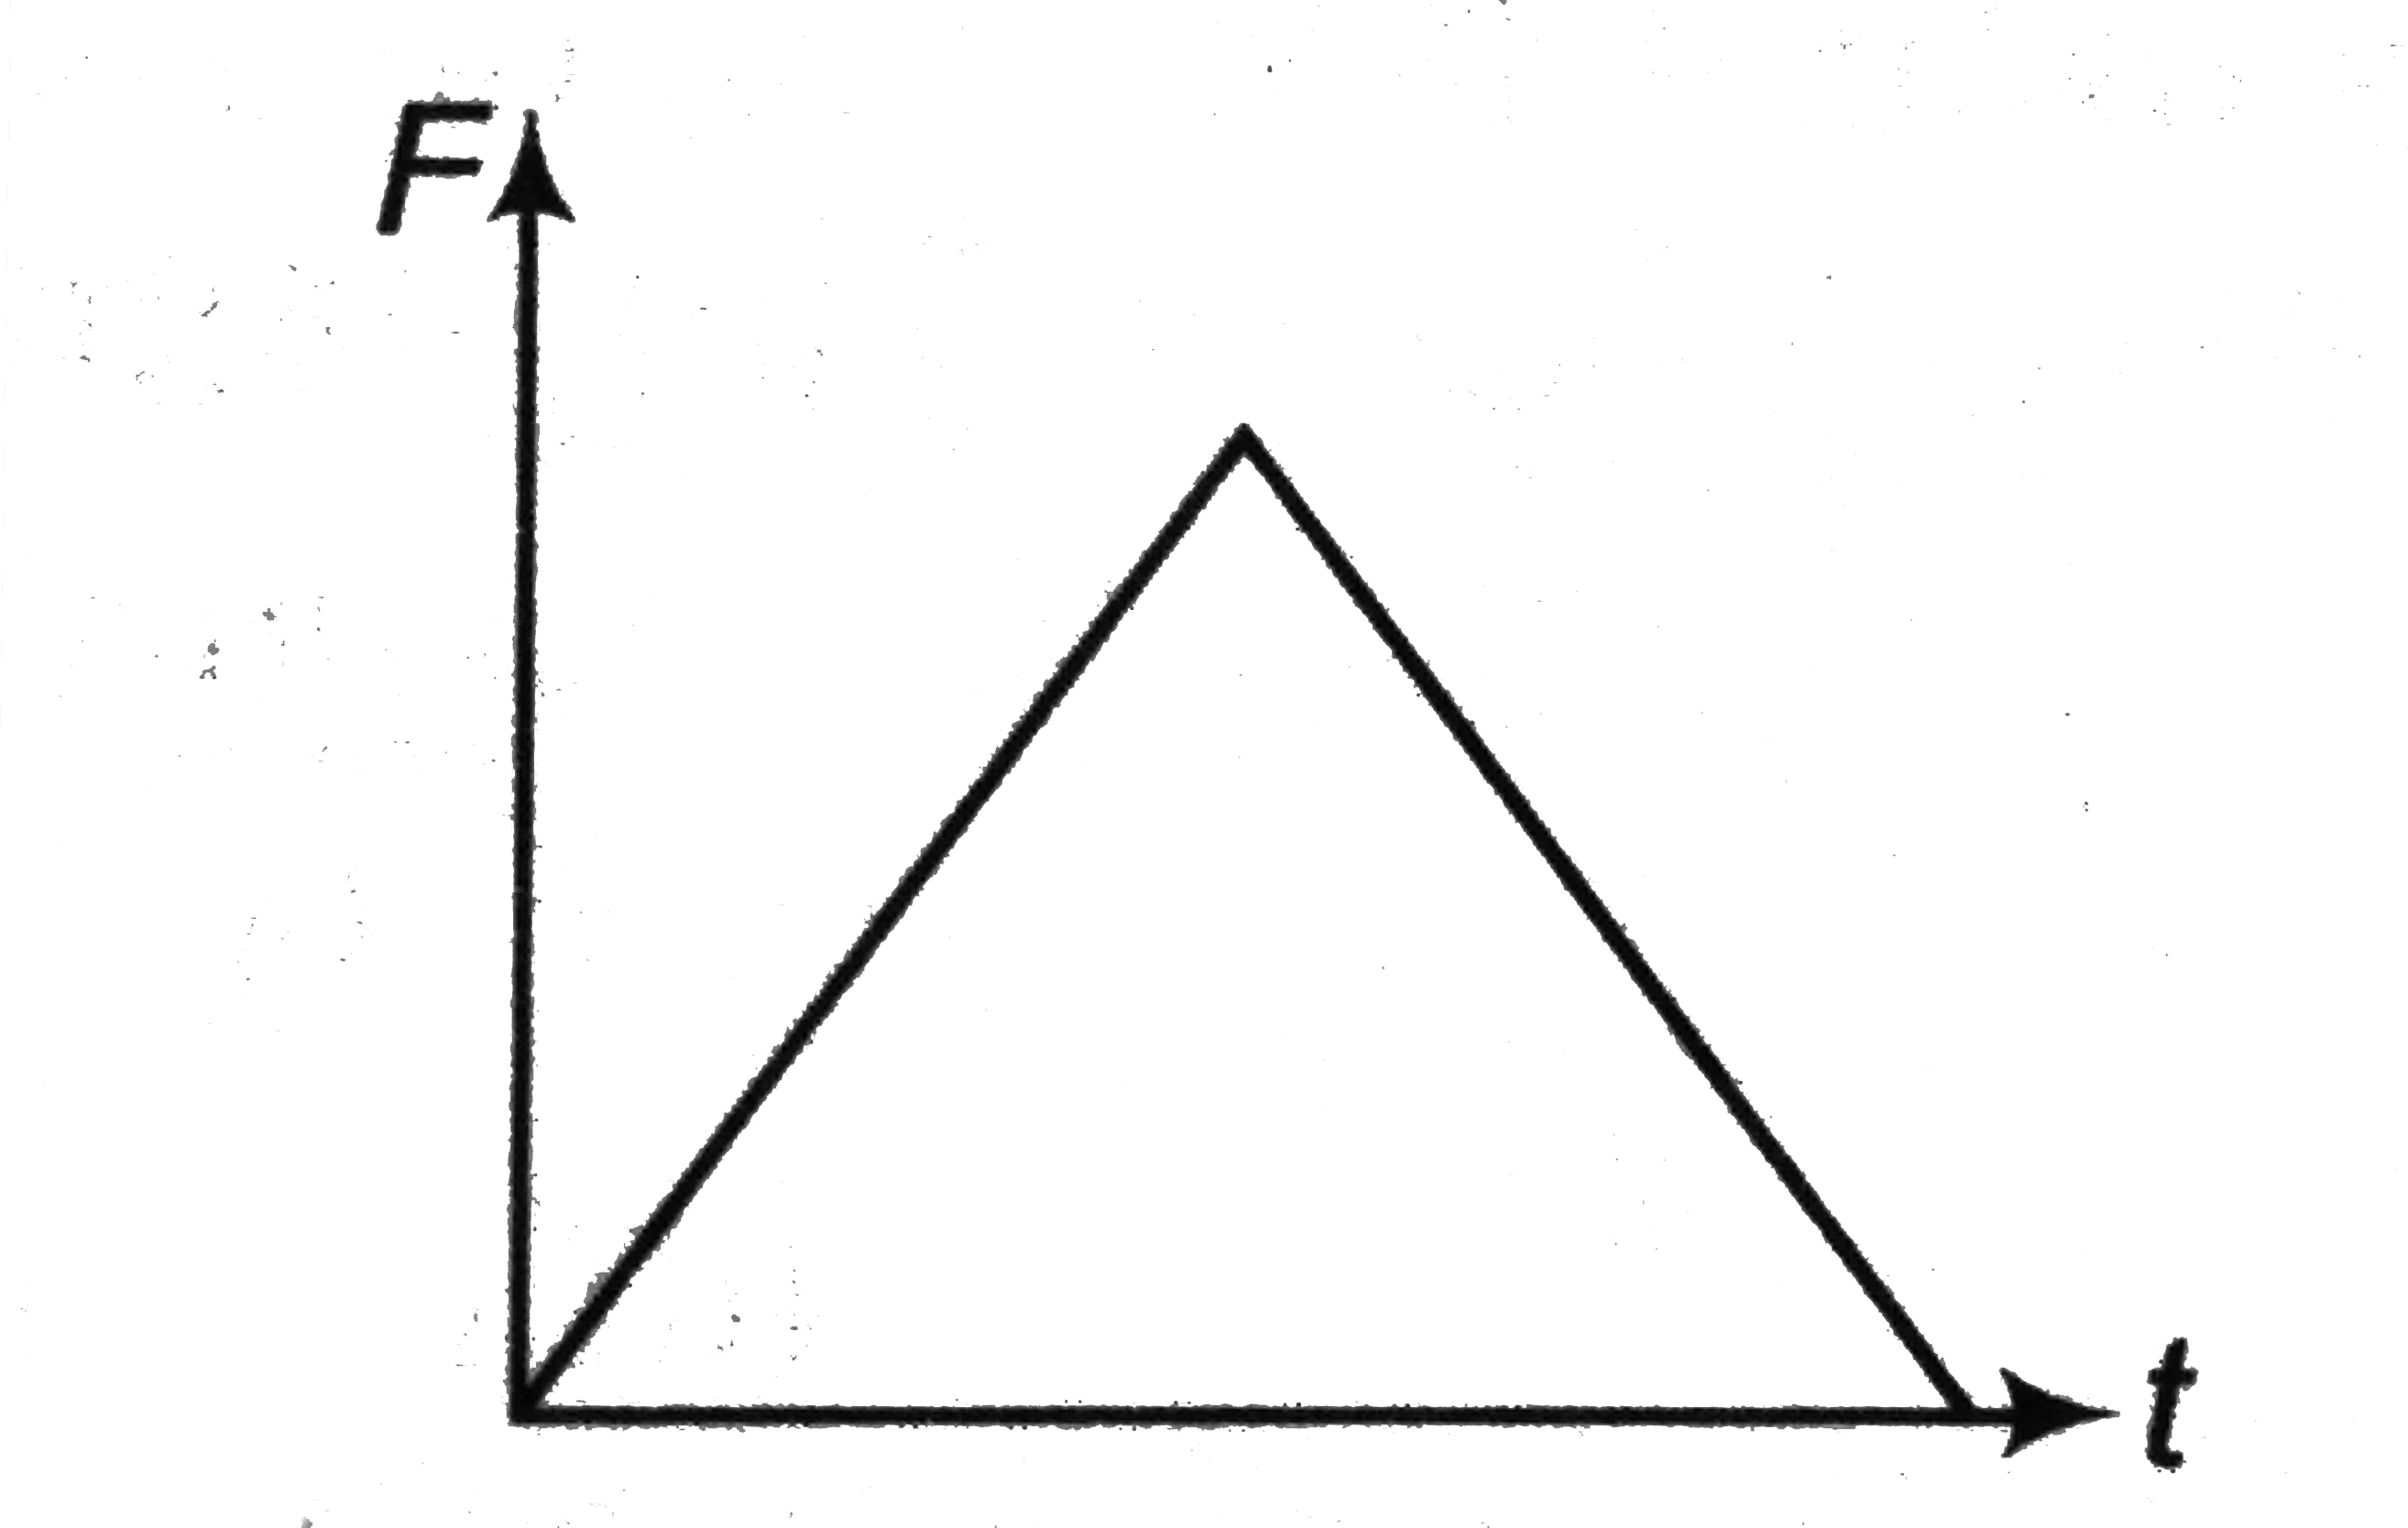
The force acting on a particle moving along a straight line varies with time as shown in diagram.
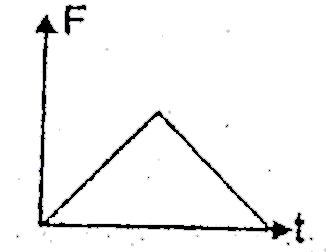
Which of the following graphs is best representative of its speed and time graphs. Initial velocity the particle is zero.
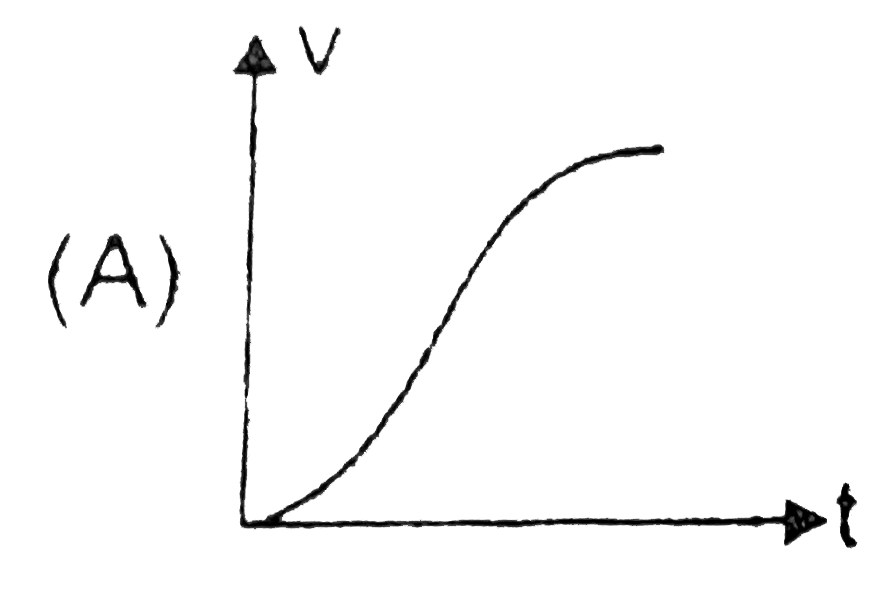
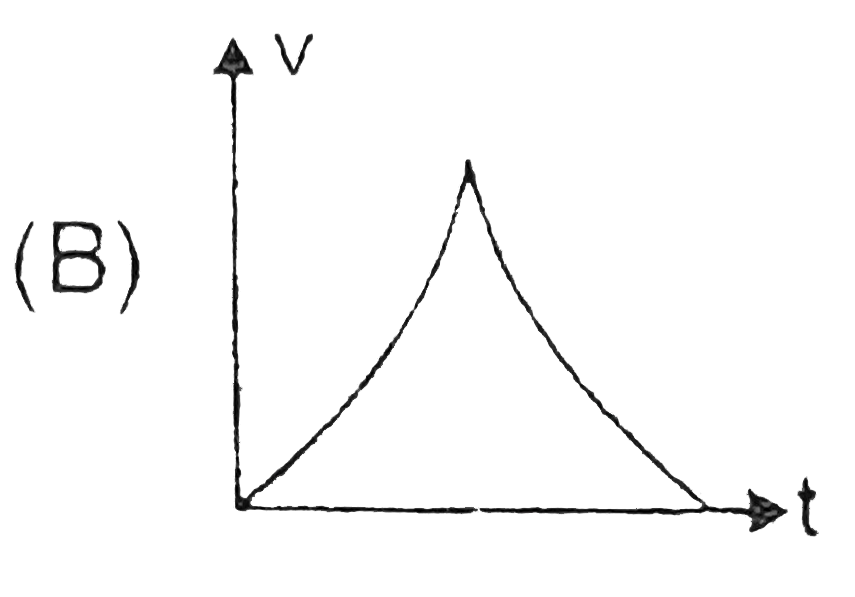
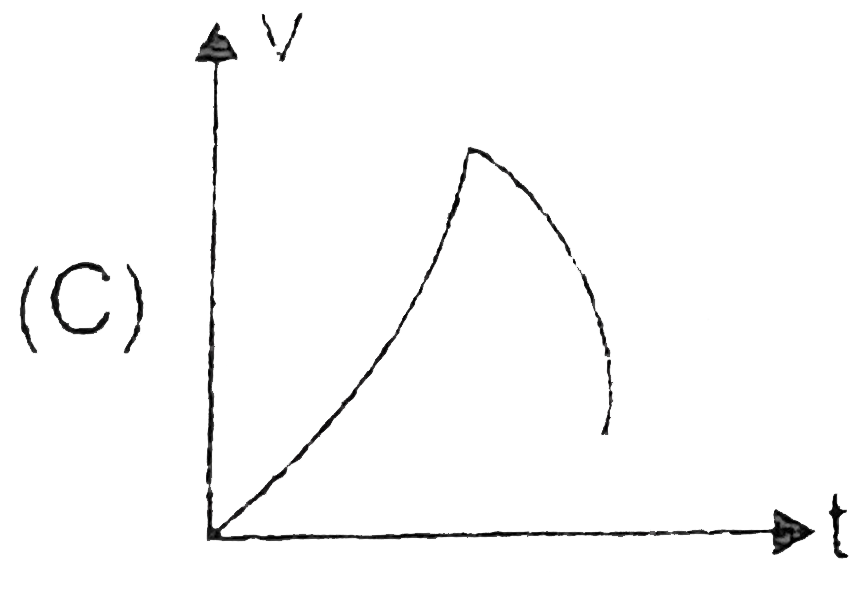
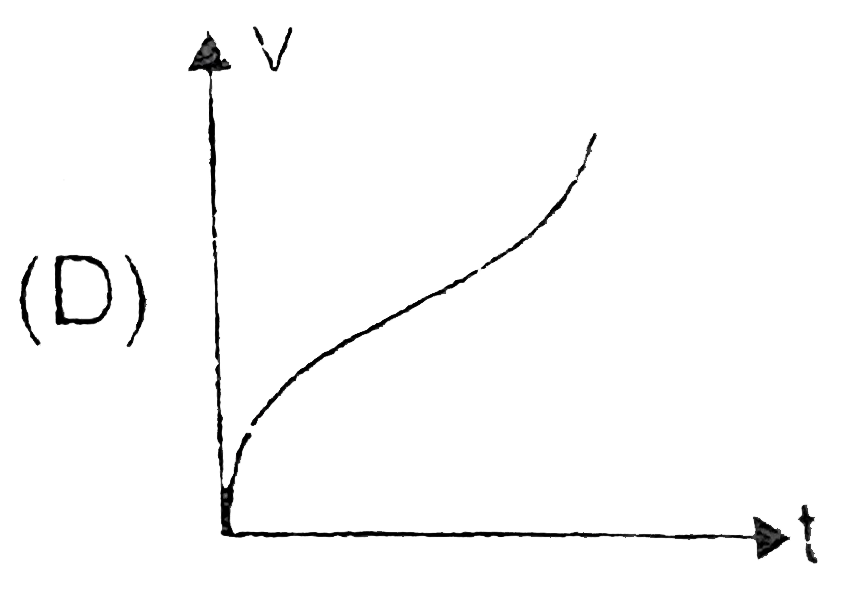
The correct Answer is:A
Step by step video & image solution for The force acting on a particle moving along a straight line varies with time as shown in diagram. Which of the following graphs is best representative of its speed and time graphs. Initial velocity the particle is zero. by Physics experts to help you in doubts & scoring excellent marks in Class 12 exams.
Updated on:21/07/2023Topper's Solved these Questions
- DAILY PRACTICE PROBLEMBOOK - RESONANCE ENGLISHCHAPTER - DAILY PRACTICE PROBLEMEXERCISE - DPP No.30
9 Videos
- DAILY PRACTICE PROBLEMBOOK - RESONANCE ENGLISHCHAPTER - DAILY PRACTICE PROBLEMEXERCISE - DPP No.31
20 Videos
- DAILY PRACTICE PROBLEMBOOK - RESONANCE ENGLISHCHAPTER - DAILY PRACTICE PROBLEMEXERCISE - DPP No.28
9 Videos
- CURRENT ELECTRICITYBOOK - RESONANCE ENGLISHCHAPTER - CURRENT ELECTRICITYEXERCISE - High Level Problems (HIP)
19 Videos
- ELECTRO MAGNETIC WAVESBOOK - RESONANCE ENGLISHCHAPTER - ELECTRO MAGNETIC WAVESEXERCISE - Exercise 3
27 Videos
Similar Questions
The net force acting on a particle moving along a straight line varies with time as shown in the diagram. Force is parallel to velocity. Which of the following graph is best representative of its speed with time? (Initial velocity of the particle is zero)
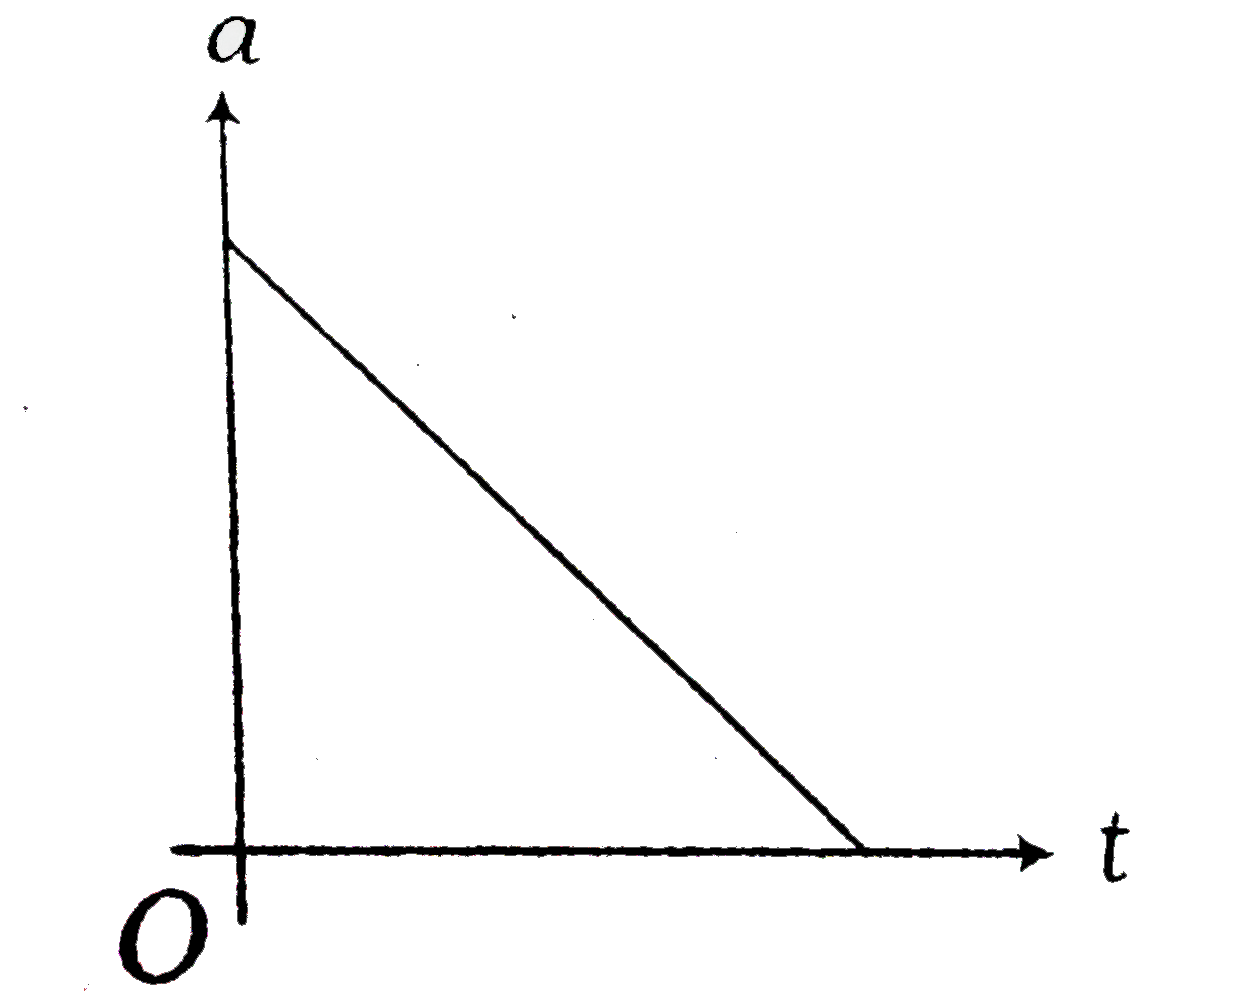
View SolutionThe acceleration (a)-time(t) graph for a particle moving along a straight from rest is shown in figur. Which of the following graph is the best representation of its velocity (v) with time (t) ?
View SolutionDisplacement time graph of a particle moving in a straight line is a shown in figure.

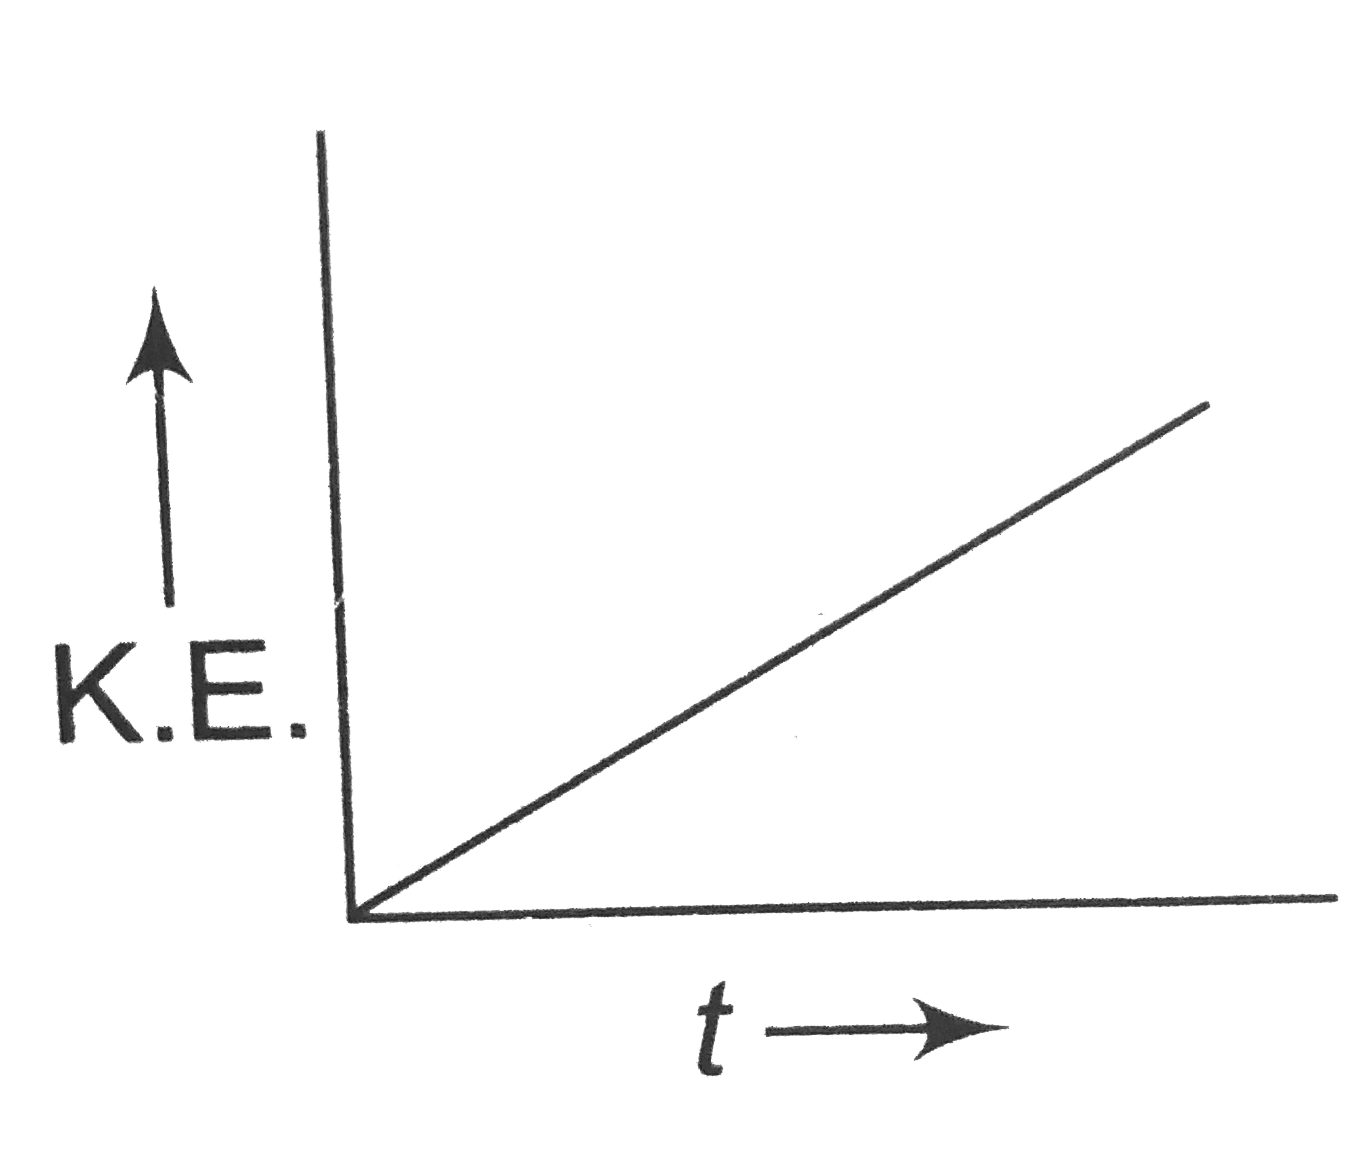
View SolutionThe kinetic energy of a body moving along a straight line varies with time as shown in figure. The force acting on the body:
View SolutionThe acceleration (a)-time(t) graph for a particle moving along a straight from rest is shown in figure. Which of the following graph is the best representation of its velocity (v) with time (t) ?

View SolutionVelocity displacement graph of a particle moving in a straight line is as shown in figure.

View SolutionThe speed-time graph of a particle moving along a fixed direction is shown in Fig. Then which of the following is wrong?

View SolutionA particle moving along straight line has velocity v=μs where s is in the displacement . If s=s0 then which of the following graph best represent s versus t
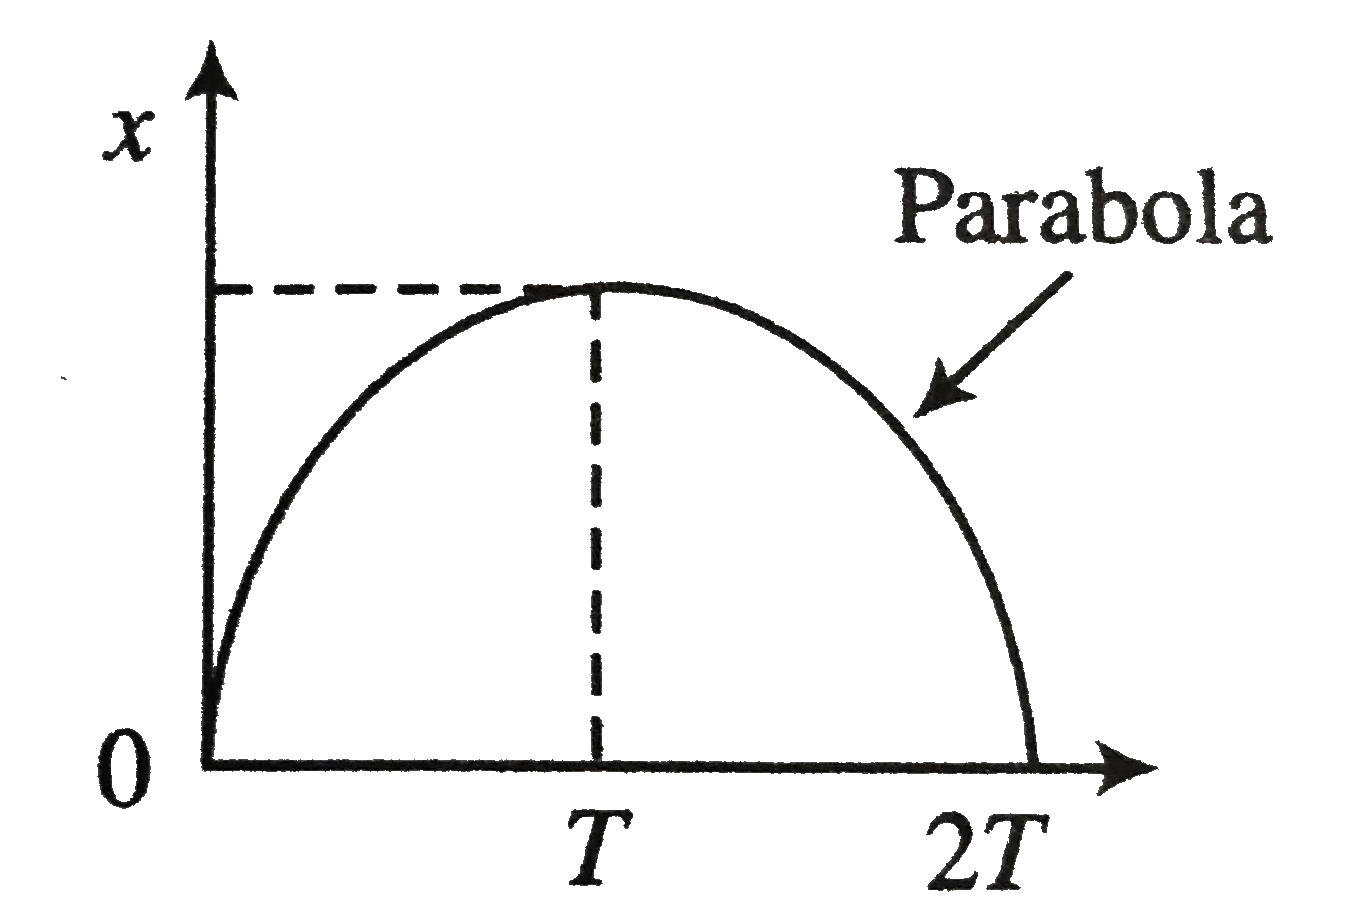
View SolutionThe x-t graph of a particle moving along a straight line is shown in figure

The v-t graph of the particle is correctly shown by
View SolutionThe x-t graph of a particle moving along a straight line is shown in figure
The a-t graph of the particle is correctly shown by
View Solution
