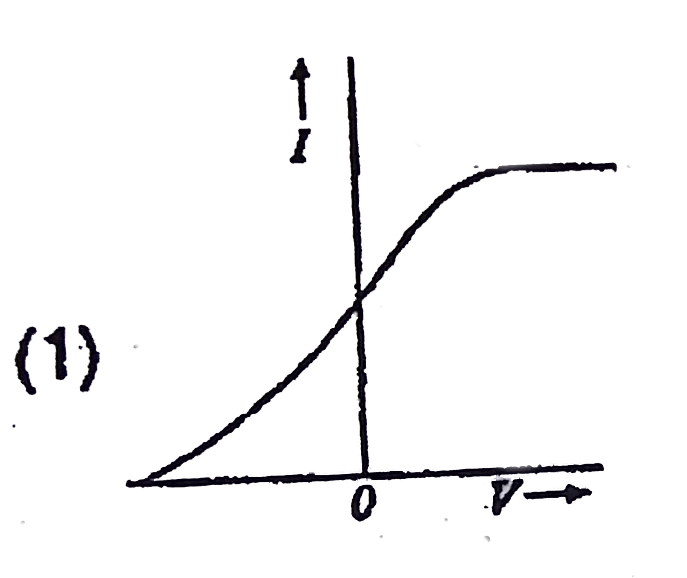
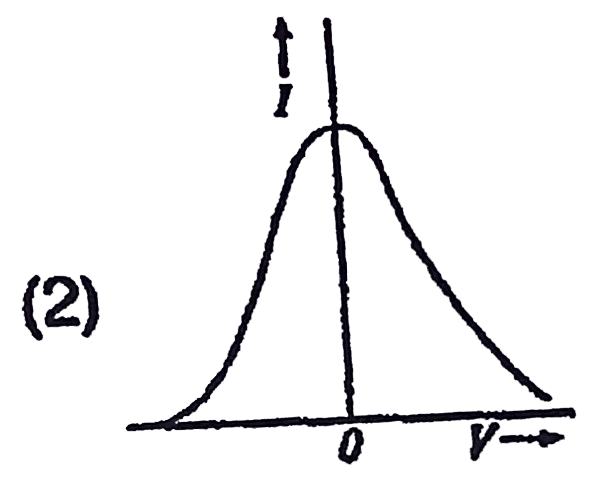
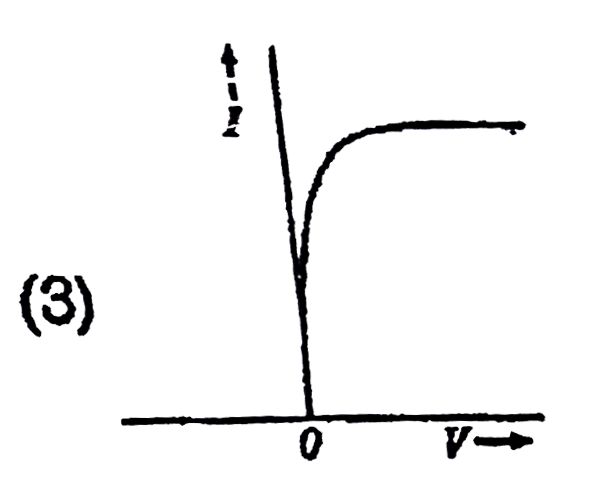
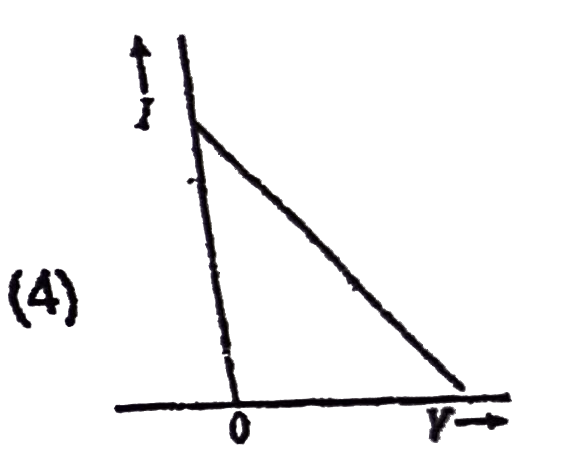
Which one of the following graphs in figure shows the variation of photoelectric current (I) with voltage (V) between the electrodes in a photoelectric cell?
A
B
C
D
Video Solution
Text Solution
The correct Answer is:A
Kinetic energy of an electron is given by
k=12mv2=eV= same for both electron
Where V= Speed of electron
Linear momentum of two electron may be different, in direction but their magnitude i.e. mv=√2mk
will be same. De-broglie wavelength is given by
λ=hmv =same for both electrons
Minimum wavelength of produced x-rays is given by
λmin=hceV same for both electrons
|
Topper's Solved these Questions
Similar Questions
Knowledge Check
Which of the following is the graph showing stress-strain variation for elastomers ?
A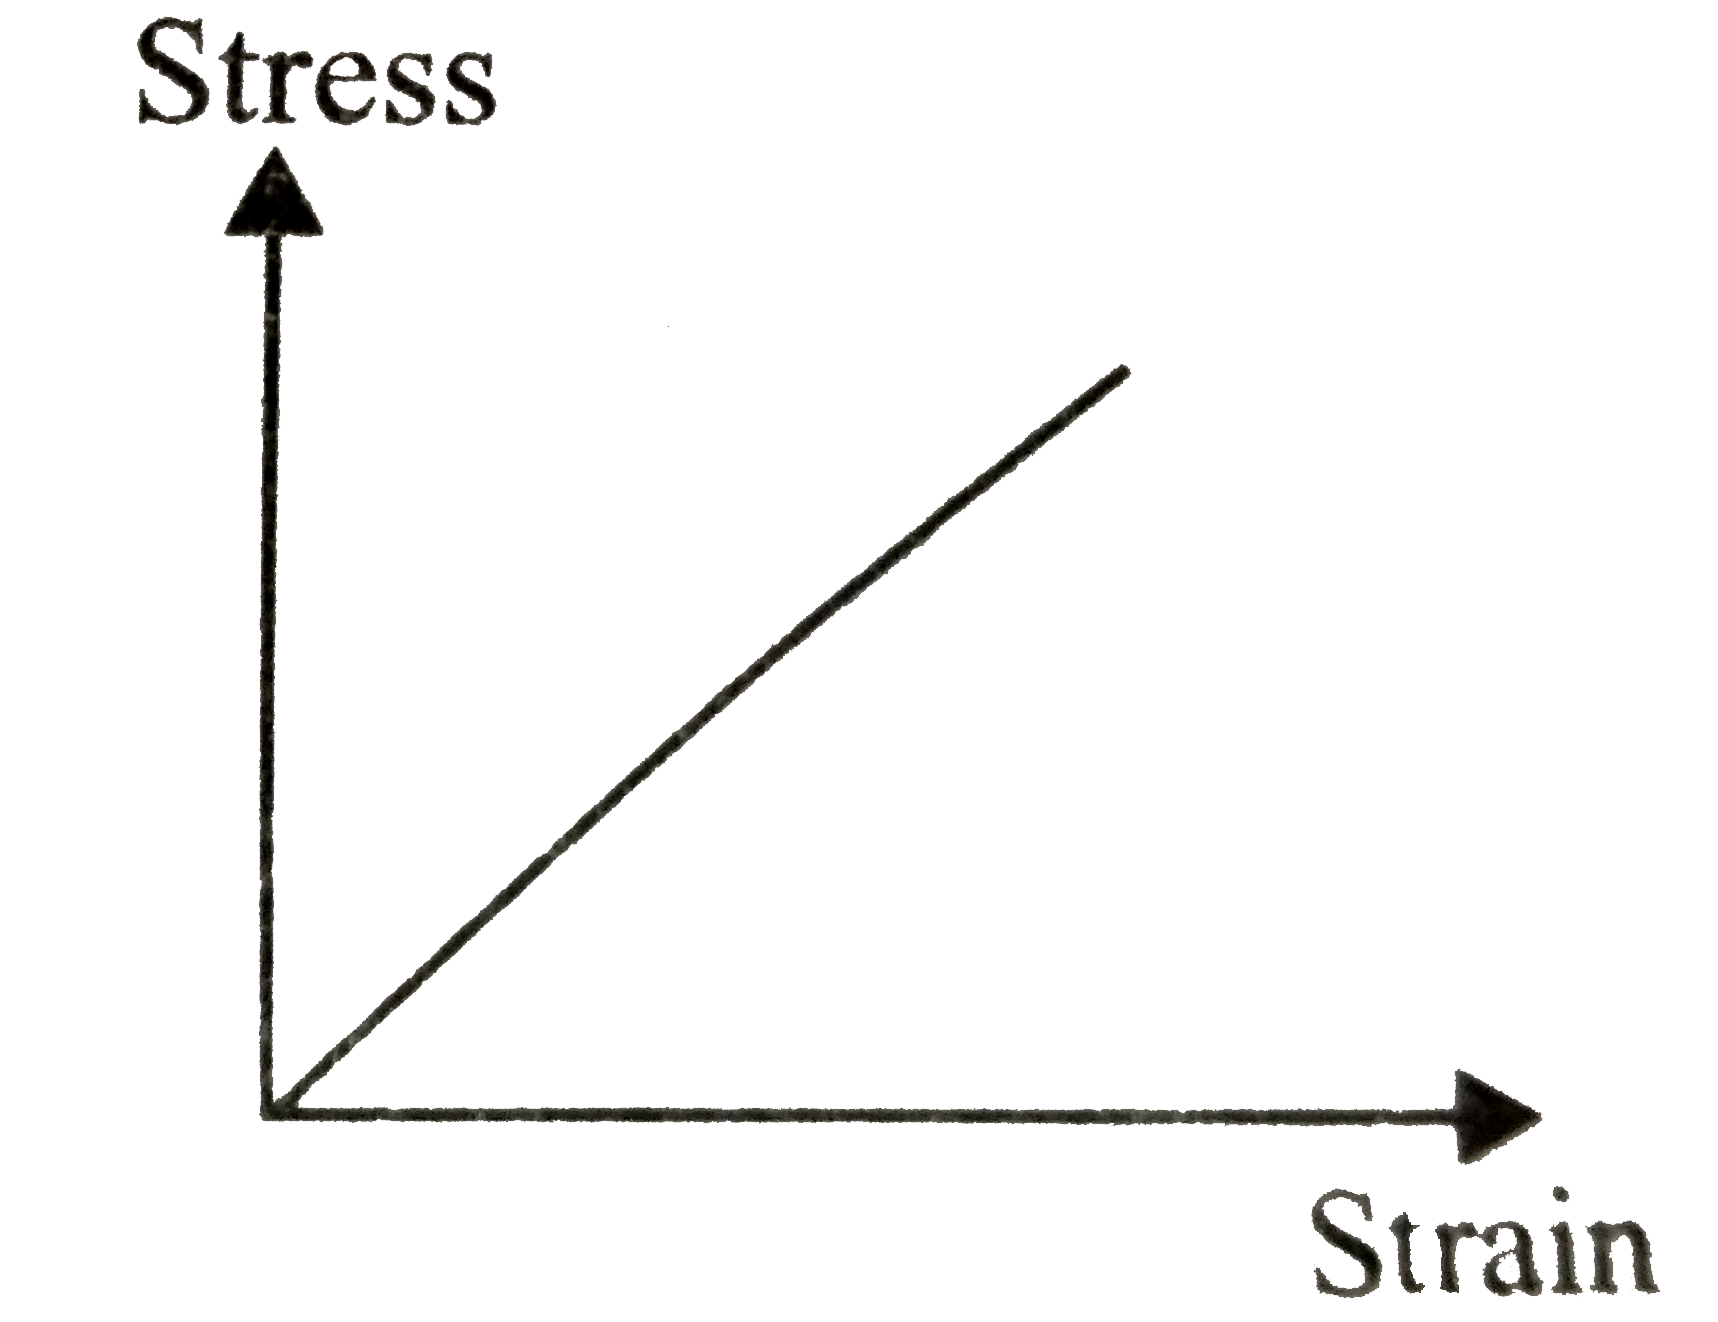 B
B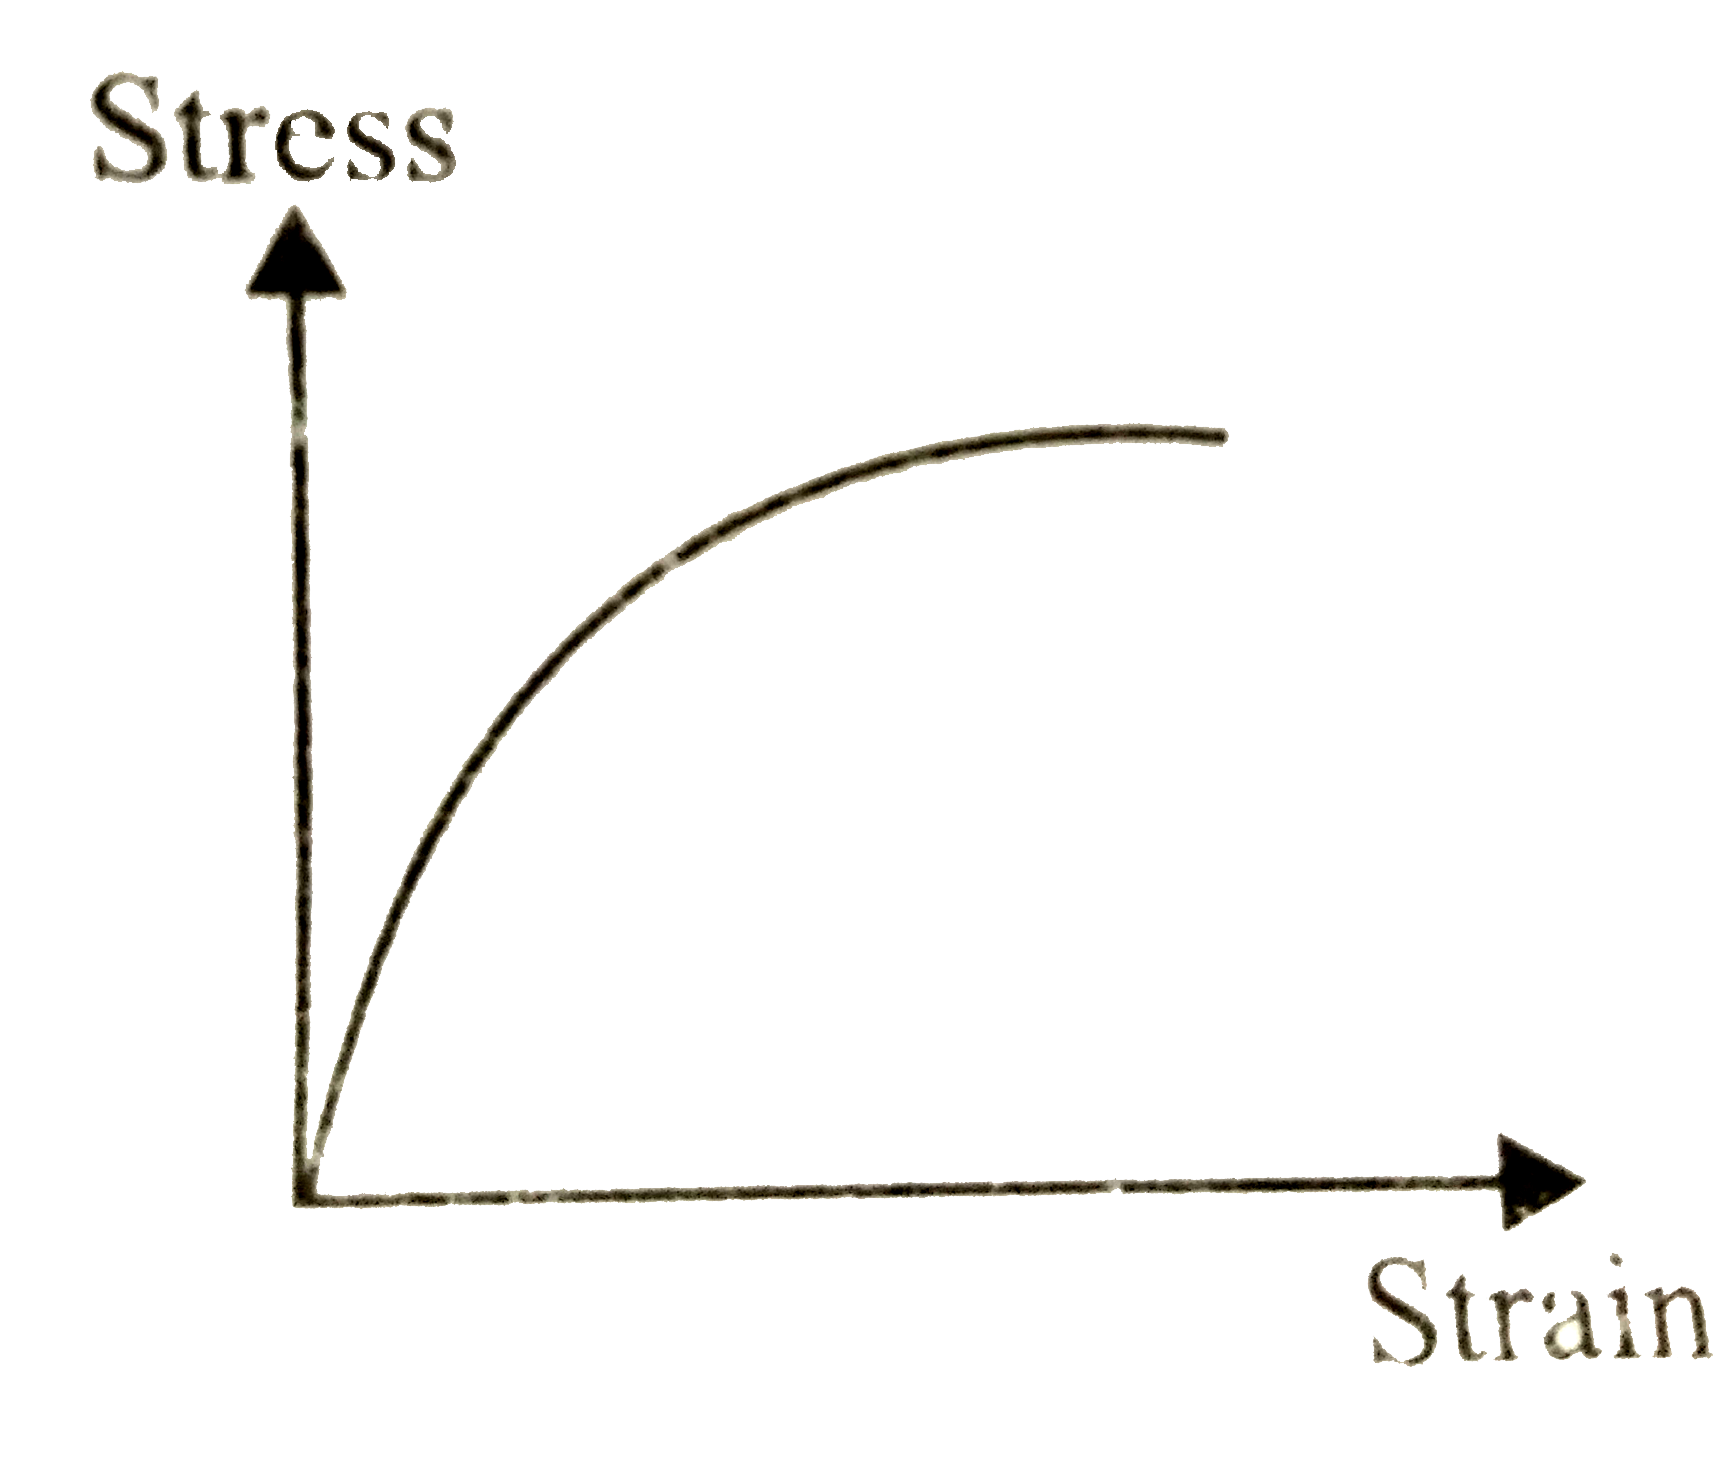 C
C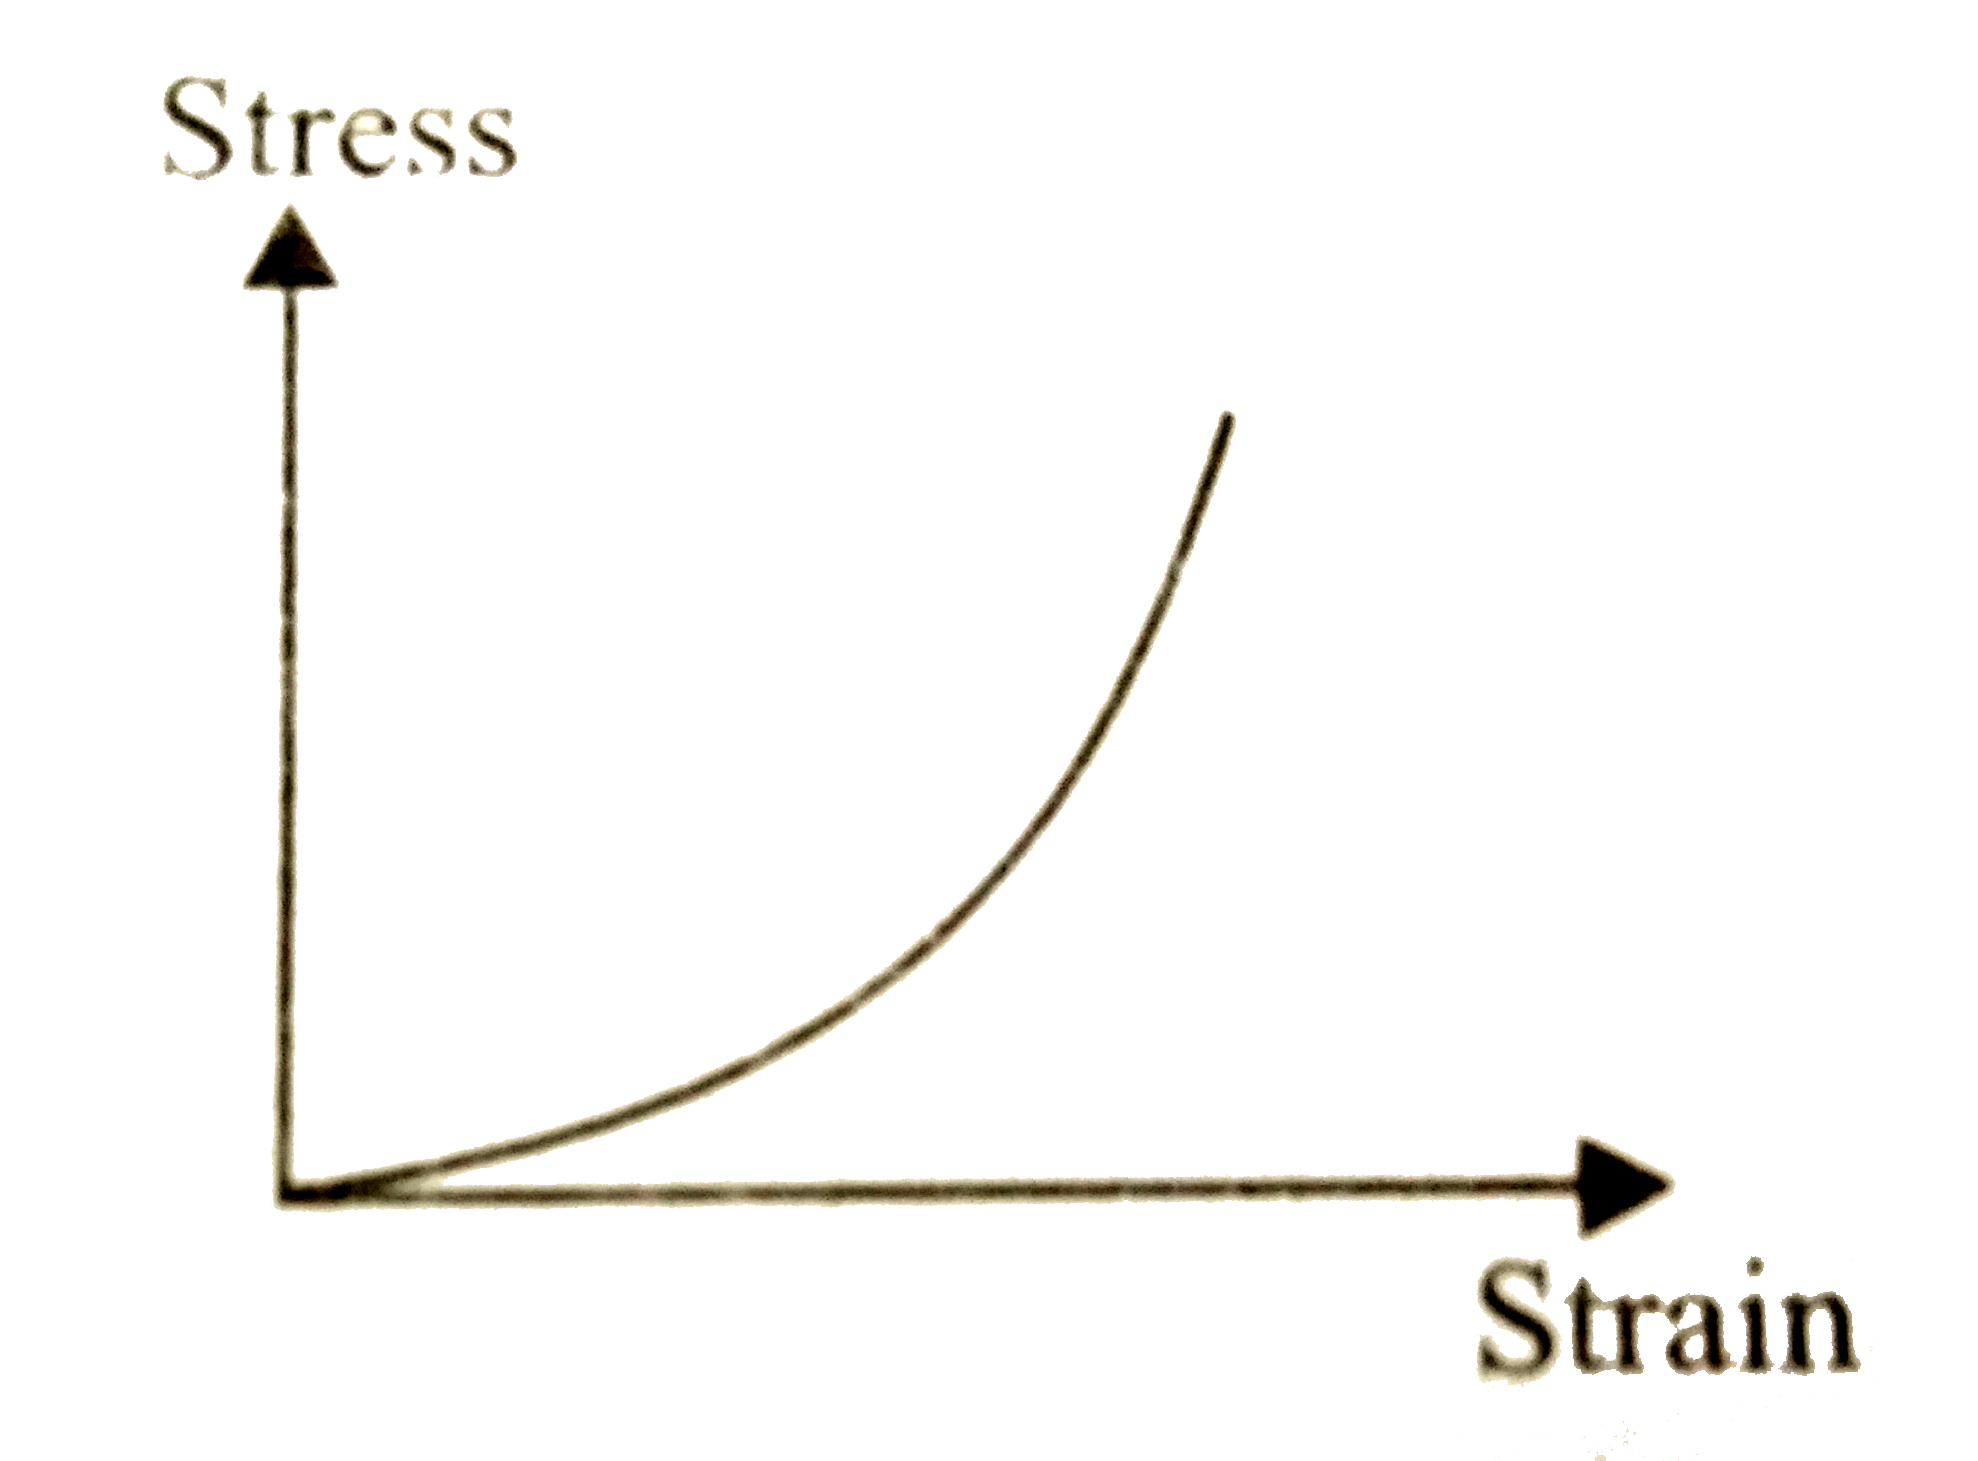 D
D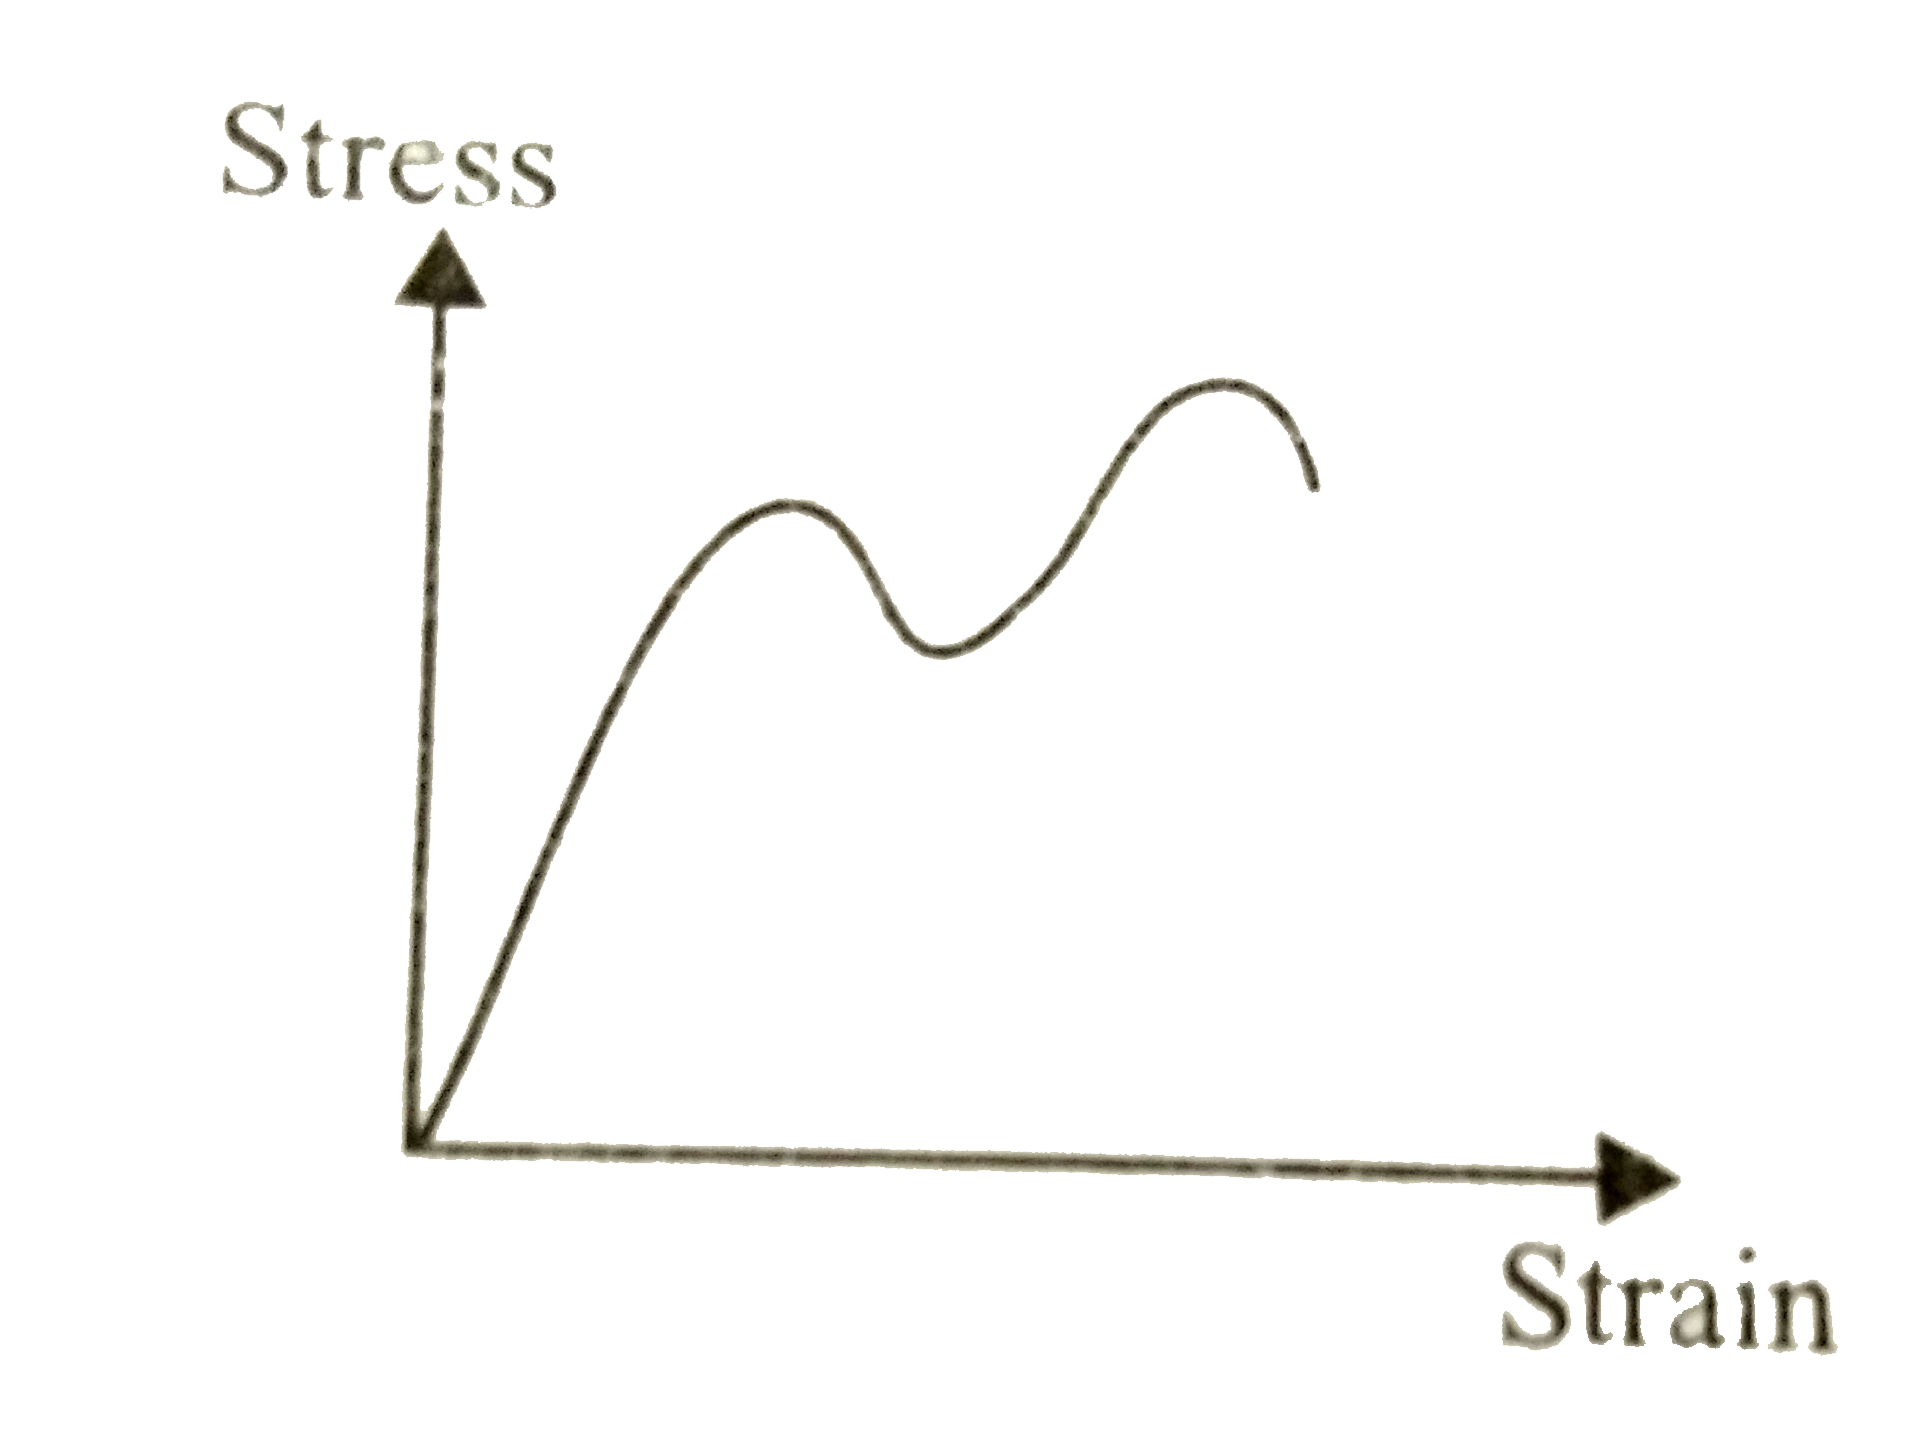
Which of the following statements is correct regarding the photoelectric experiment ?
AThe photocurrent increases with intensity of light.BStopping potential increases with increase in intensity of incident light.CThe photocurrent increases with increase in frequency.DAll of these
Which of the following statement is(are) true in the context of photoelectric effect
View SolutionThe following graph shows the variation of photoelectric current for a photosensitive metal .
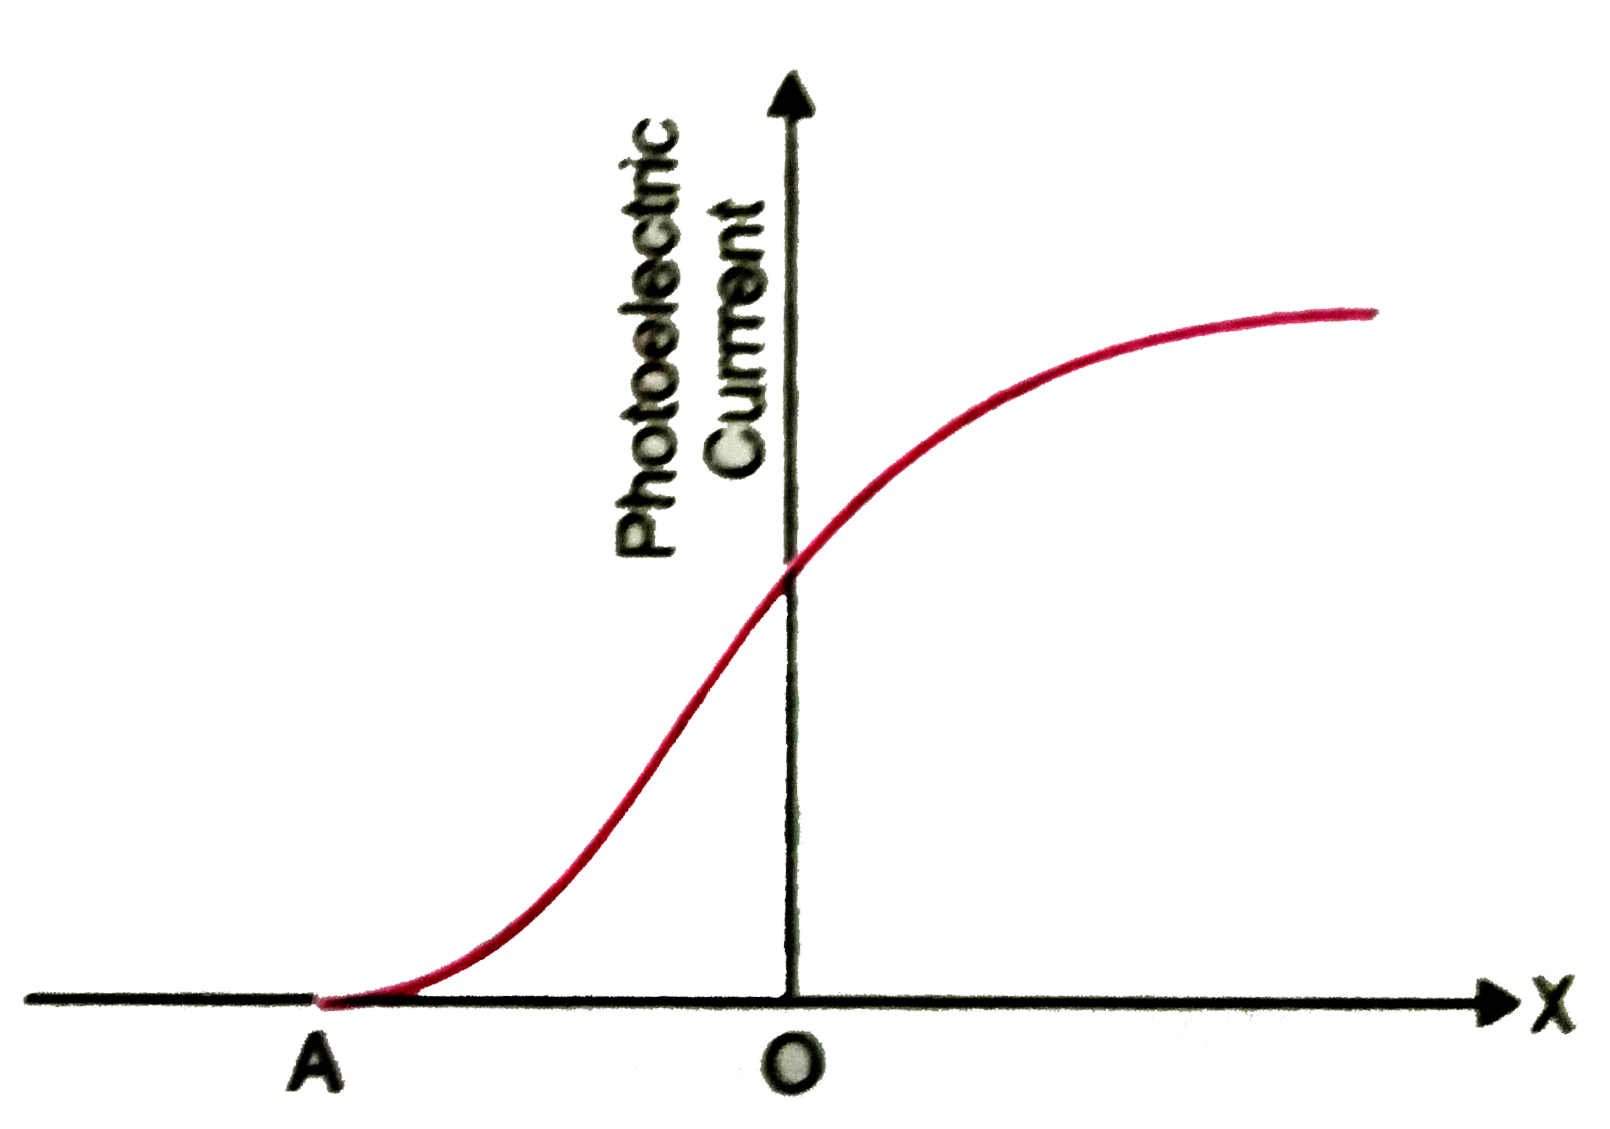
Identify the variable X on the horizontal line.
View SolutionA point source of light is used in an experiment on photoelectric effect . Which of the following curves best represents the variation of photo current (i) with distance (d) of the source from the emitter ?

View SolutionWhich one of the following is true in photoelectric emission
View SolutionWhich one of the following graphs shows the variation of magnetic induction B which distance r from a long wire carrying a current ?
View SolutionWhy caesium and potassium are used as electrodes in photoelectric cells ?
View Solution
