Which one of the following graphs shows the variation of magnetic induction B which distance r from a long wire carrying a current ?


The correct Answer is:D
To solve the problem of determining which graph shows the variation of magnetic induction B with distance r from a long wire carrying a current, we can follow these steps:
Step 1: Understand the relationship between magnetic induction and distance
The magnetic induction B around a long straight current-carrying wire is given by the formula:
B=μ0I2πr
where:
- B is the magnetic induction,
- μ0 is the permeability of free space,
- I is the current through the wire,
- r is the distance from the wire.
Step 2: Analyze the formula
From the formula, we can see that B is inversely proportional to r. This means that as the distance r from the wire increases, the magnetic induction B decreases.
Step 3: Determine the nature of the graph
Since B decreases as r increases, the graph of B versus r will show a hyperbolic decay. Specifically, it will start at a maximum value when r is very small and will approach zero as r becomes very large.
Step 4: Identify the correct graph
Among the options provided, we need to look for a graph that shows:
- A decreasing curve,
- Approaching zero as r increases,
- Not crossing the axis (since B cannot be negative).
Conclusion
Based on the analysis, the correct option that represents the variation of magnetic induction B with distance r from a long wire carrying a current is Option C.
---
The magnetic induction B around a long straight current-carrying wire is given by the formula:
B=μ0I2πr
where:
- B is the magnetic induction,
- μ0 is the permeability of free space,
- I is the current through the wire,
- r is the distance from the wire.
From the formula, we can see that B is inversely proportional to r. This means that as the distance r from the wire increases, the magnetic induction B decreases.
Since B decreases as r increases, the graph of B versus r will show a hyperbolic decay. Specifically, it will start at a maximum value when r is very small and will approach zero as r becomes very large.
Among the options provided, we need to look for a graph that shows:
- A decreasing curve,
- Approaching zero as r increases,
- Not crossing the axis (since B cannot be negative).
Based on the analysis, the correct option that represents the variation of magnetic induction B with distance r from a long wire carrying a current is Option C.
Topper's Solved these Questions
- MAGNETIC EFFECTS OF CURRENT Book:VMC MODULES ENGLISHChapter:MAGNETIC EFFECTS OF CURRENT Exercise:LEVEL 2
Explore 50 Videos
- MAGNETIC EFFECTS OF CURRENT Book:VMC MODULES ENGLISHChapter:MAGNETIC EFFECTS OF CURRENT Exercise:JEE Main (Archive)
Explore 75 Videos
- MAGNETIC EFFECTS OF CURRENT Book:VMC MODULES ENGLISHChapter:MAGNETIC EFFECTS OF CURRENT Exercise:LEVEL 0 (LONG ANSWER TYPE )
Explore 3 Videos
- LIQUIDSBook:VMC MODULES ENGLISHChapter:LIQUIDSExercise:JEE ADVANCED (LEVEL -2)
Explore 55 Videos
- MOCK TEST 1Book:VMC MODULES ENGLISHChapter:MOCK TEST 1Exercise:PART I : PHYSICS (SECTION-2)
Explore 10 Videos
Similar Questions
Which of the following figure shown the magnetic flux denstiy b at a distance r from a long straight rod carrying a steady current I ?
View SolutionWhich one of the following graphs represents the variation of electric field with distance r from the centre of a charged spherical conductor of radius R?
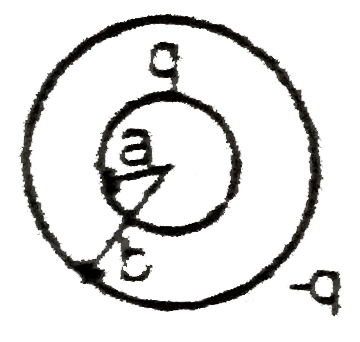
View SolutionFigure shows two concentric shells of radii a and b uniformly distributed charges q and -q. Which of the following graphs gives correct variation of electric field intensity E with the distance r from the centre?

View SolutionThe magnetic induction at the point O, if the wire carries a current I, is

View SolutionMagnetic field at a distance a from long current carrying wire is proportional to
View SolutionWhich one of the following graphs in figure shows the variation of photoelectric current (I) with voltage (V) between the electrodes in a photoelectric cell?
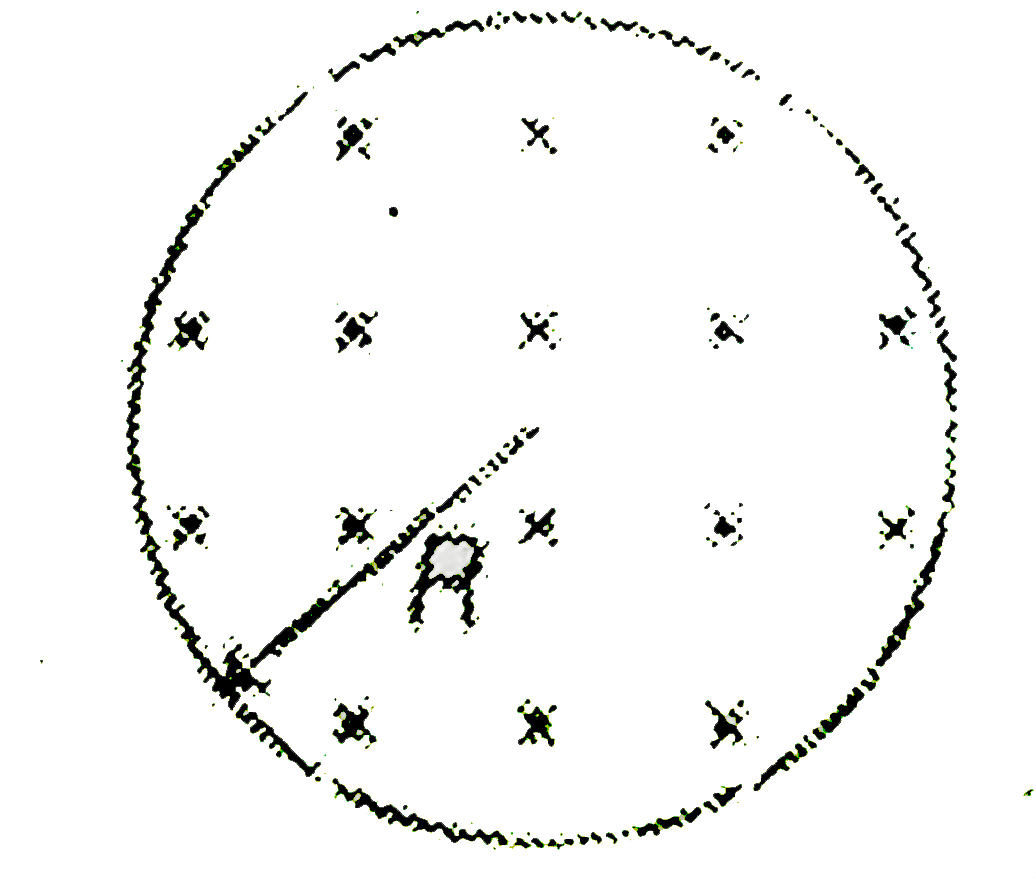
View SolutionA cylindrical space of radius R is filled with a uniform magnetic induction parallel to the axis of the cylinder. If B charges at a constant rate, the graph showin the variation of induced electric field with distance r from the axis of cylinder is

View Solution(i) A very long wire carrying a current I is bent at right angles .Find magnetic field at a point lying on a perpendicular to the wire , drawn through the point of bending at a distance d from it
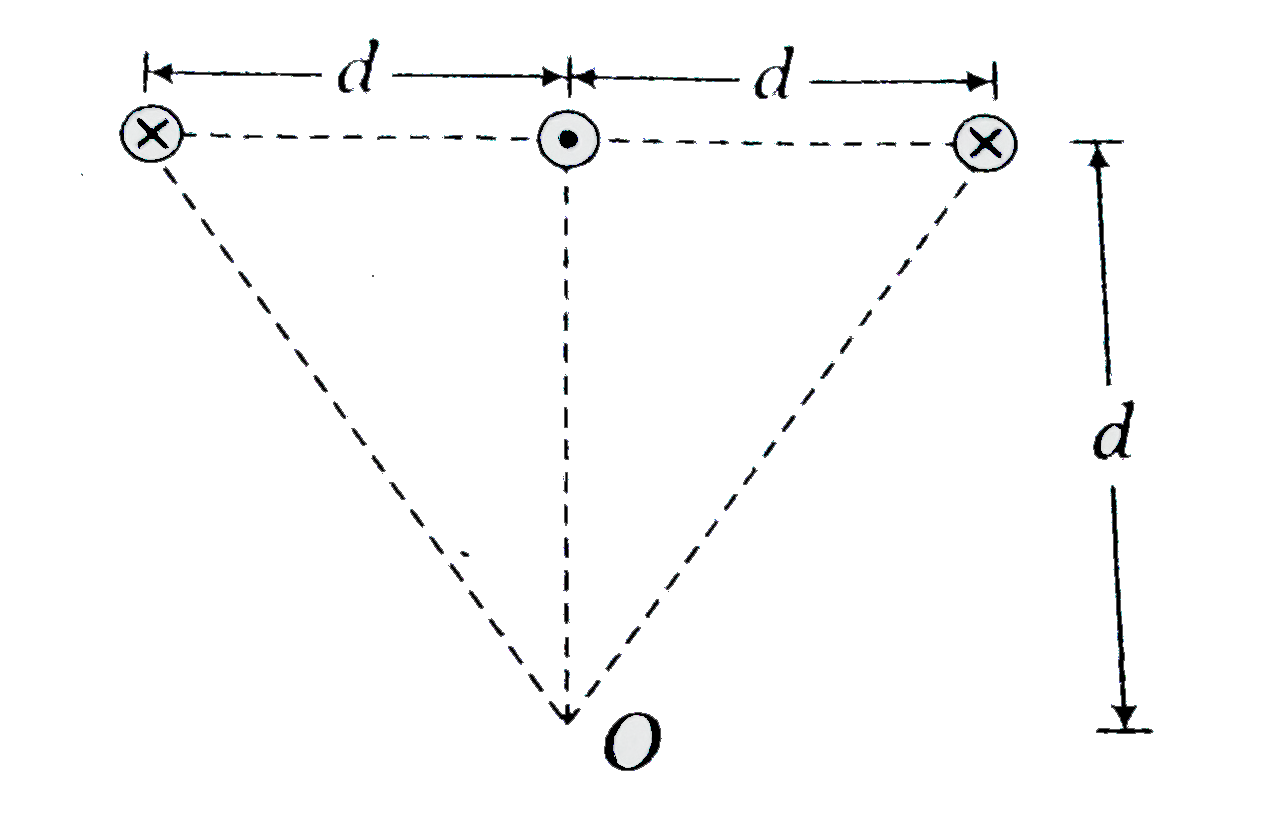
(ii) Three long wires carrying same currect are placed as shown Find magnetic field at O.

View SolutionA thin wire of length l is carrying a constant current. The wire is bent to form a circular coil. If radius of the coil, thus formed, is equal to R and number of turns in it is equal to n, then which of the following graphs represent (s) variation of magnetic field induction (B) at centre of the coil
View SolutionA thin wire of length l is carrying a constant current. The wire is bent to form a circular coil. If radius of the coil, thus formed, is equal to R and number of turns in it is equal to n, then which of the following graphs represent (s) variation of magnetic field induction (B) at centre of the coil
View Solution
