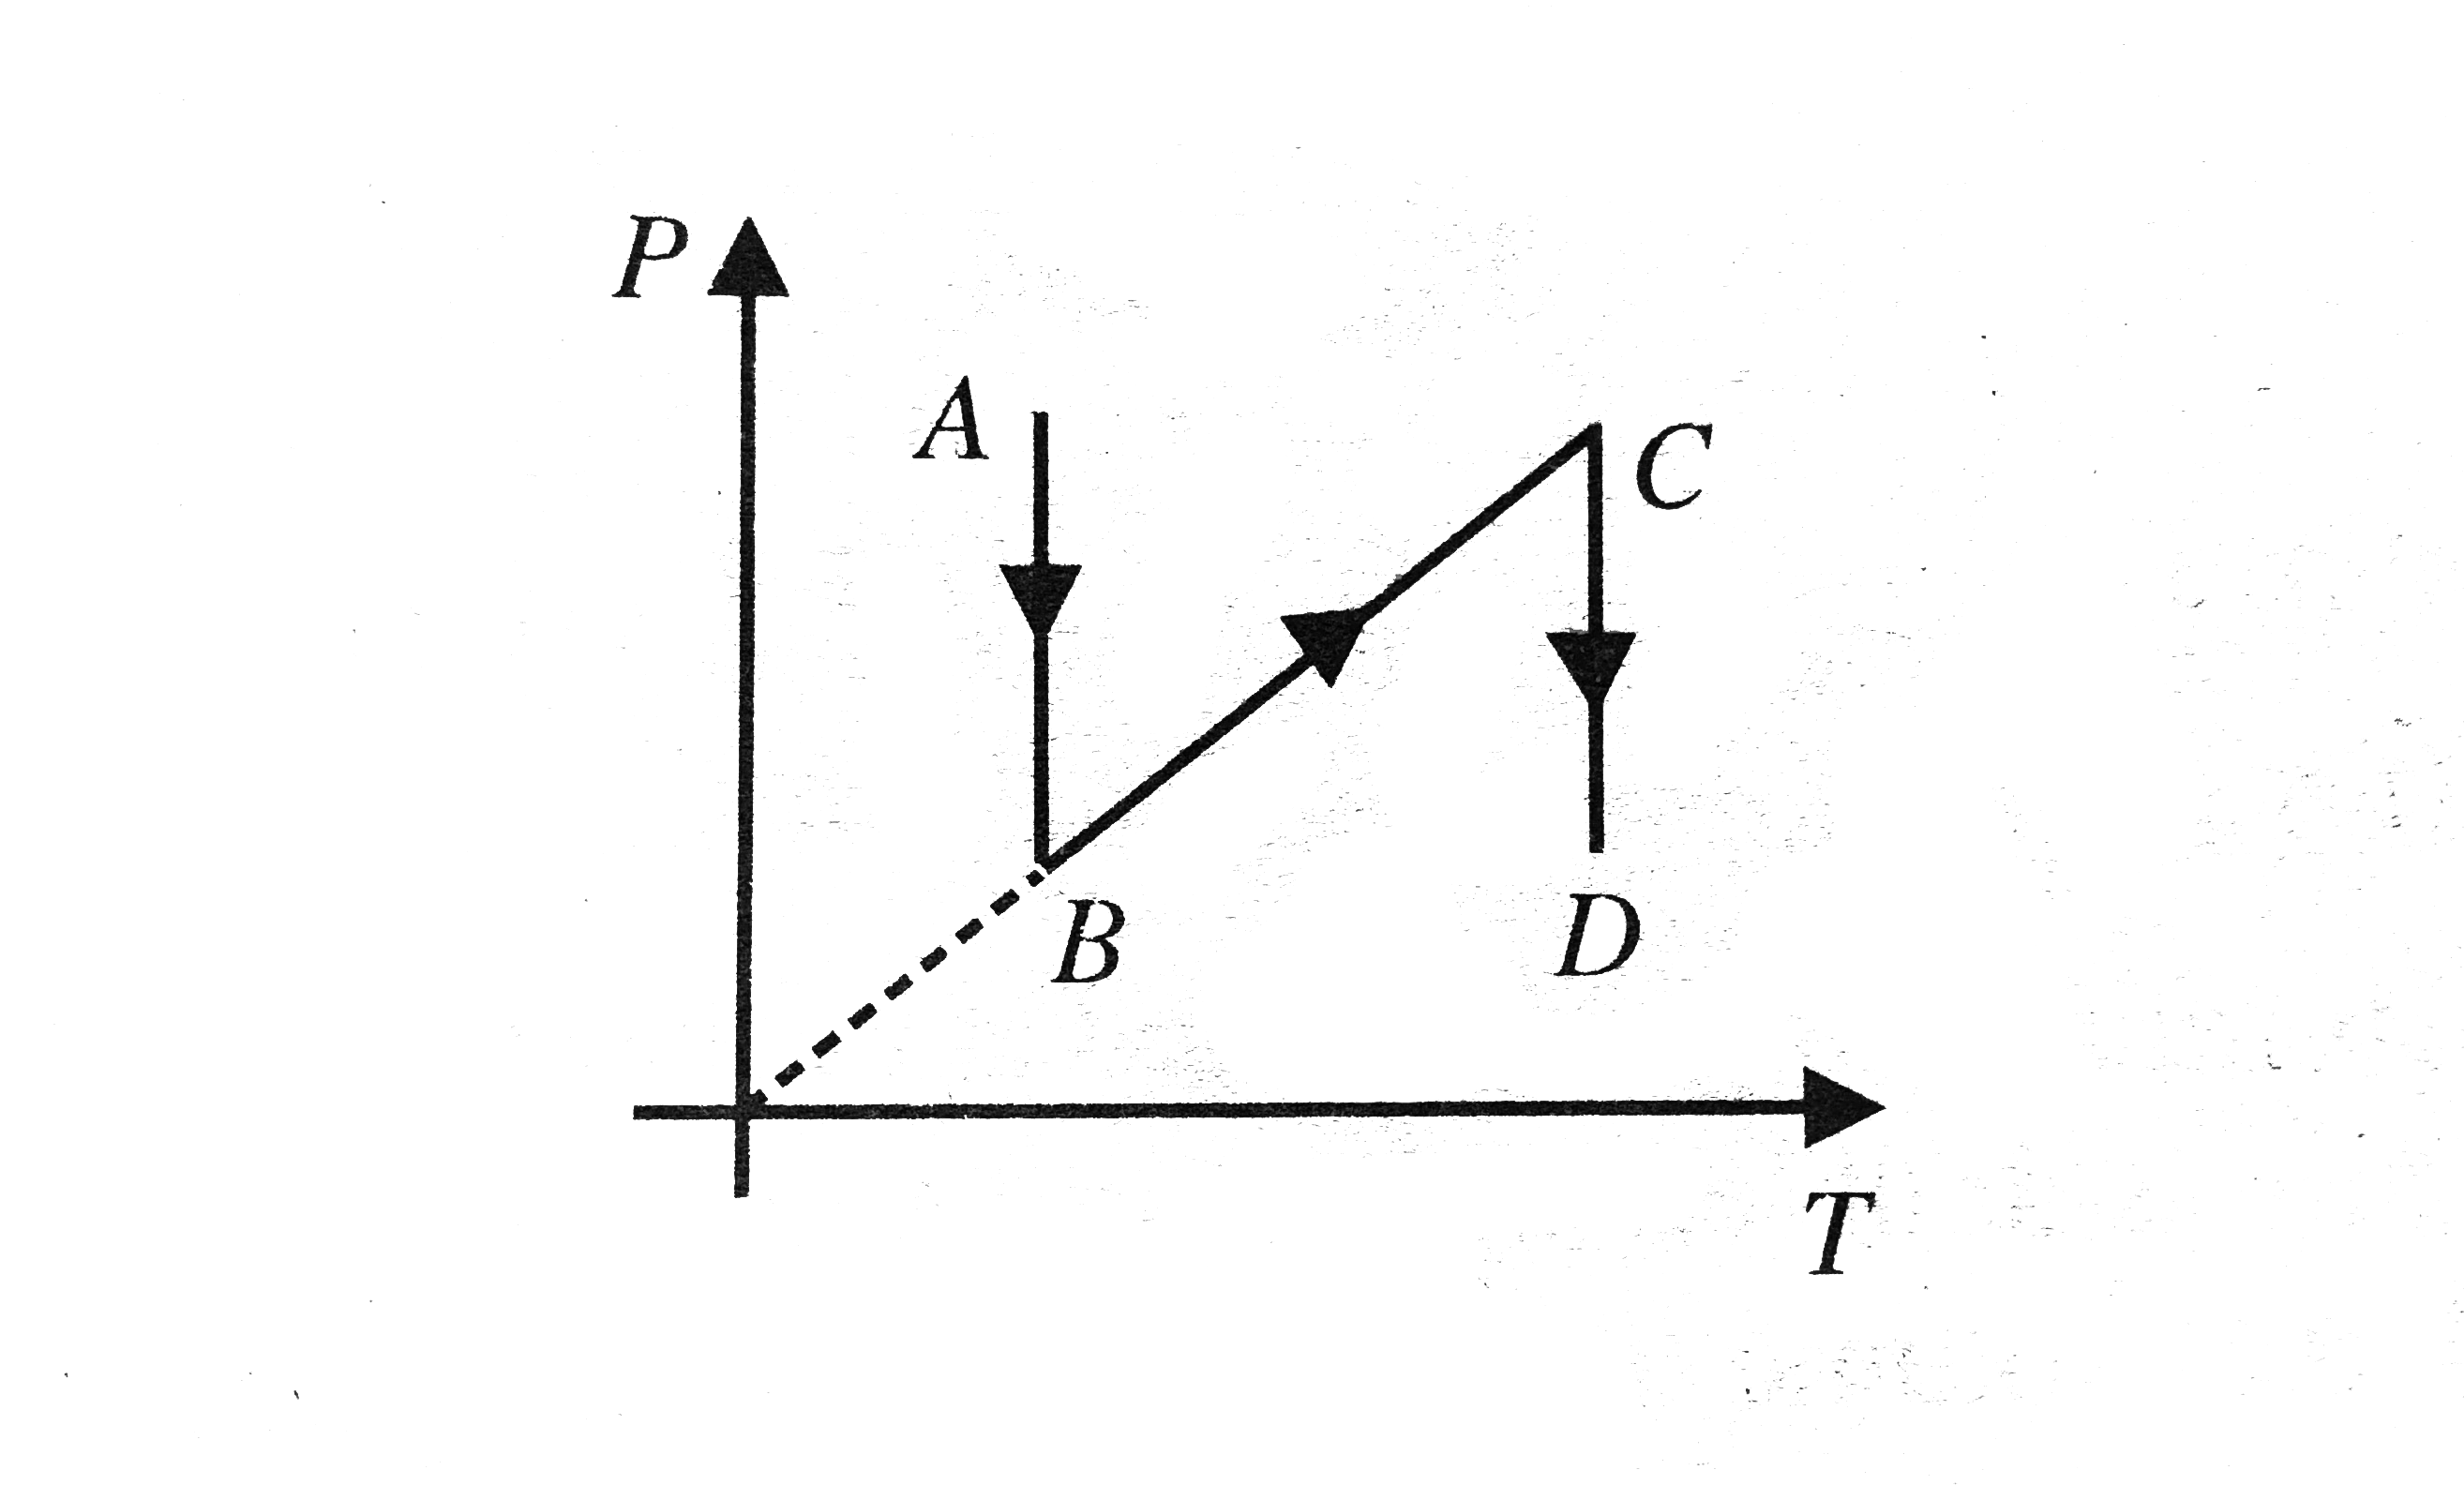
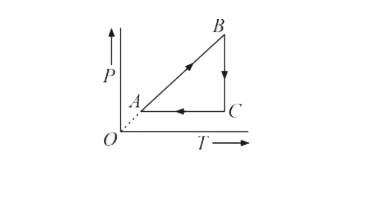
P−T diagram is shown in Fig. Choose the corresponding V−T diagram.
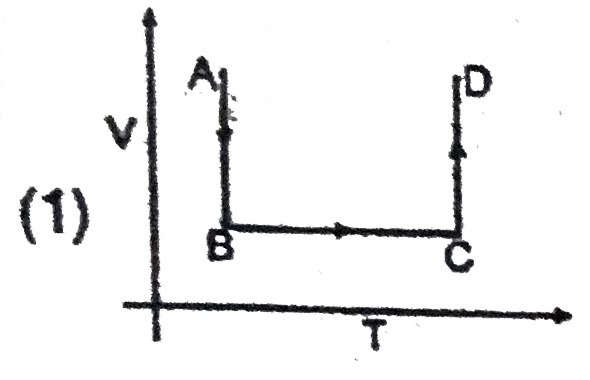
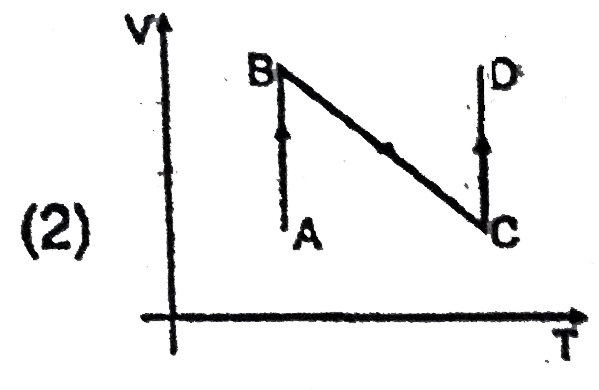
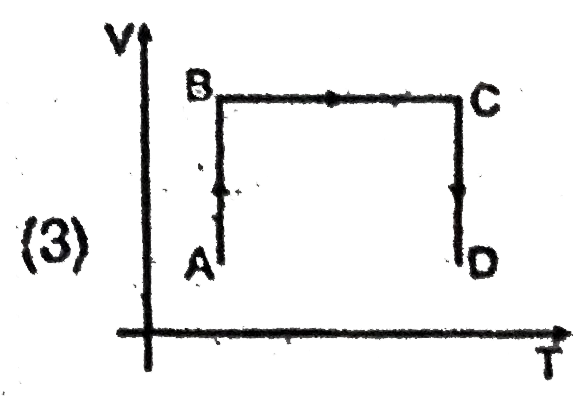
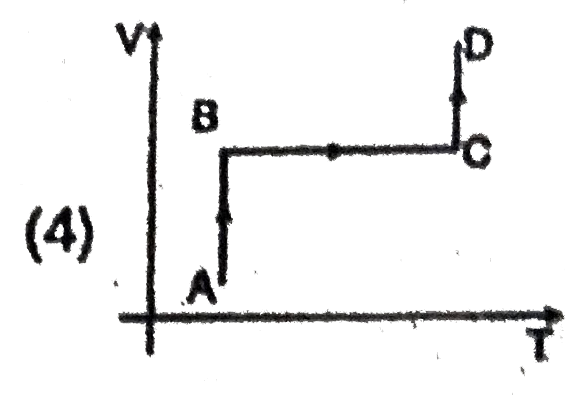
The correct Answer is:D
BC is isochoric VB>VA,VB=VC=VD>VC
Topper's Solved these Questions
Similar Questions
Knowledge Check
Consider p-V diagram for an ideal gas shown in figure.
Out of the following diagrams, which figure represents the T−p diagram ?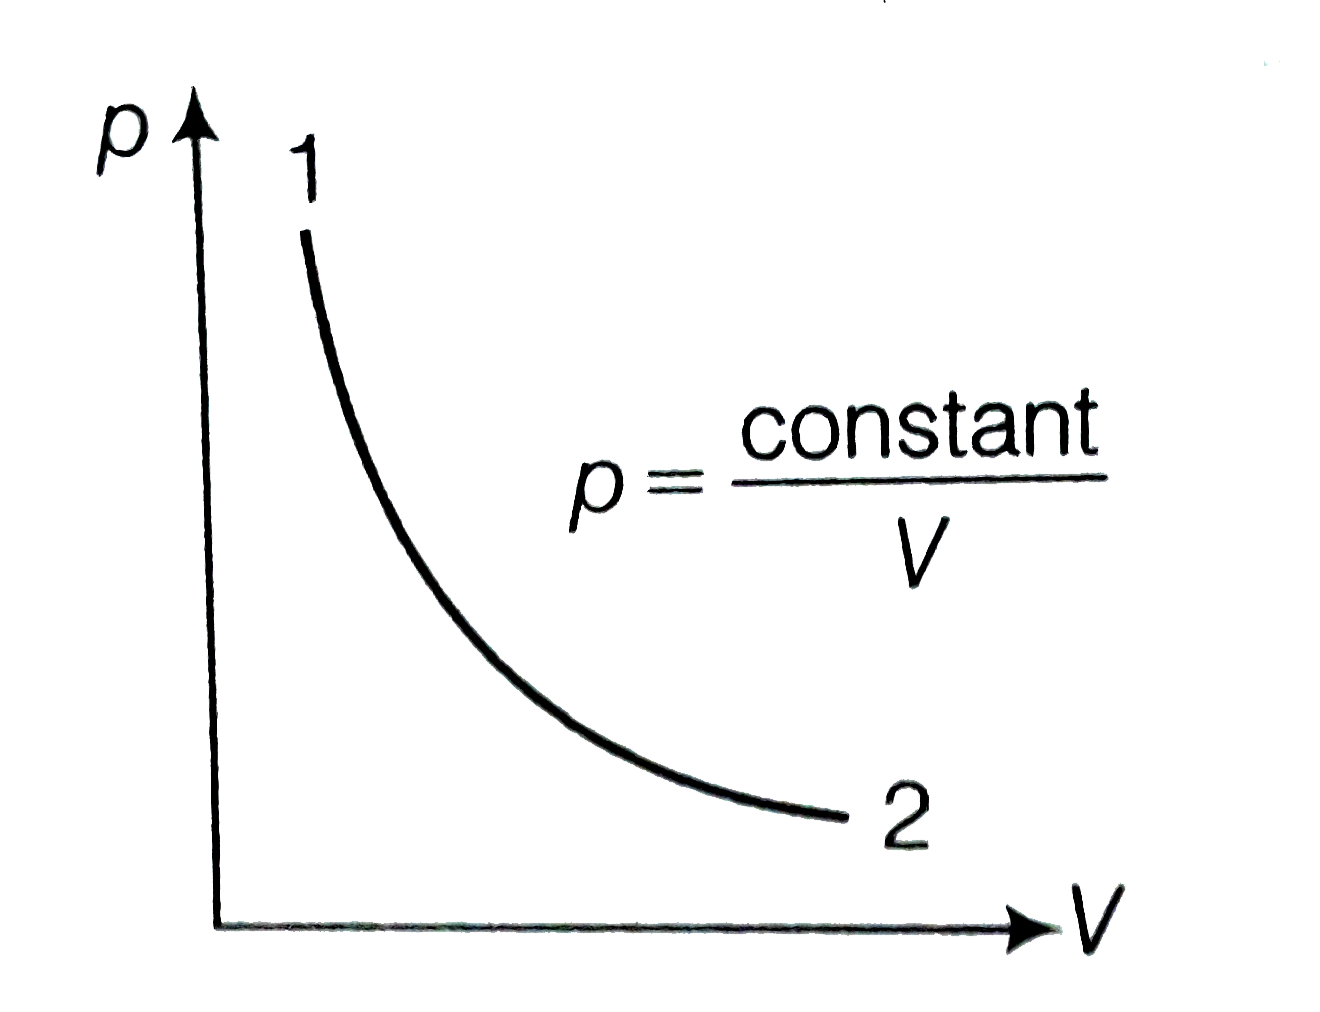
(i)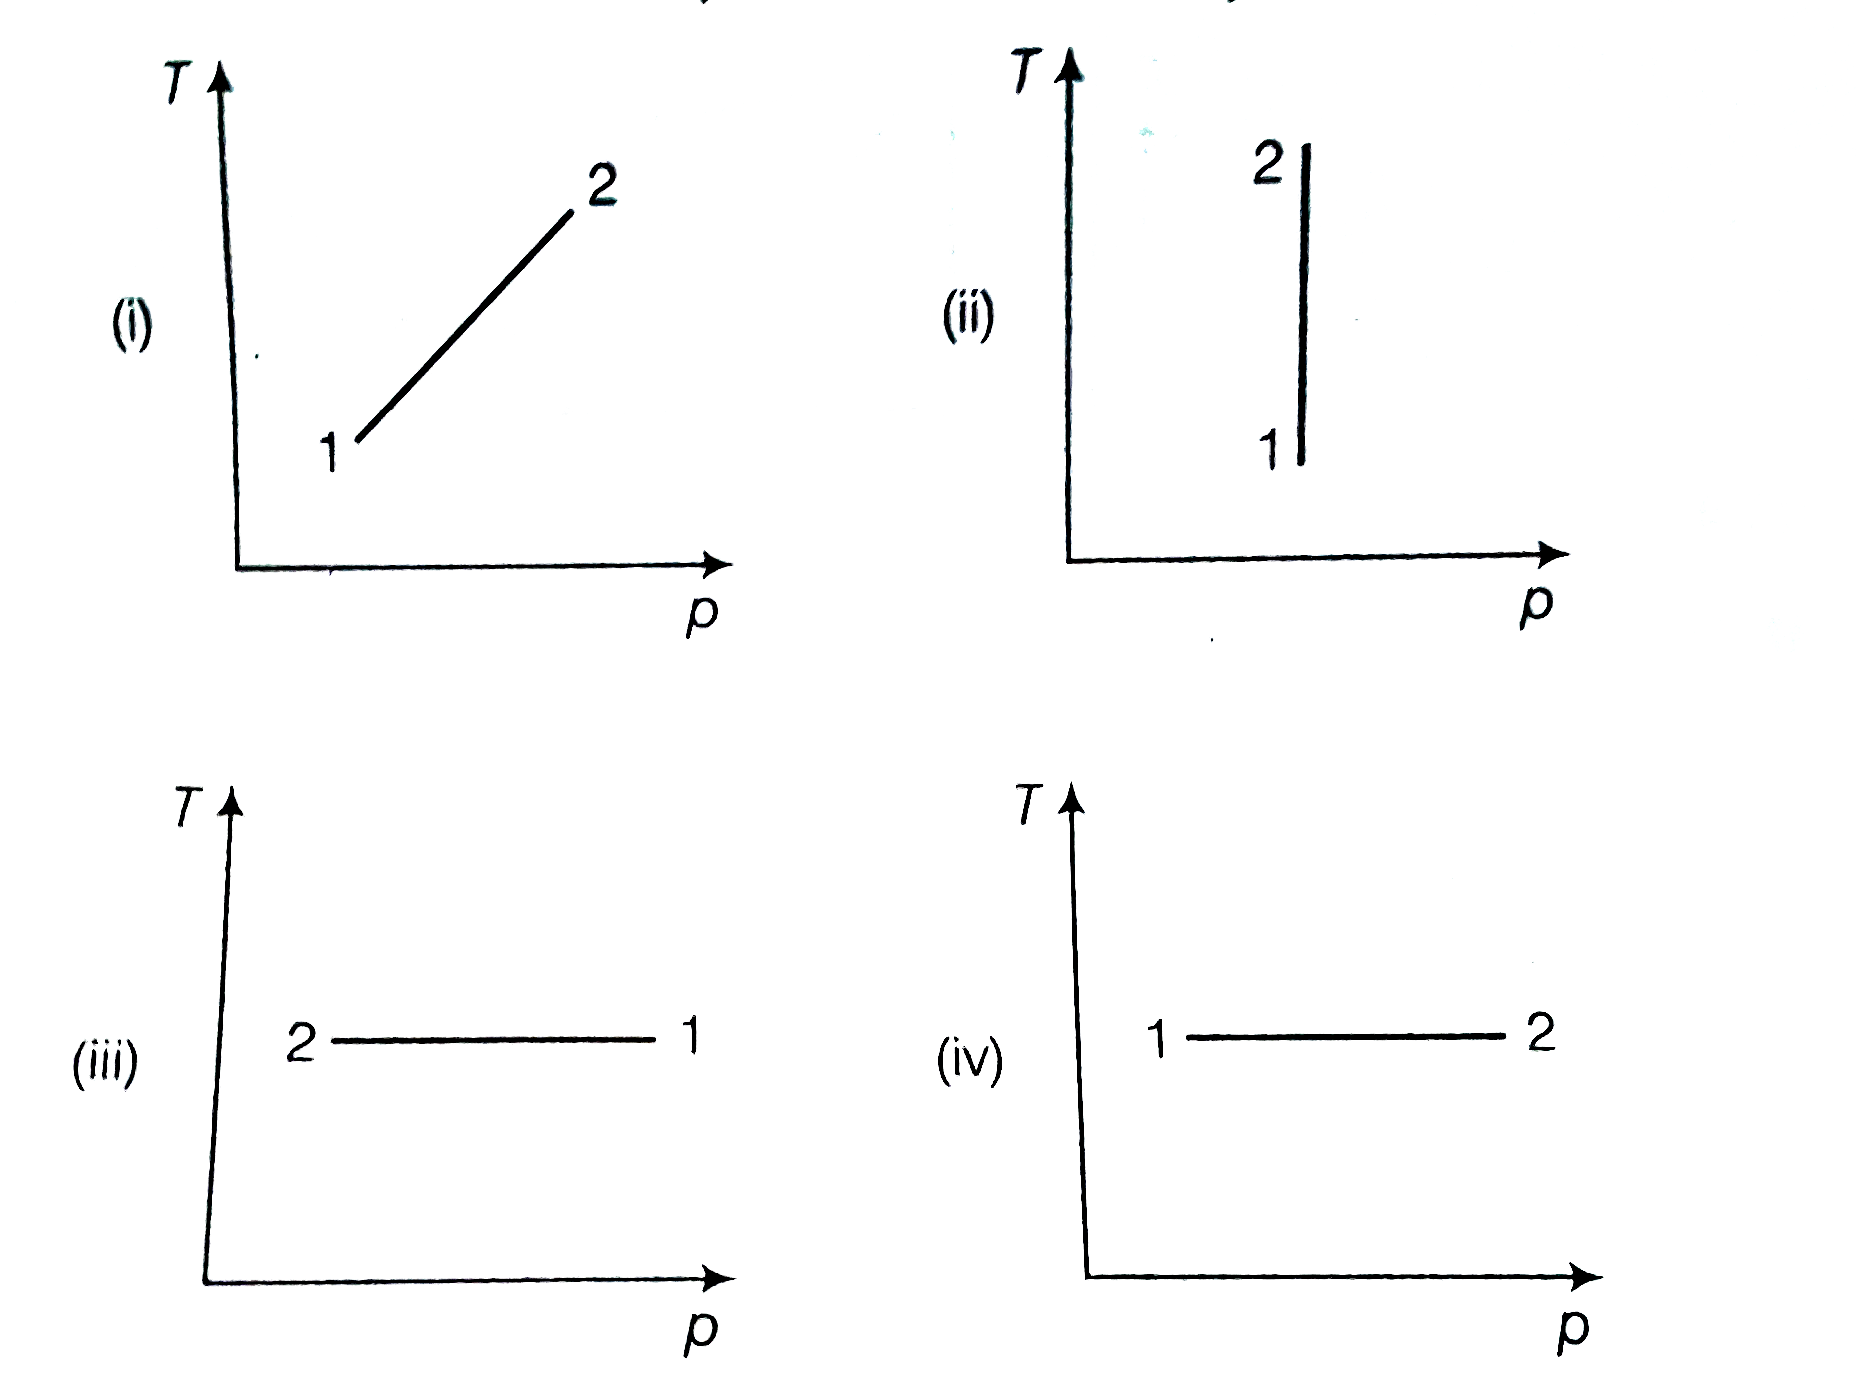 A(iv)B(ii)C(iii)D(i)
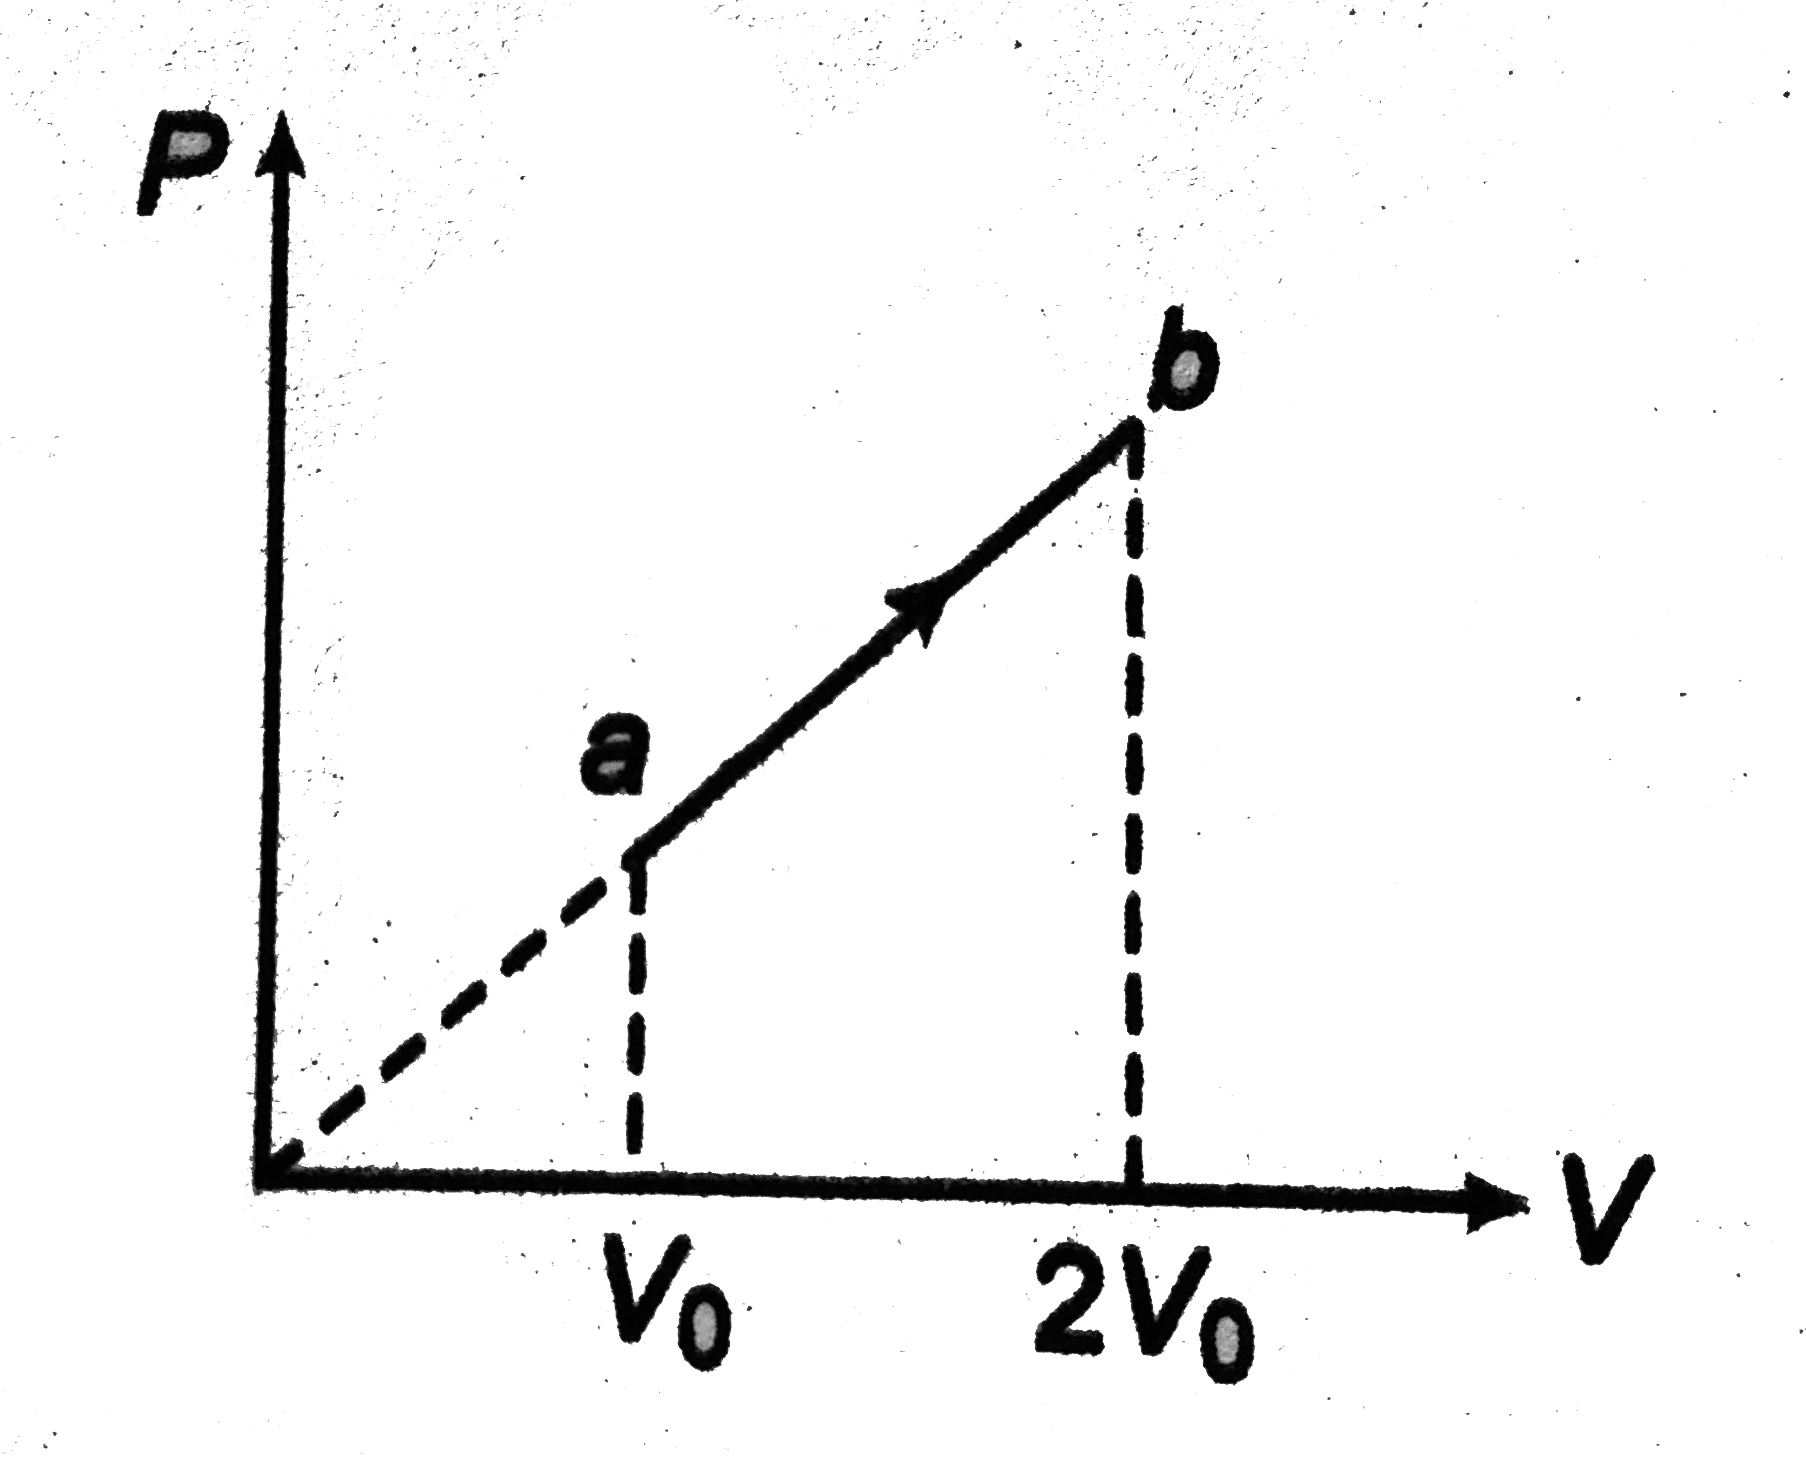
In the (p - V) diagram shown in figure, choose the correct options for the the process (a - b) :
 .
.
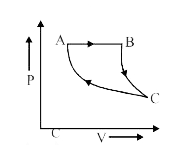
View SolutionP−V diagram of a cyclic process ABCA is as shown in Fig. Choose the correct alternative
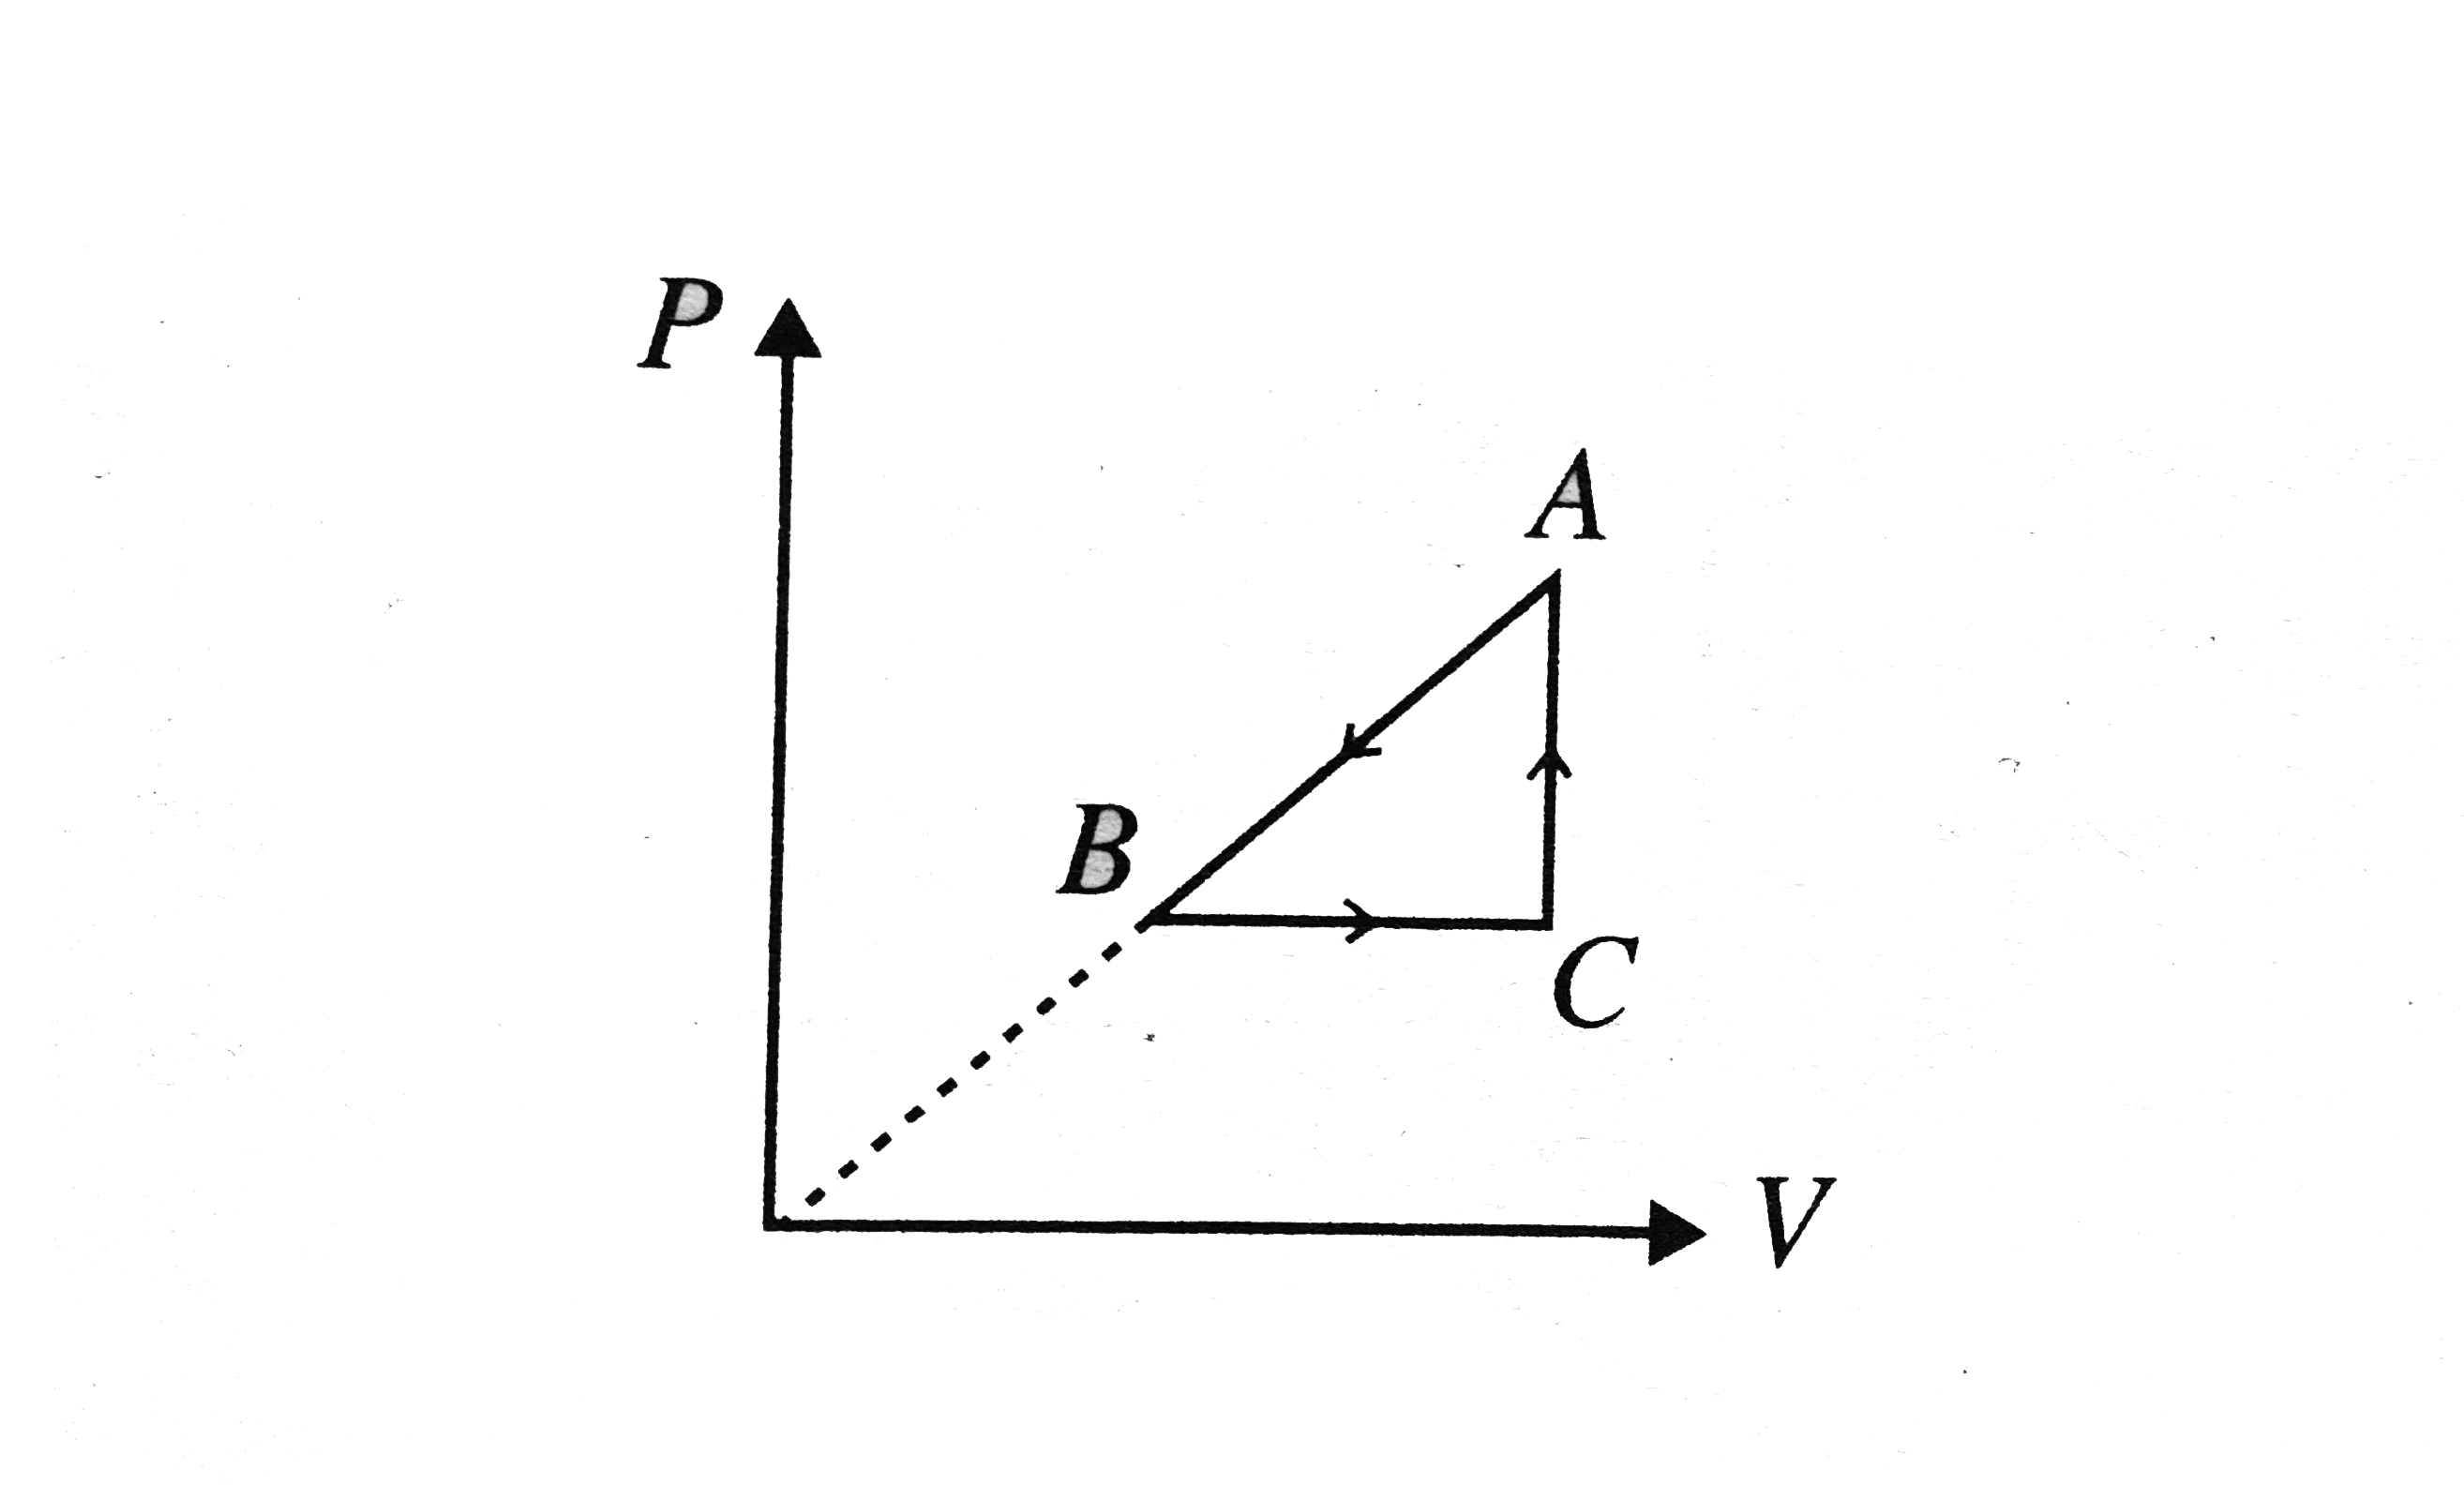
(A)ΔQA→B= negative (B)ΔUB→C= positive (C)ΔUC→A= negative (D)ΔWCAB= negative
View SolutionA cyclie process ABCA is shwon in a V−T diagram. The corresponding P−V diagram is

View SolutionDiagram of Adenovirus
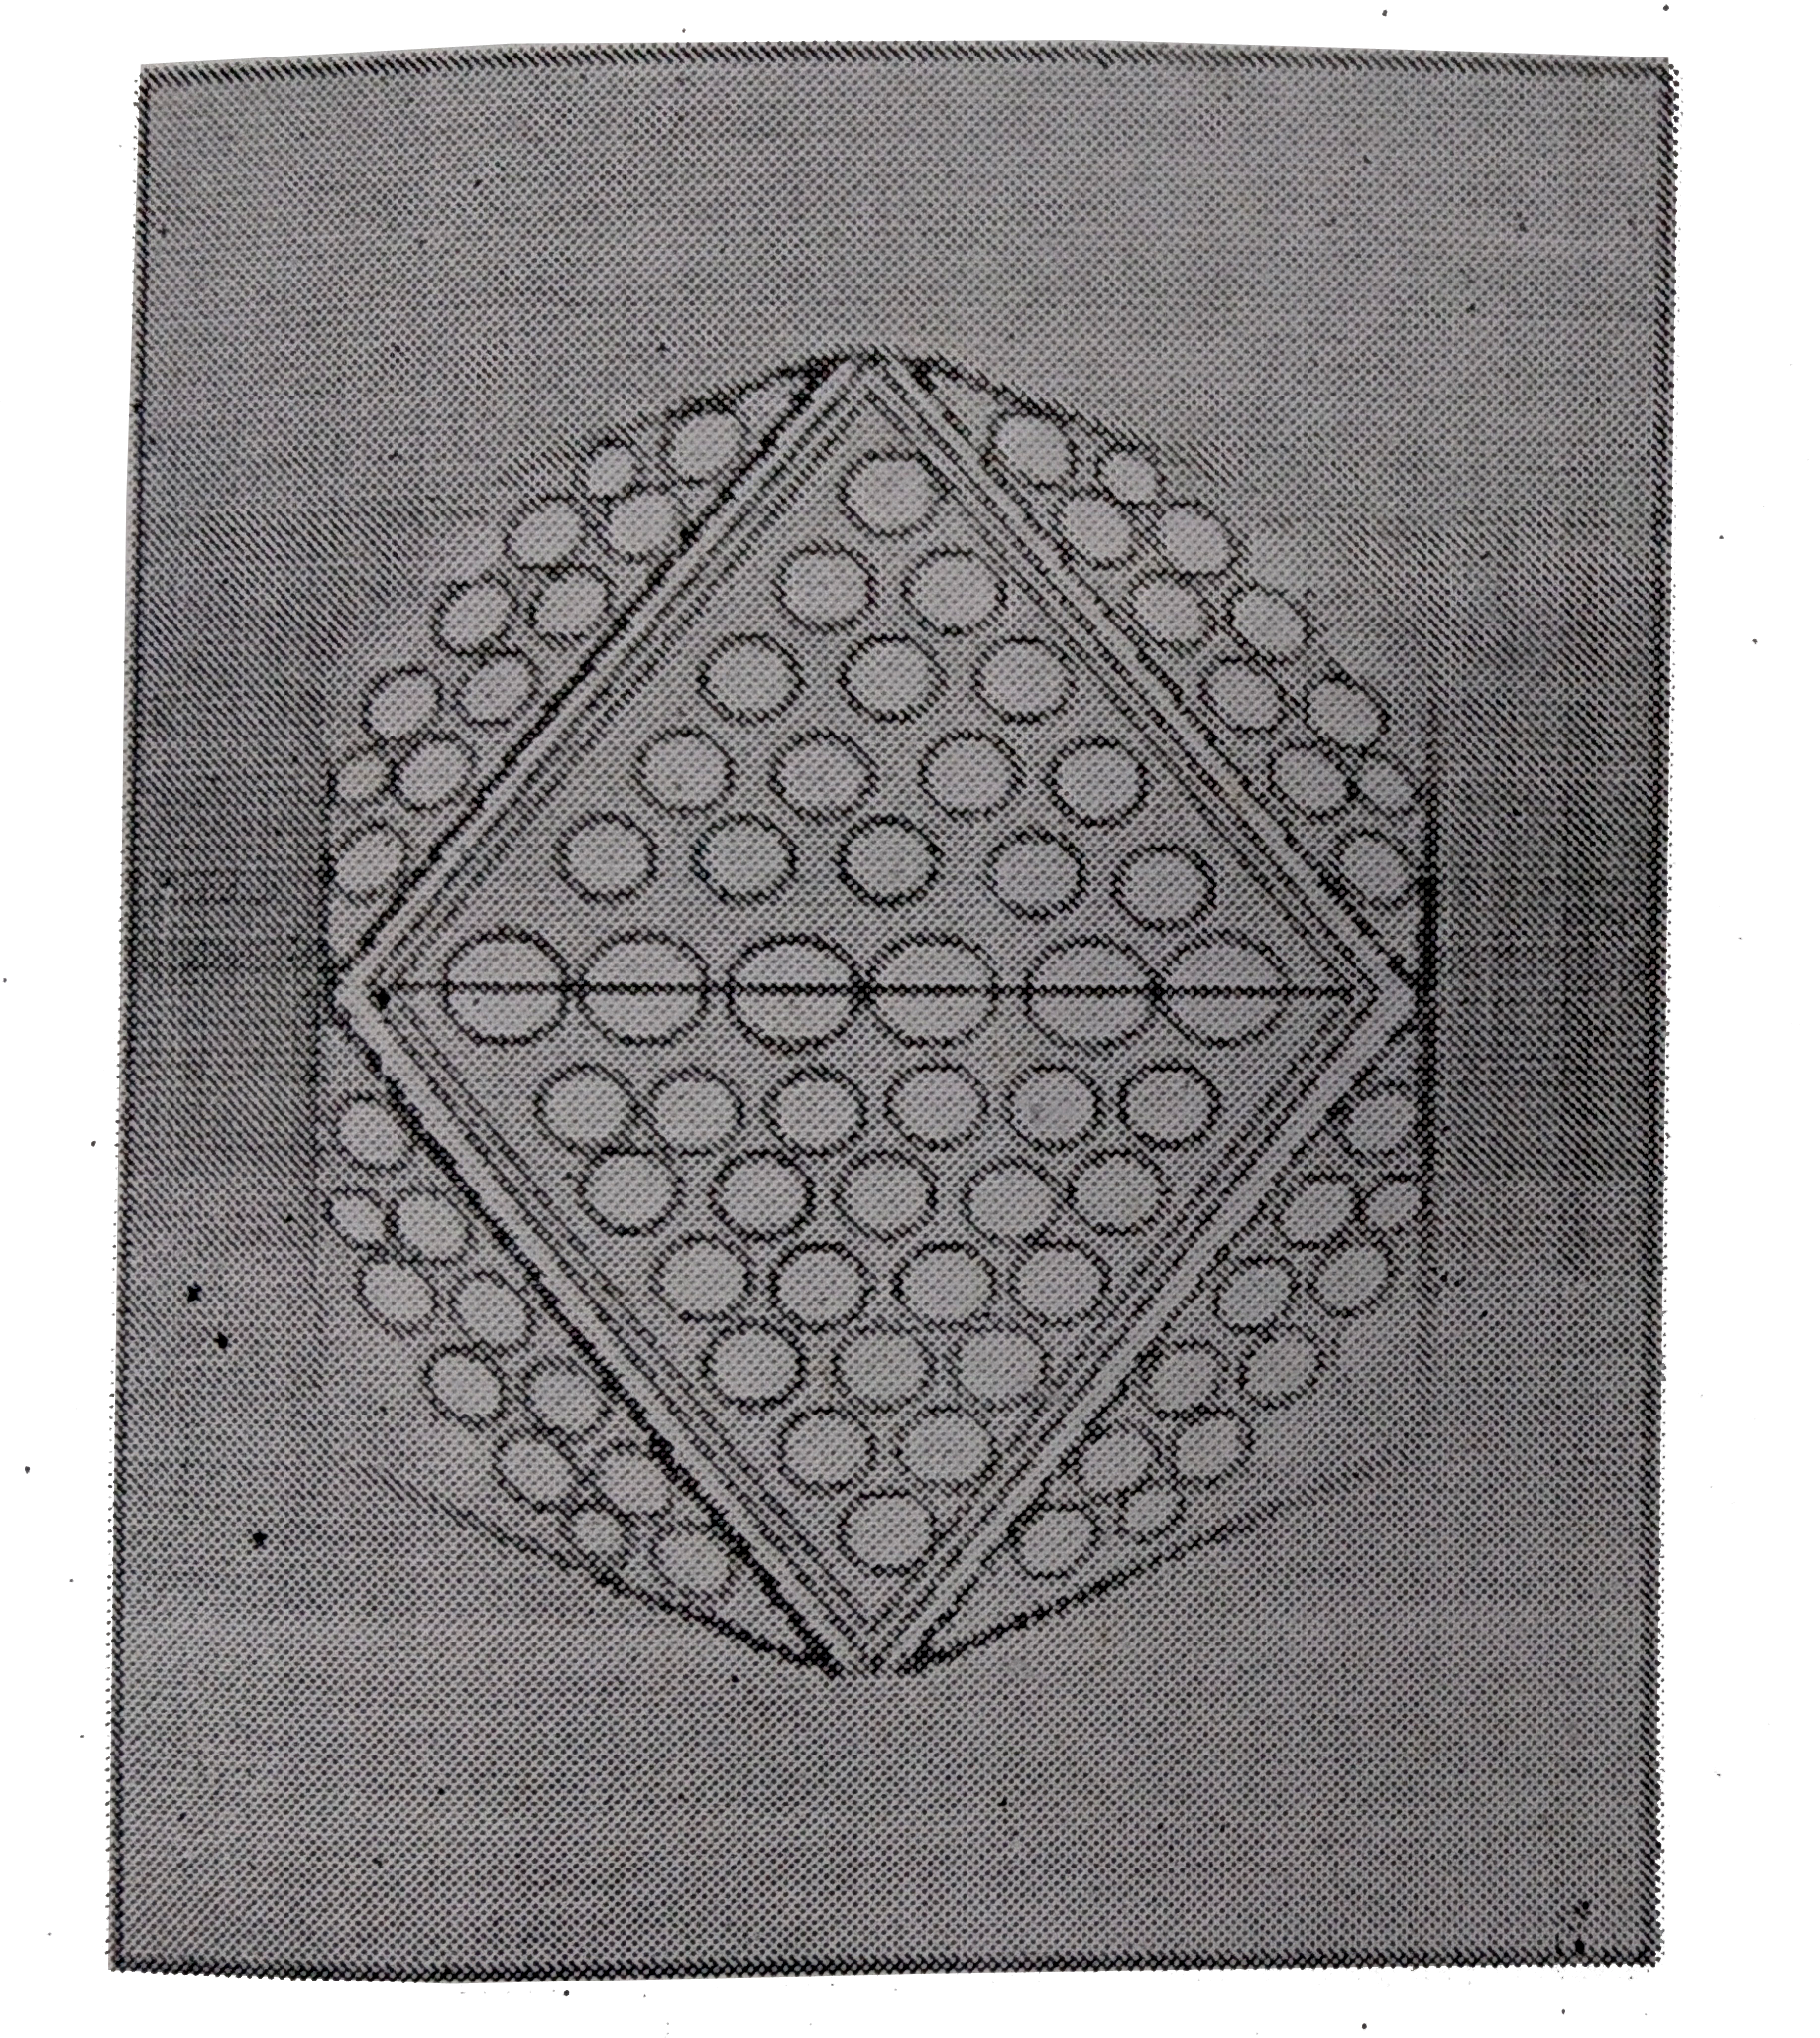
Choose the correct for the given diagram
View SolutionConsider p-V diagram for an ideal gas shown in figure.

Out of the following diagrams, which figure represents the T−p diagram ?
(i)
View SolutionA cyclic process is shown in theP–T diagram. Which of the curves show the same process on a V–T diagram?
View SolutionA cyclic process is shown in theP–T diagram. Which of the curves show the same process on a V–T diagram?

View Solution

