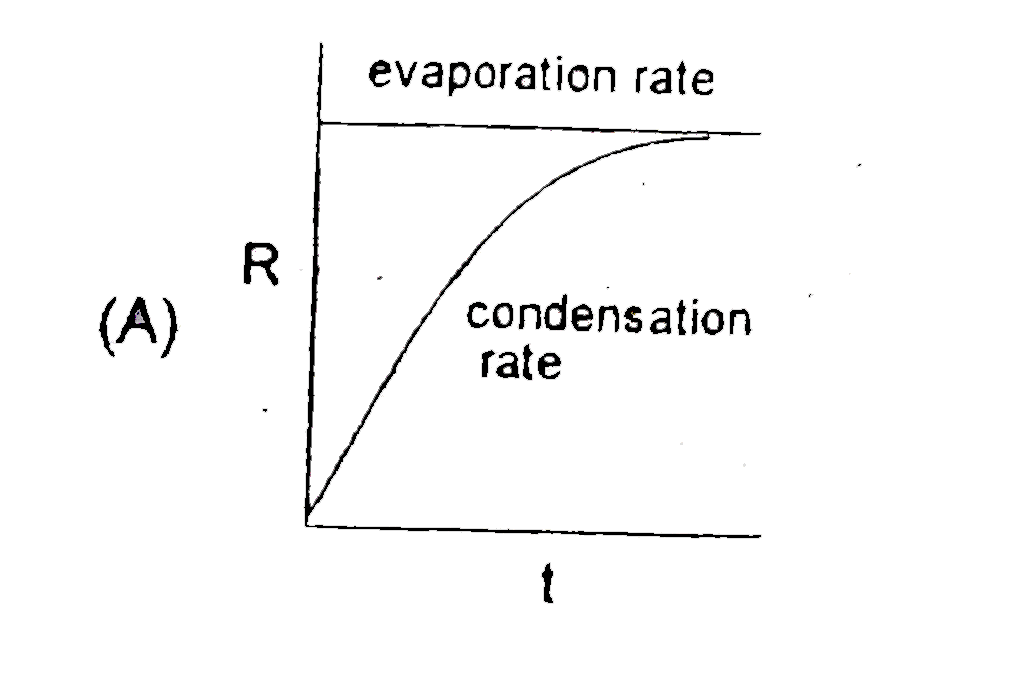
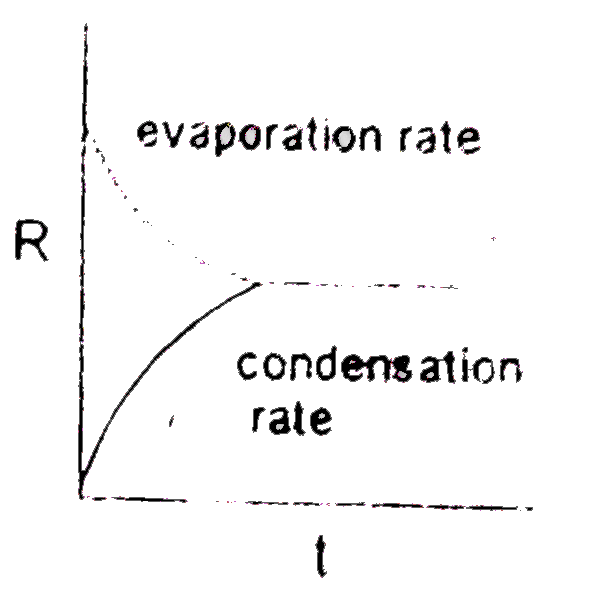
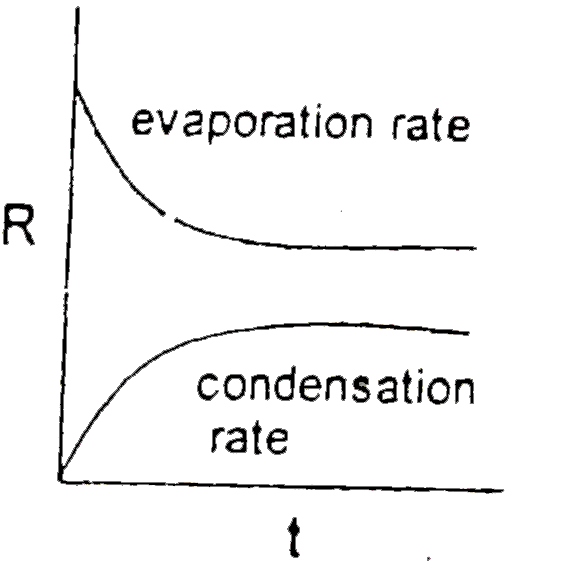
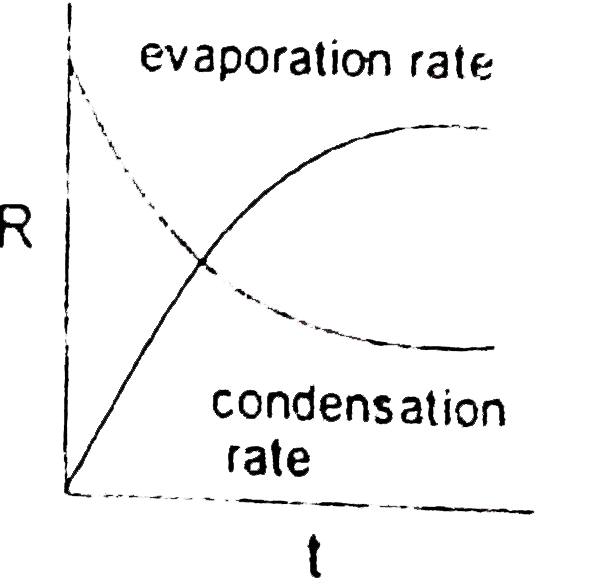
Which graph is/are incorrect for a pure liquid evaporating in a
closed container?


The correct Answer is:B, C, D
To determine which graphs are incorrect for a pure liquid evaporating in a closed container, we need to understand the behavior of evaporation and the concept of equilibrium in a closed system.
1. Understanding Evaporation in a Closed Container:
- When a pure liquid is placed in a closed container, it will start to evaporate. The molecules at the surface of the liquid gain enough energy to escape into the gas phase.
2. Establishing Equilibrium:
- As evaporation occurs, the vapor pressure of the gas above the liquid increases. Eventually, a point is reached where the rate of evaporation equals the rate of condensation (gas molecules returning to the liquid phase). This is known as dynamic equilibrium.
3. Behavior of Evaporation Rate:
- At the start, the evaporation rate increases as more molecules escape into the gas phase. However, once equilibrium is established, the rate of evaporation becomes constant over time.
4. Analyzing the Graphs:
- Graph 1: If the graph shows a continuous increase in evaporation rate without leveling off, it is incorrect because the rate should stabilize at equilibrium.
- Graph 2: If the graph shows a decrease in evaporation rate after some time, it is also incorrect because the rate should remain constant after equilibrium is reached.
- Graph 3: If the graph shows a fluctuating evaporation rate without stabilizing, it is incorrect for the same reason.
- Graph 4: If the graph shows a constant decrease in evaporation rate, it is incorrect because, again, the rate should stabilize.
5. Conclusion:
- The incorrect graphs for a pure liquid evaporating in a closed container are those that do not show a constant rate after equilibrium is reached. Therefore, the answer includes graphs that depict continuous increase, decrease, or fluctuation in the evaporation rate.
Final Answer:
The incorrect graphs are options 2, 3, and 4.
- When a pure liquid is placed in a closed container, it will start to evaporate. The molecules at the surface of the liquid gain enough energy to escape into the gas phase.
- As evaporation occurs, the vapor pressure of the gas above the liquid increases. Eventually, a point is reached where the rate of evaporation equals the rate of condensation (gas molecules returning to the liquid phase). This is known as dynamic equilibrium.
- At the start, the evaporation rate increases as more molecules escape into the gas phase. However, once equilibrium is established, the rate of evaporation becomes constant over time.
- Graph 1: If the graph shows a continuous increase in evaporation rate without leveling off, it is incorrect because the rate should stabilize at equilibrium.
- Graph 2: If the graph shows a decrease in evaporation rate after some time, it is also incorrect because the rate should remain constant after equilibrium is reached.
- Graph 3: If the graph shows a fluctuating evaporation rate without stabilizing, it is incorrect for the same reason.
- Graph 4: If the graph shows a constant decrease in evaporation rate, it is incorrect because, again, the rate should stabilize.
- The incorrect graphs for a pure liquid evaporating in a closed container are those that do not show a constant rate after equilibrium is reached. Therefore, the answer includes graphs that depict continuous increase, decrease, or fluctuation in the evaporation rate.
The incorrect graphs are options 2, 3, and 4.
Topper's Solved these Questions
- BOOK - RESONANCE ENGLISHCHAPTER - TEST PAPERSEXERCISE - PT-0130videos
TEST PAPERS
- BOOK - RESONANCE ENGLISHCHAPTER - TEST PAPERSEXERCISE - Pt-0230videos
TEST PAPERS
- BOOK - RESONANCE ENGLISHCHAPTER - TEST PAPERSEXERCISE - PART - III CHEMISTRY20videos
TEST PAPERS
- BOOK - RESONANCE ENGLISHCHAPTER - SURFACE CHEMISTRYEXERCISE - Section - 51videos
SURFACE CHEMISTRY
- BOOK - RESONANCE ENGLISHCHAPTER - TEST SERIESEXERCISE - CHEMISTRY50videos
TEST SERIES
Similar Questions
Knowledge Check
- Question 1 - Select One

Which of these is incorrect regarding A and B in the given graph ?AA is deoxygenated blood leaving the tissues.BB is reduced blood returning from tissues.CA is oxygenated blood leaving the lungs.DB is deoxygenated blood in the systemic veins.
Vapour pressure of a pure liquid does not depend upon
View SolutionA pure liquid is obtained from a solutions by :
View SolutionIn figure , heat is added to a pure substance in a closed container rate. A graph of the temperature of the substance as a function of time is shown here , If LF = heat of fusion and LV= heat of vaporization . What is the value of the ratio LV/LF for this substance ?
_E01_035_Q01.png) View Solution
View SolutionS.L Miller's closed flask contained
View SolutionS.L Miller's closed flask contained
View SolutionDuring the evaporation of liquid
View SolutionDuring the evaporation of liquid
View Solution


