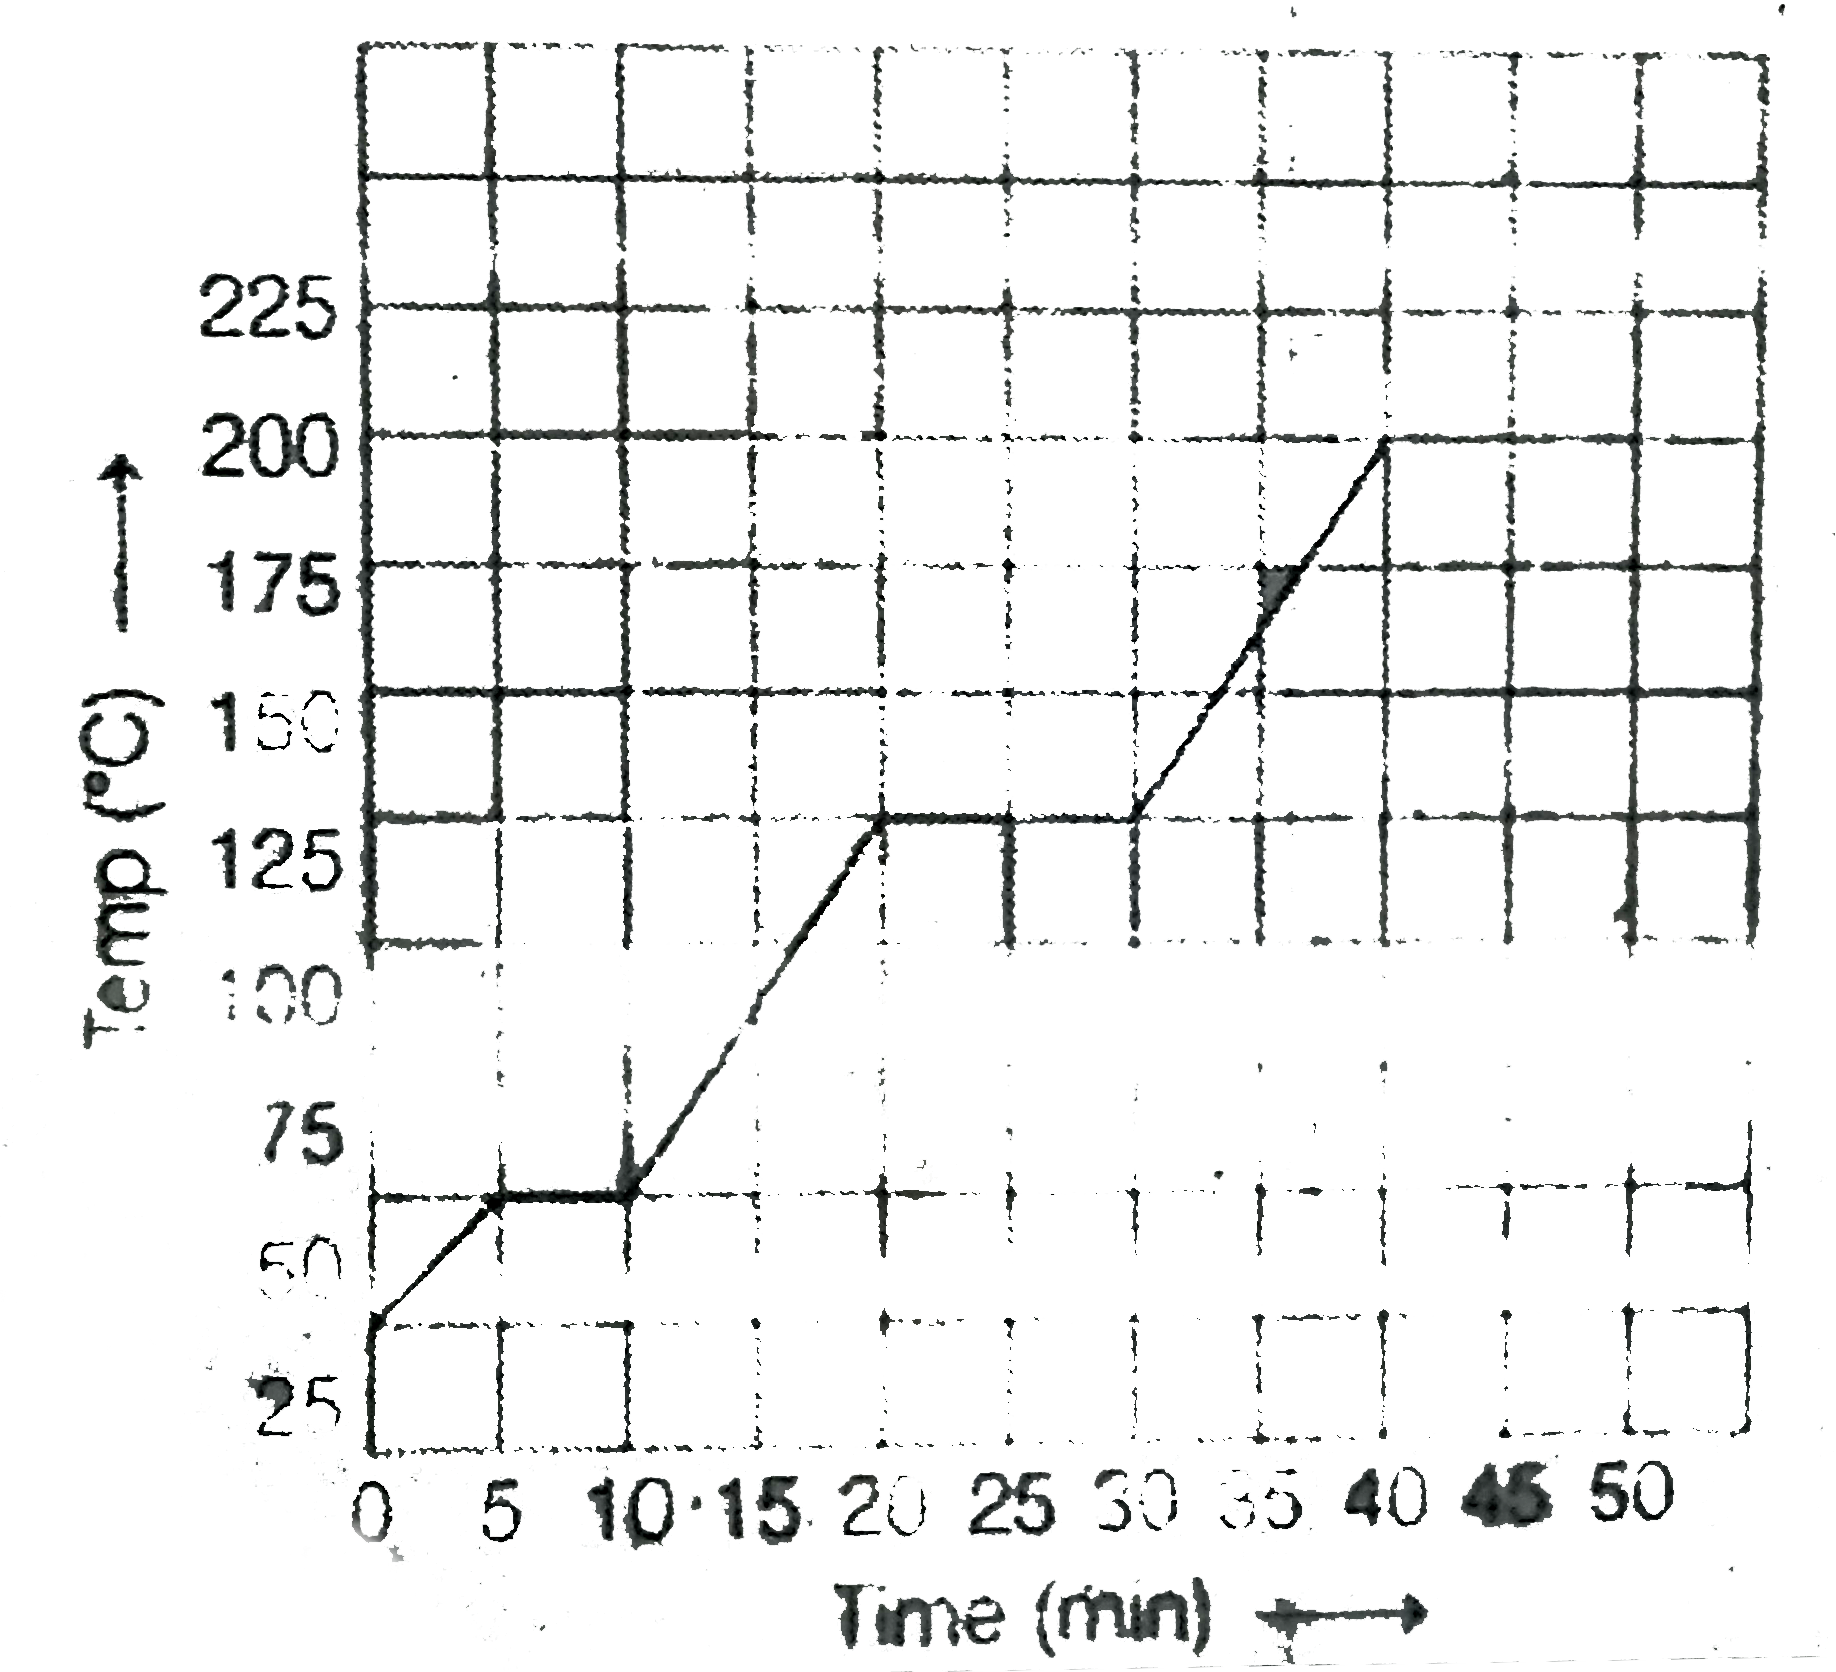
In figure , heat is added to a pure substance in a closed container rate. A graph of the temperature of the substance as a function of time is shown here , If LF = heat of fusion and LV= heat of vaporization . What is the value of the ratio LV/LF for this substance ?
_E01_035_Q01.png)
5.0
4.5
7.2
3.5
The correct Answer is:D
L∝ number of blocks
Topper's Solved these Questions
- BOOK - ALLENCHAPTER - GEOMETRICAL OPTICSEXERCISE - EXERCISE -0282videos
GEOMETRICAL OPTICS
- BOOK - ALLENCHAPTER - GEOMETRICAL OPTICSEXERCISE - EXERCISE -0310videos
GEOMETRICAL OPTICS
- BOOK - ALLENCHAPTER - GEOMETRICAL OPTICSEXERCISE - SOME WORKED OUT EXAMPLES83videos
GEOMETRICAL OPTICS
- BOOK - ALLENCHAPTER - CURRENT ELECTRICITYEXERCISE - EX.II66videos
CURRENT ELECTRICITY
- BOOK - ALLENCHAPTER - GRAVITATIONEXERCISE - EXERCISE 49videos
GRAVITATION
Similar Questions
The graph shown in the figure represents change in the temperature of 5 kg of a substance as it absorbs heat at a costant rate of 42 kJ min−1. The latent heat of vaporization of the substance is :
 View Solution
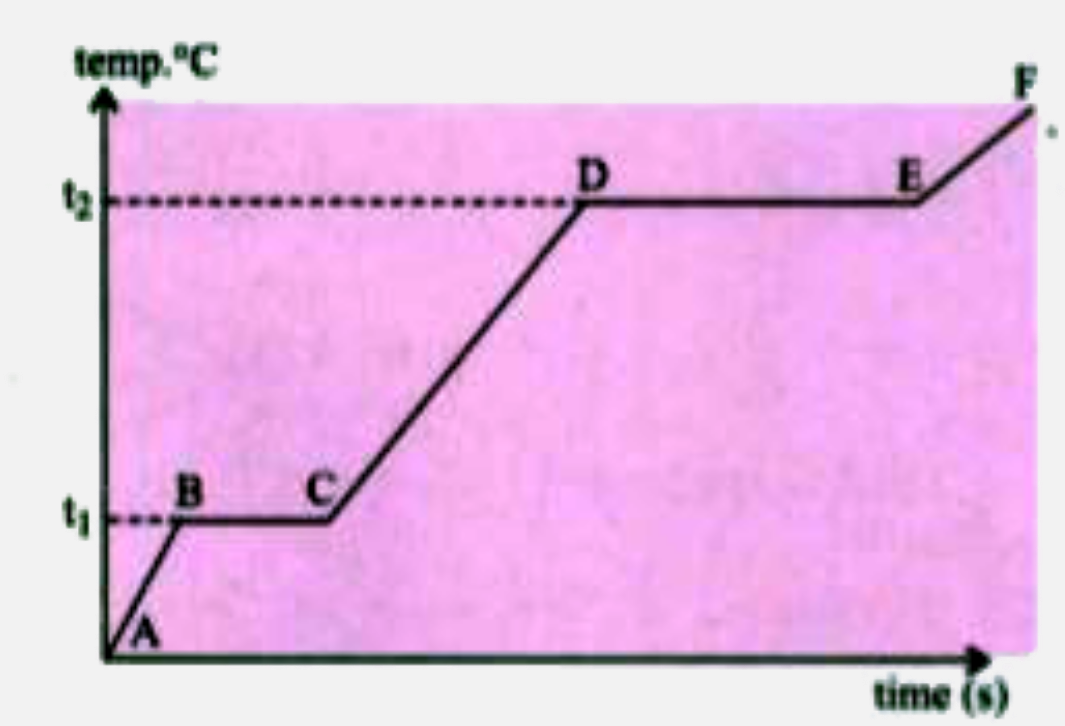
The diagram below shows the change of phases of a substance on a temperature vs time graph on heating the substance at a constant rate.

Why is the slope of CD less than slope of AB ?View SolutionThe diagram below shows the change of phases of a substance on a temperature vs time graph on heating the substance at a constant rate.

What is the boiling and melting point of the substance ?View SolutionHeat energy at constant rate is given to two substances P and Q. If variation of temperature (T) of substances with time (t) is as shown in figure, then select the correct statement
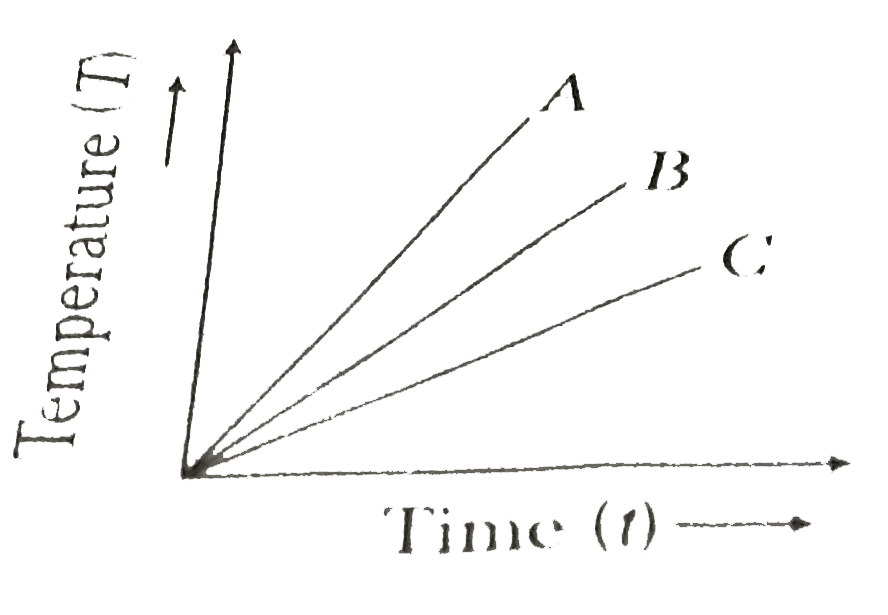
View SolutionThe temperatures versus time graph is shown in figure. Which of the substance A,B and C has the lowest heat capacity if heat is supplied to all of them at equal rates.
 View Solution
A well insulated substance in solid state is heated at a constant rate until it vaporizes completely. The temperature-time graph of the substance is shown below . Which of the following statements is//are true?
_E01_077_Q01.png) View Solution
View Solution
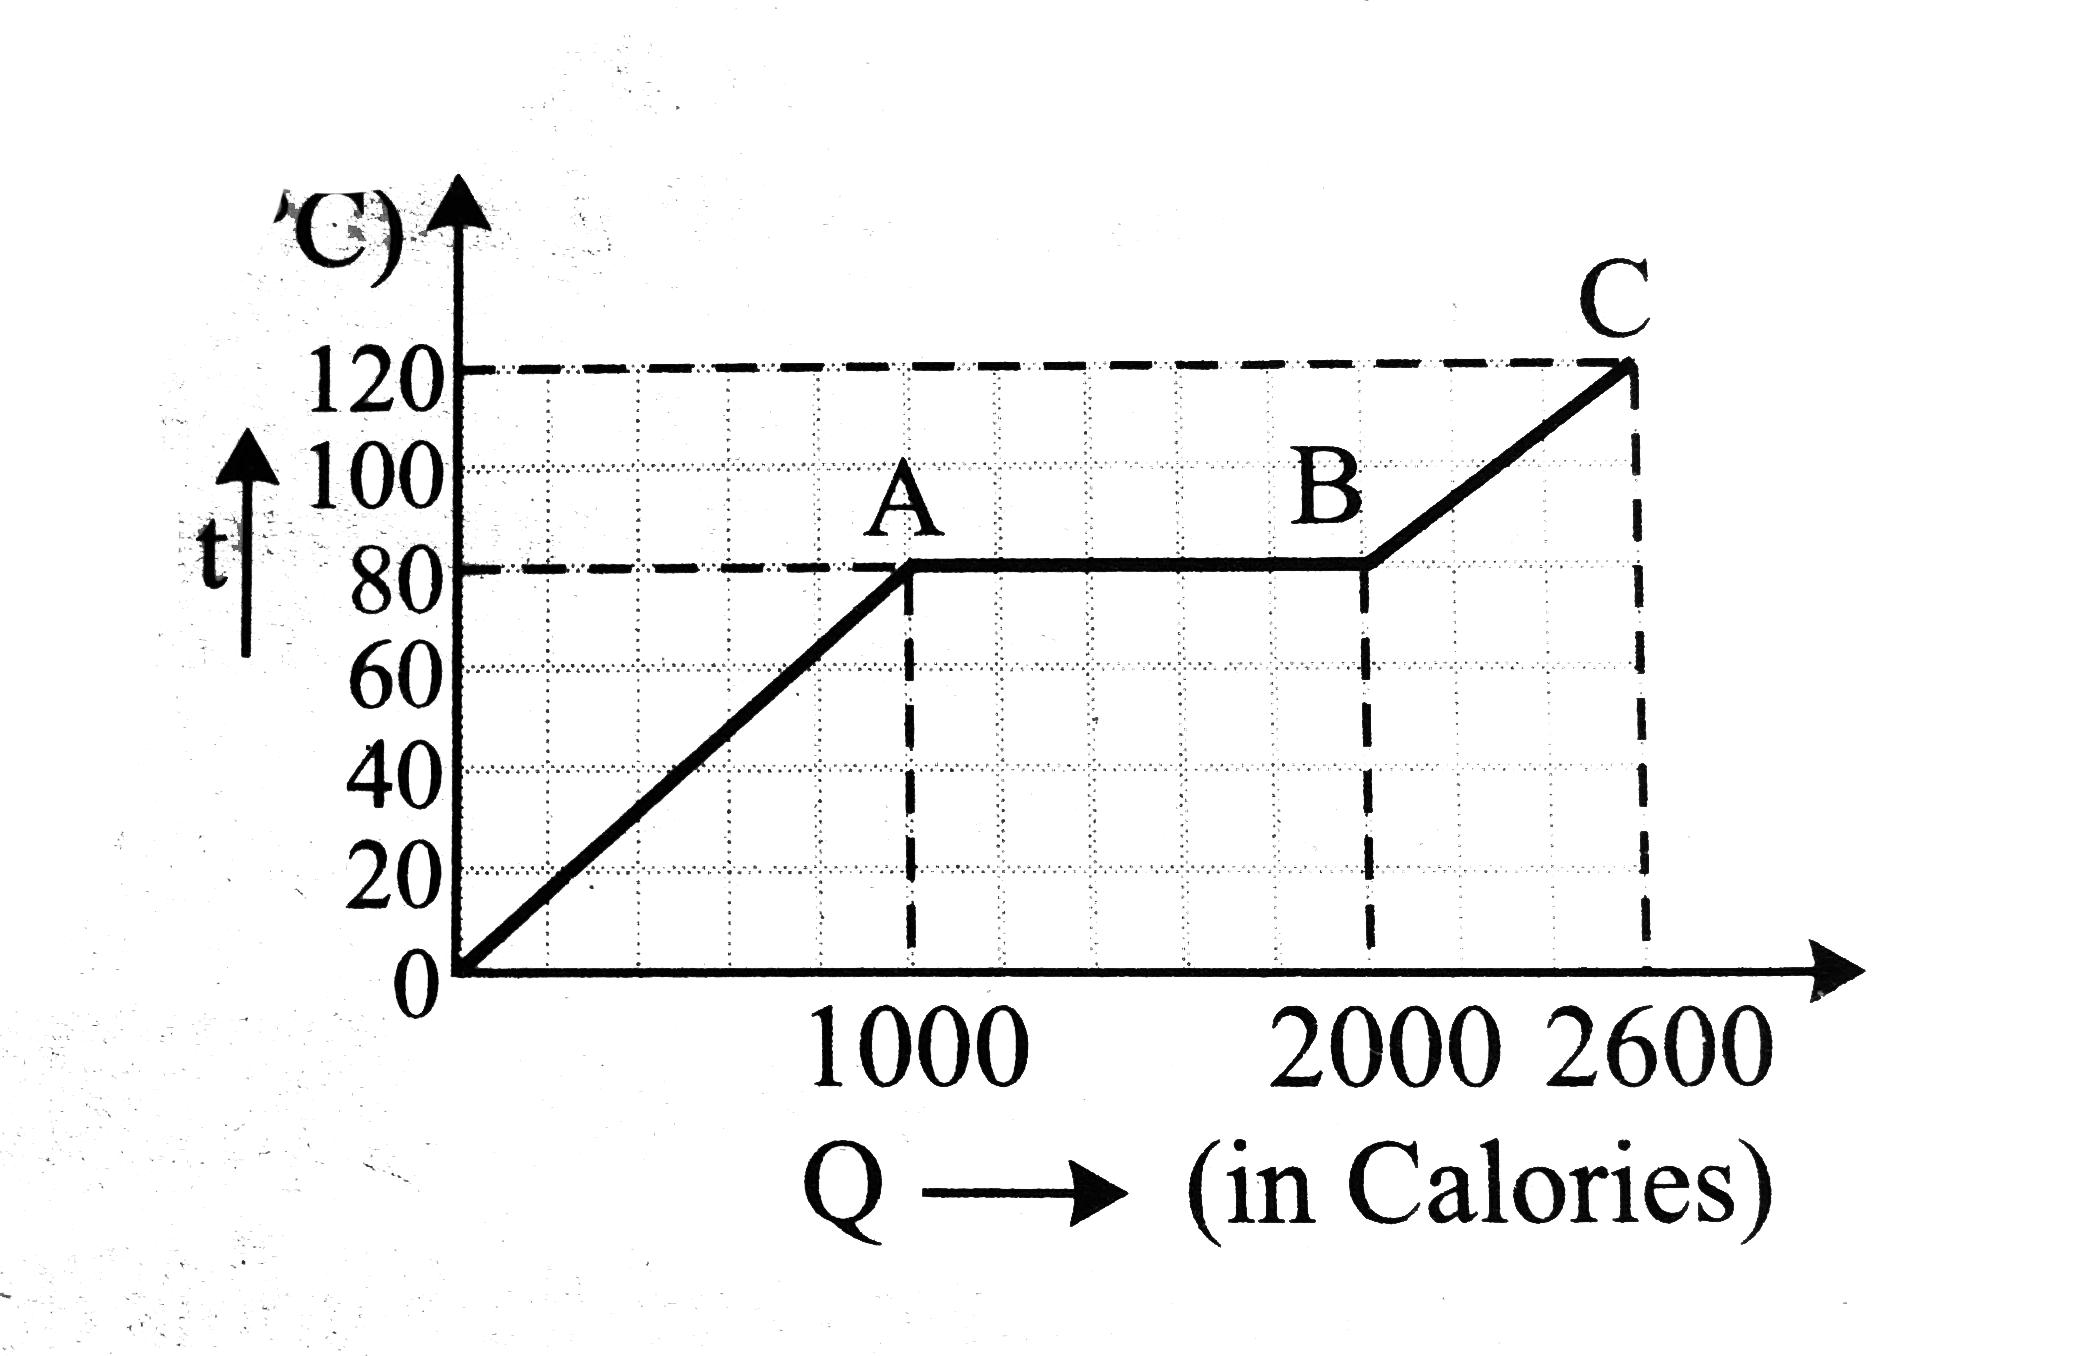
A substance is in the solid form at 0∘C. The amount of heat added to this substance and its temperature are plotted in the following graph. If the relative specific heat capacity of the solid substance is 0.5, find from the graph (i) the mass of the substance, (ii) the specific latent heat of the melting process and (ii) the specific heat of the substance in the liquid state.
Specific heat capacity of water =1000cal/kg/KView SolutionThe diagram in Fig. 11.8 below shows the change of phases of a substance on a temperature-time graph on heating the substances at a constant rate.
(a) What do the parts AB, BC, CD and DE represent?
(b) What is the melting point of the substance ?
(c) What is the boiling point of the substance ?View Solution
A solid material is supplied with heat at a constant rate. The temperature of the material is changing with heat input as shown
(i) AB: change of state from solid to liquid.
CD: change of state from liquid to vapour
(ii) When CD=2AB, i.e., latent heat of vapourization is twice the latent heat of fusion of the substance.
(iii) The reciprocal of slope of DE represents the heat capacity of vapour state of substance .
(iv) If slope of OA>slope of BC, i.e., specific heat of liquid state is greater than specific heat that of solid state.View SolutionAluminium container of mass of 10 g contains 200 g of ice at−20∘C. Heat is added to the system at the rate of 100 calories per second. What is the temperature of the system after four minutes? Draw a rough sketch showing the variation of the temperature of the system as a function of time . Given:
Specific heat of ice = 0.5calg−1(.∘C)−1
Specific heat of aluminium = 0.2calg−1(.∘C)−1
Latent heat of fusion of ice = 80calg−1View Solution

