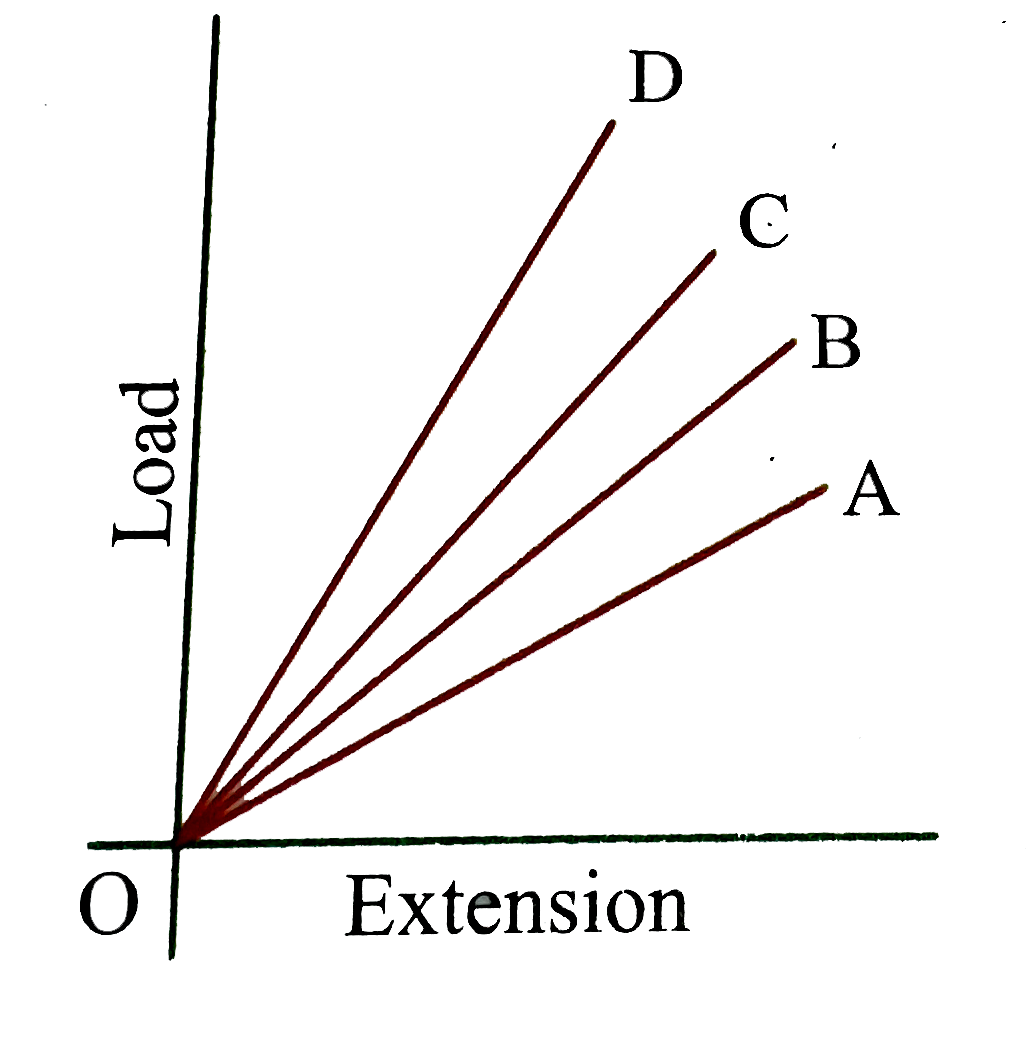
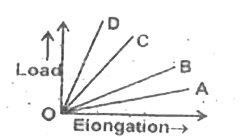
The load versus elongation graph for four wires of the same material is shown in the figure. The thickest wire is represented by the line
OC
OD
OA
OB
The correct Answer is:C
F/AΔl/l=Y
FΔl=Yπr2l
⇒FlYπ×1Δl=r2
⇒Y & l are same for all then
For same load rα1√Δl
Topper's Solved these Questions
- ELASTICITY AND VISCOCITYBOOK - RESONANCE ENGLISHCHAPTER - ELASTICITY AND VISCOCITYEXERCISE - Exercise- 2 PART - I
9 Videos
- ELASTICITY AND VISCOCITYBOOK - RESONANCE ENGLISHCHAPTER - ELASTICITY AND VISCOCITYEXERCISE - Exercise- 2 PART - II
6 Videos
- ELASTICITY AND VISCOCITYBOOK - RESONANCE ENGLISHCHAPTER - ELASTICITY AND VISCOCITYEXERCISE - Exercise- 1 PART - I
8 Videos
- DAILY PRACTICE PROBLEMSBOOK - RESONANCE ENGLISHCHAPTER - DAILY PRACTICE PROBLEMSEXERCISE - dpp 92 illustration
2 Videos
- ELECTROMAGNETIC INDUCTIONBOOK - RESONANCE ENGLISHCHAPTER - ELECTROMAGNETIC INDUCTIONEXERCISE - Exercise
43 Videos
Similar Questions
Knowledge Check
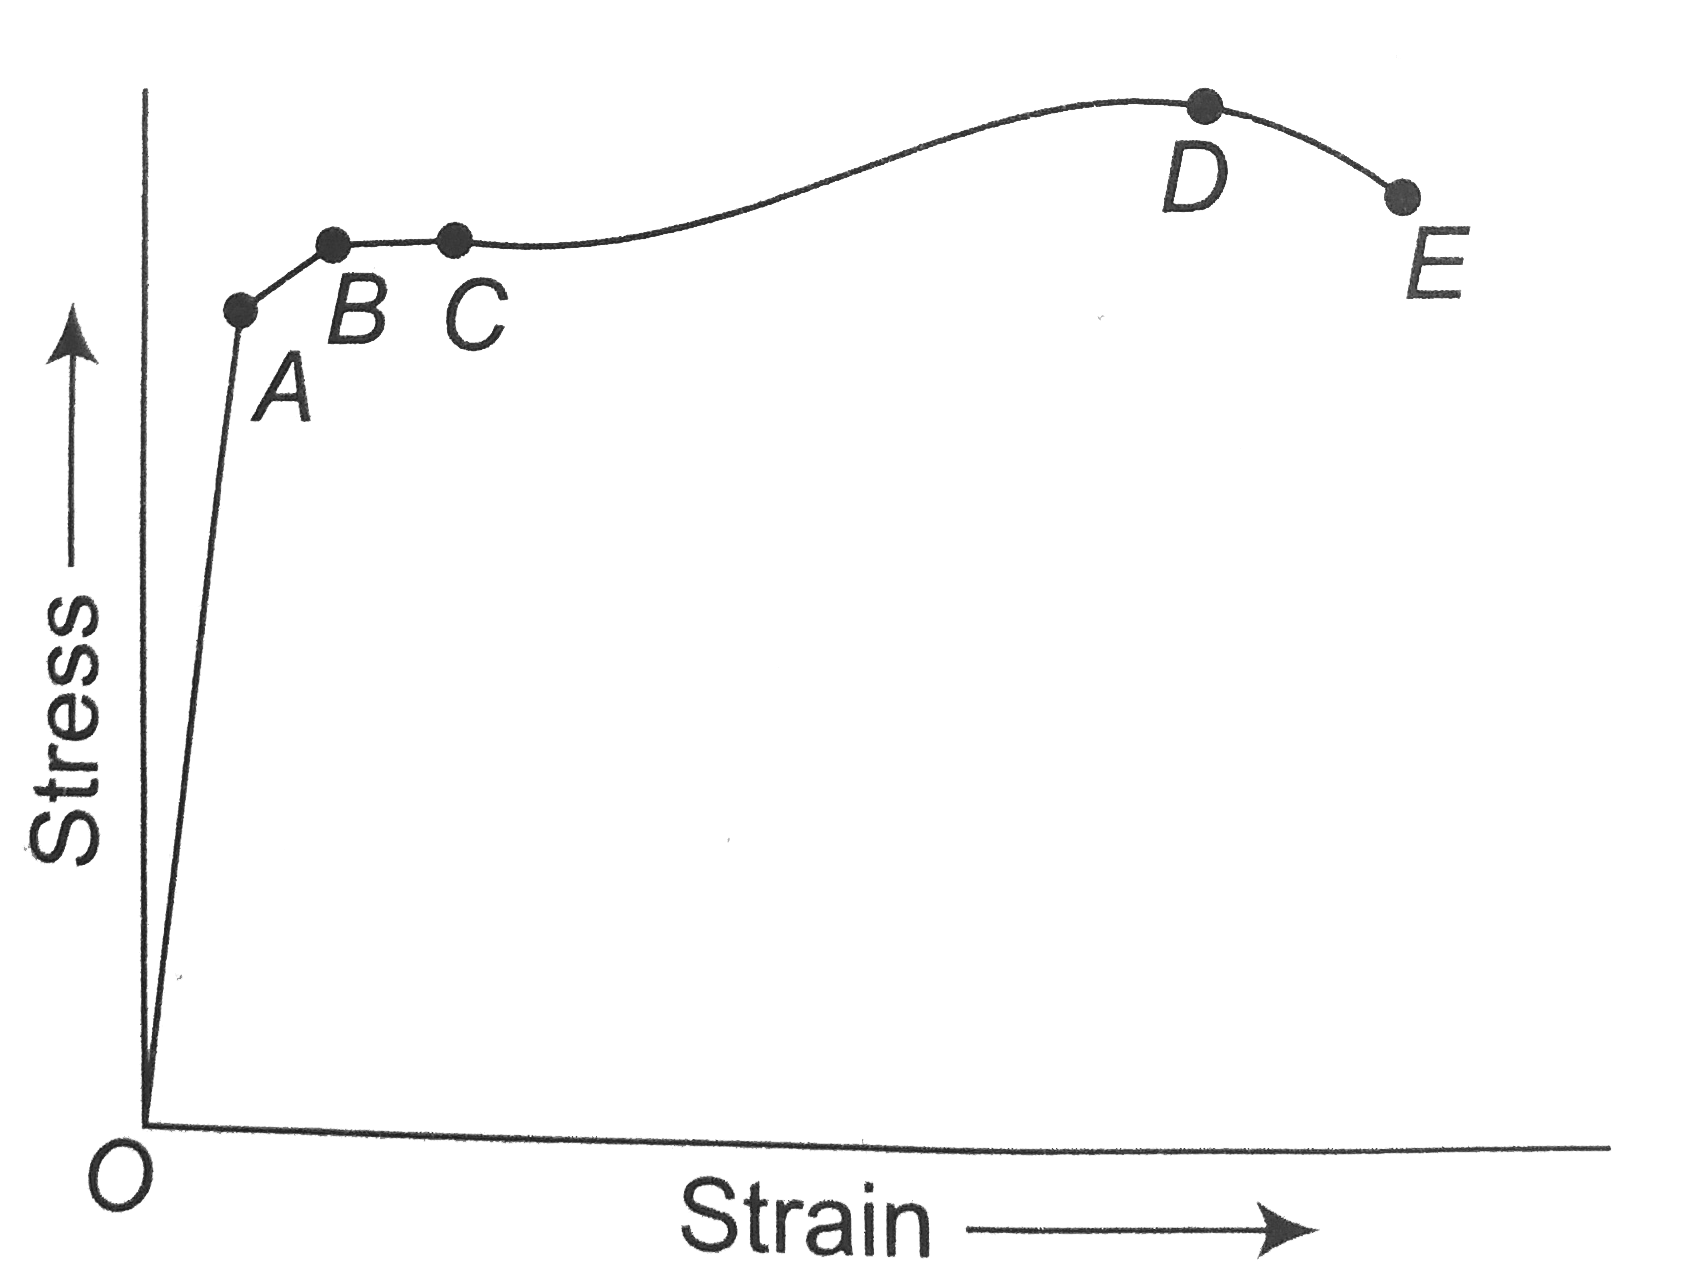
The stress strain graph for a metal wire is as shown in the figure. In the graph, the region in which Hooke's law is obeyed, the ultimate strength and fracture are represented byAOA, C, DBOB, D, ECÂ OA, D, EDOB, C, D
The load versus elongatino graphs for four wires A,B,C and D of the same material and equal lenghts are shown in the figure . The thickest wire is represented by the fine
View SolutionThe pointer reading versus load graph for a spring balance is as shown in the figure.
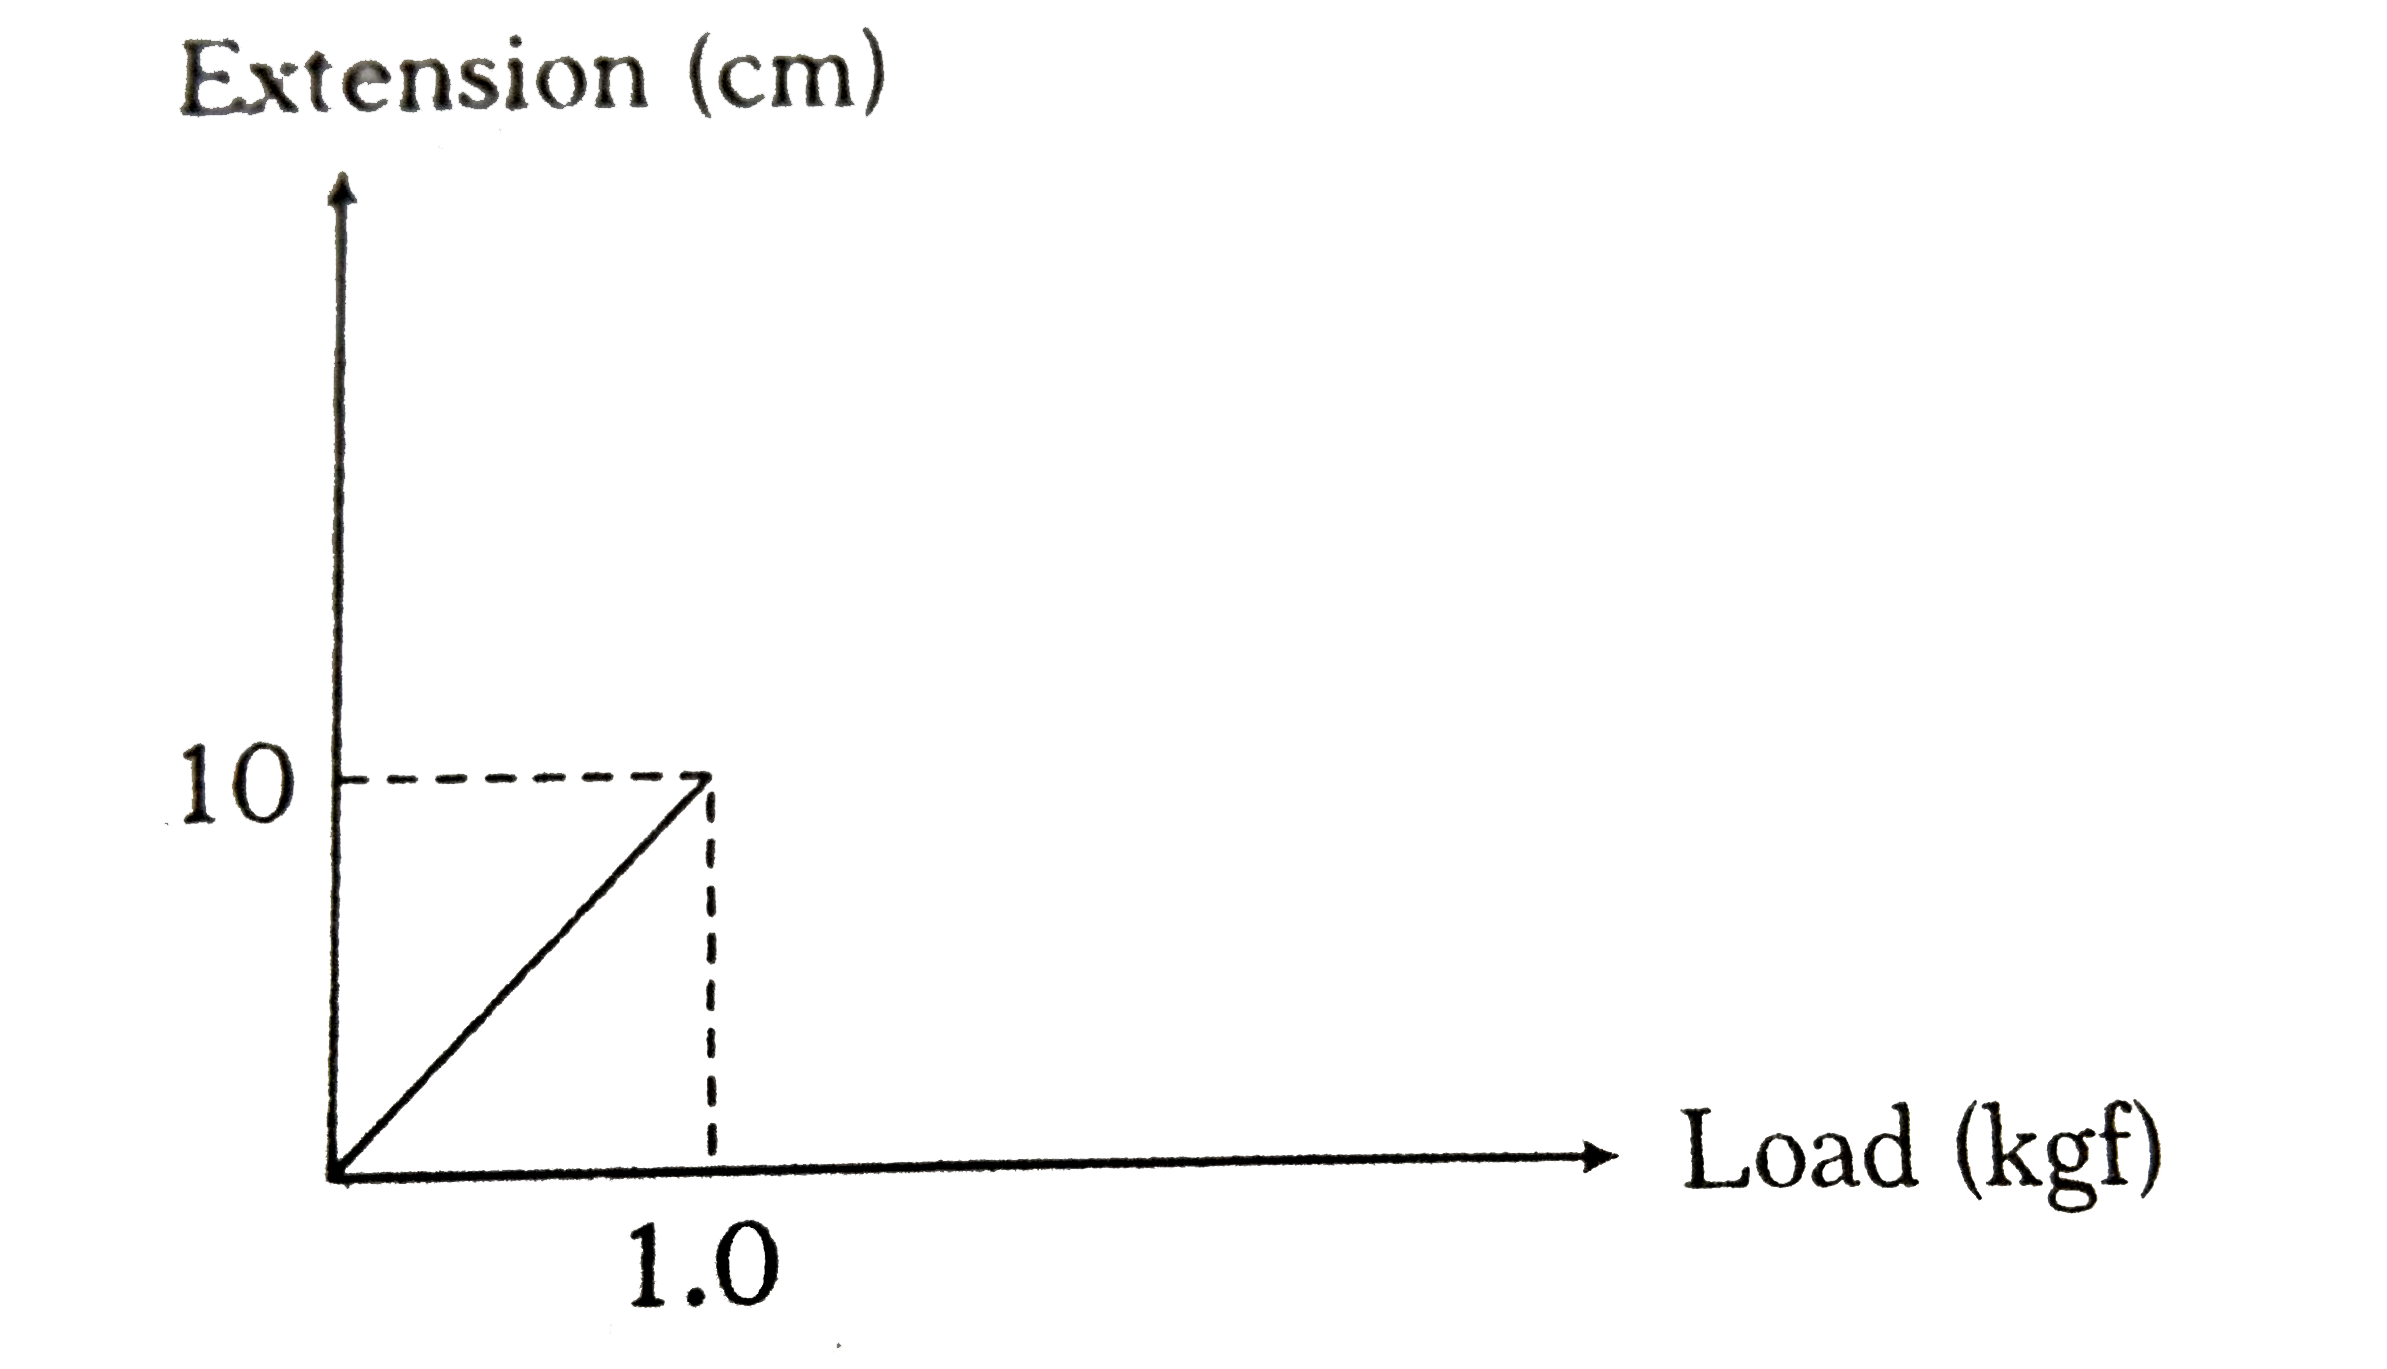
The spring constant is
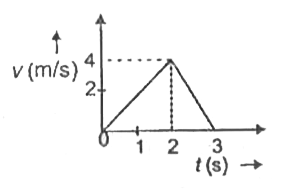
View SolutionThe velocity versus time graph of a body moving in a straight line is as shown in the figure below
View SolutionThe stress versus strain graphs for wires of two materials A and B are as shown in the figure. If YAandYB are the younng's moduli of the materials, then
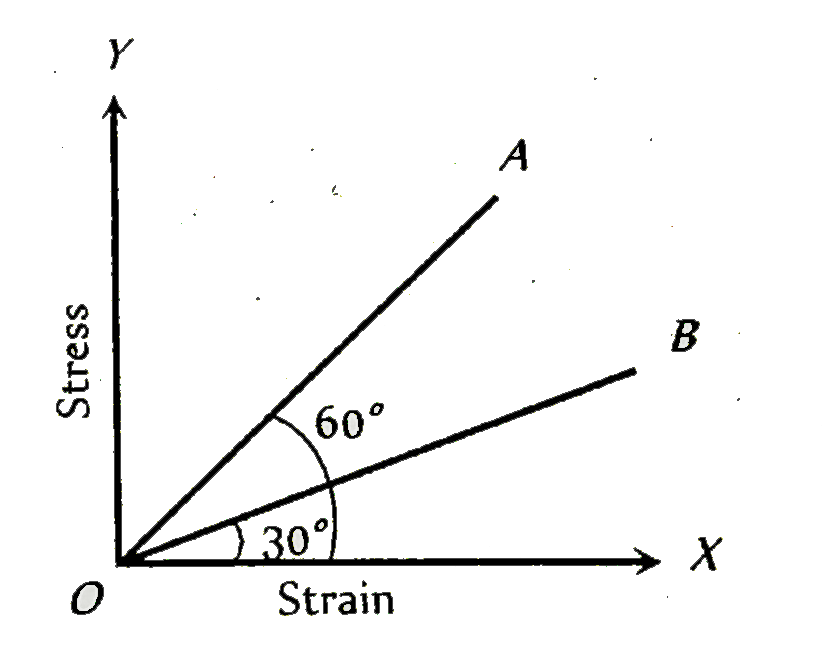
View SolutionThe stress versus strain graphs for wires of two materials A and B are as shown in the figure. If YAandYB are the younng's moduli of the materials, then

View SolutionThe dimensions of four wires of the same material an given below. In which wire the increase in the length will be maximum?
View SolutionThe x-t graph shown in figure represents

View Solution

_E01_007_Q01.png)
