Velocity time graphs of particles and moving along -axis are shown here. Both and start from origin: 
Maximum separation between the particles is
Maximum separation between the particles is
Maximum separation between the particles occurs at
Maximum separation between the particles occurs at
The correct Answer is:B, C
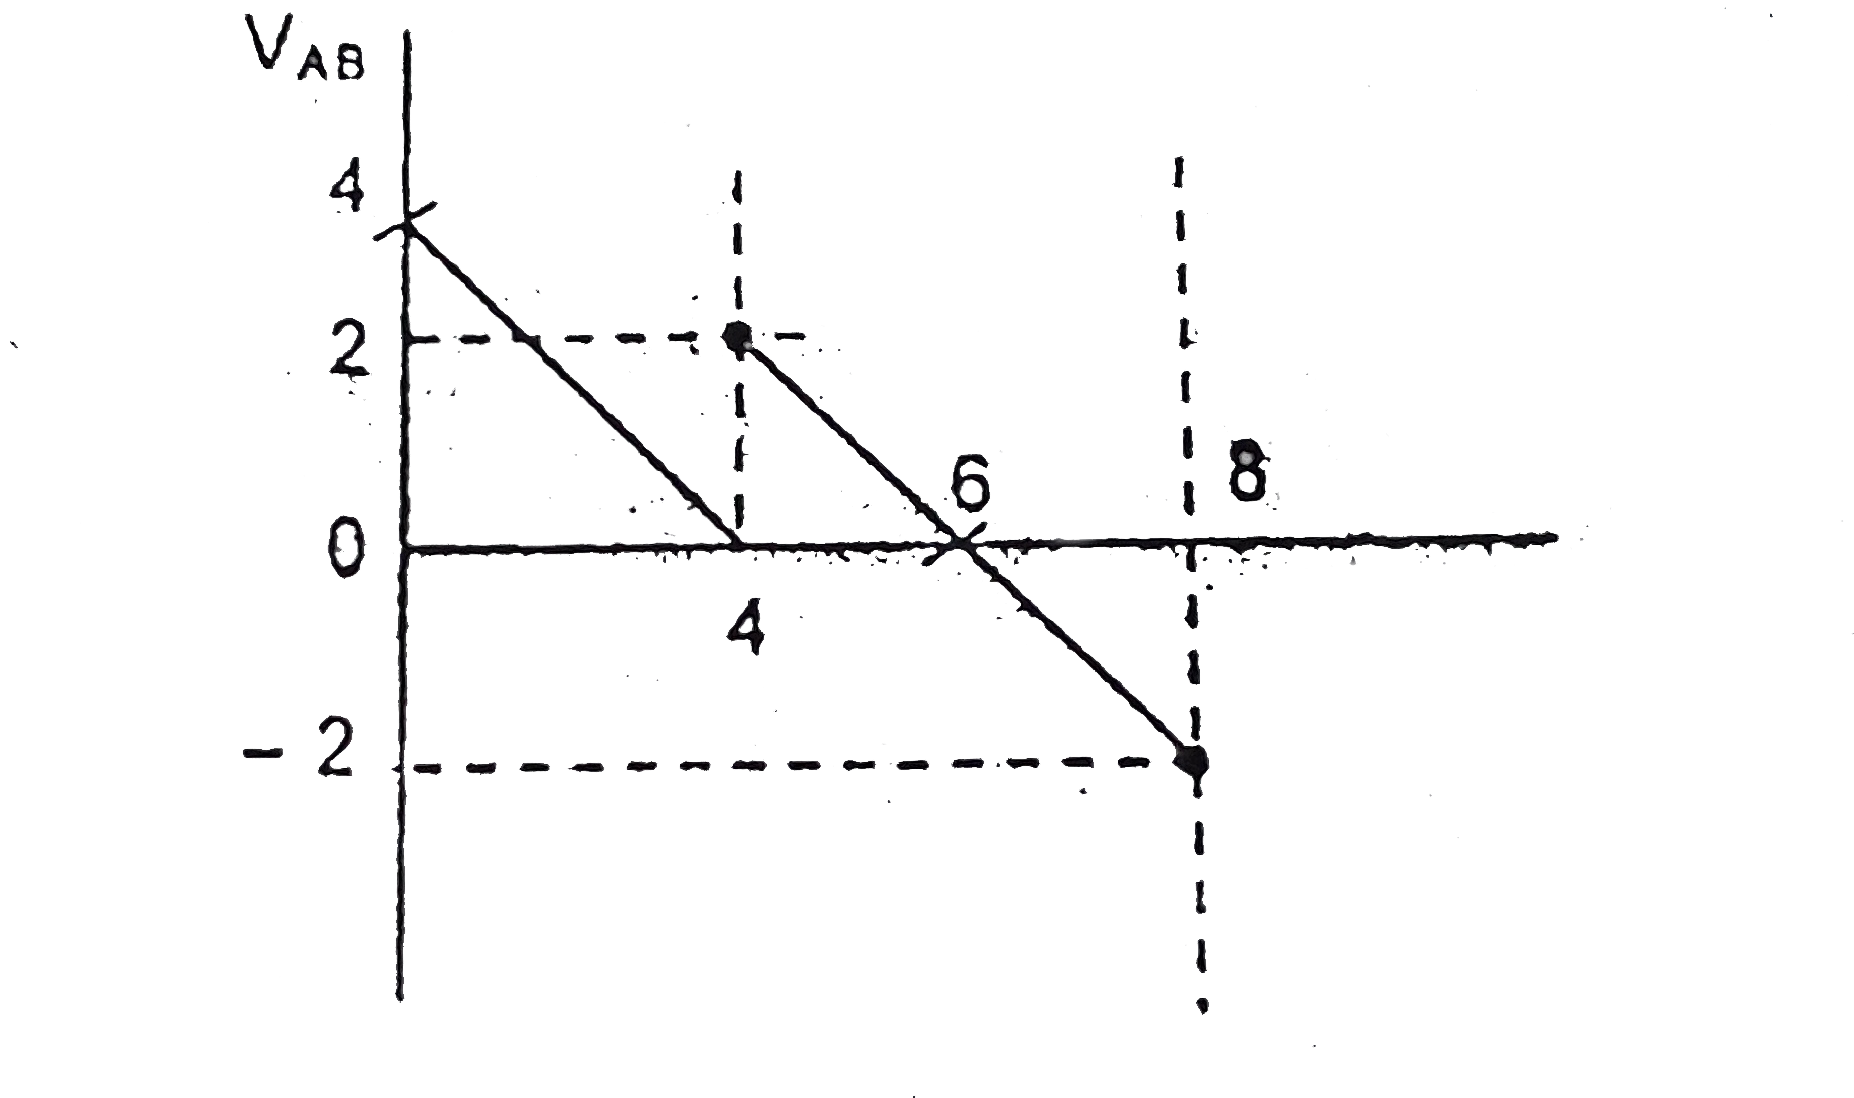
From the relative velocity graph, maximum separation will be at , second and is given by area under the graph between and second.
Topper's Solved these Questions
- TEST PAPERSBOOK - RESONANCE ENGLISHCHAPTER - TEST PAPERSEXERCISE - PART - II PHYSICS
106 Videos
- SIMPLE HARMONIC MOTION BOOK - RESONANCE ENGLISHCHAPTER - SIMPLE HARMONIC MOTION EXERCISE - Advanced Level Problems
13 Videos
- TEST SERIESBOOK - RESONANCE ENGLISHCHAPTER - TEST SERIESEXERCISE - PHYSICS
130 Videos
Similar Questions
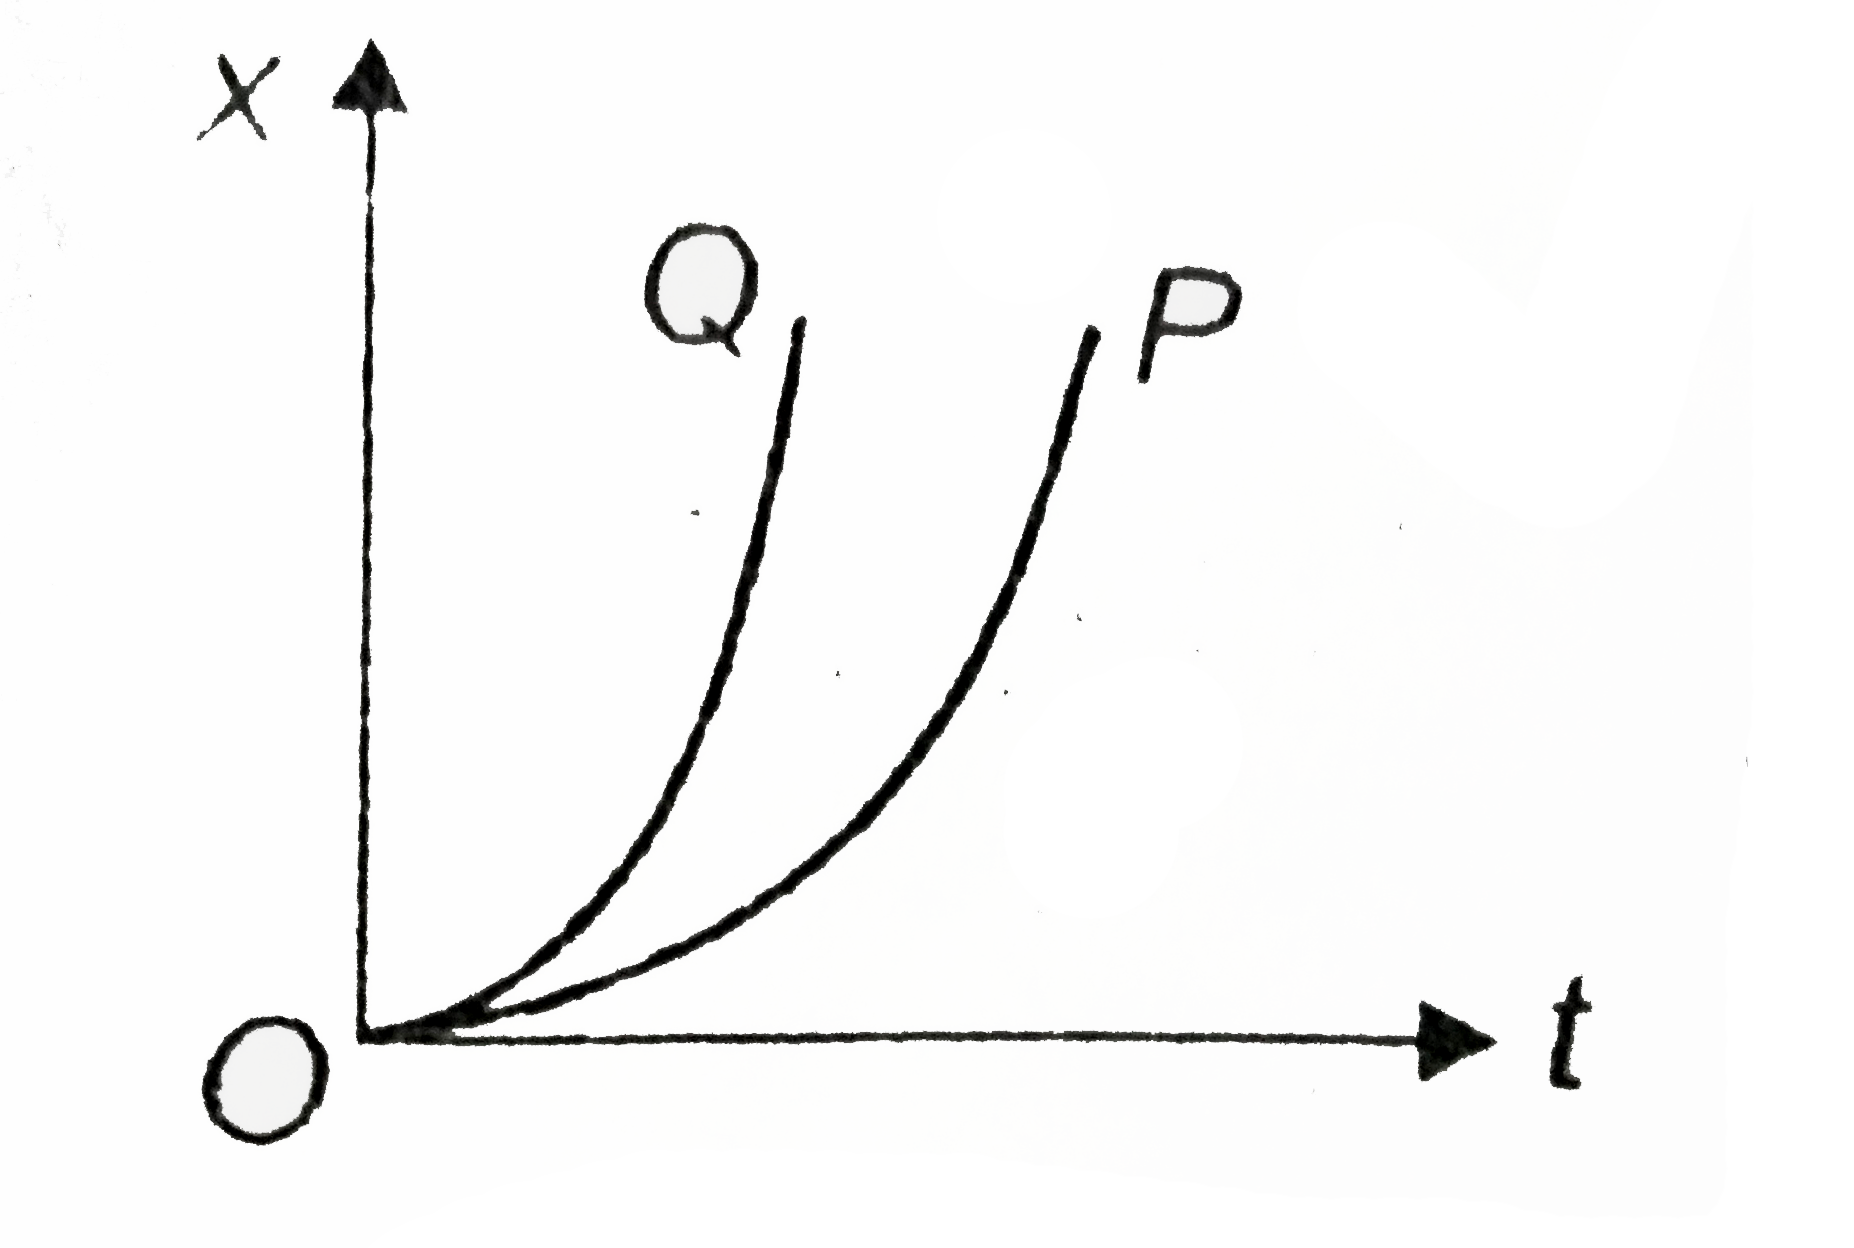
The position-time graph for two particles P and Q moving on x-axis is shown in the figure. Then
View SolutionThe velocity time graph of a particle moving along a straight line is shown in the figure. In the time interval from t=0 to t=8 second, answer the following three question.
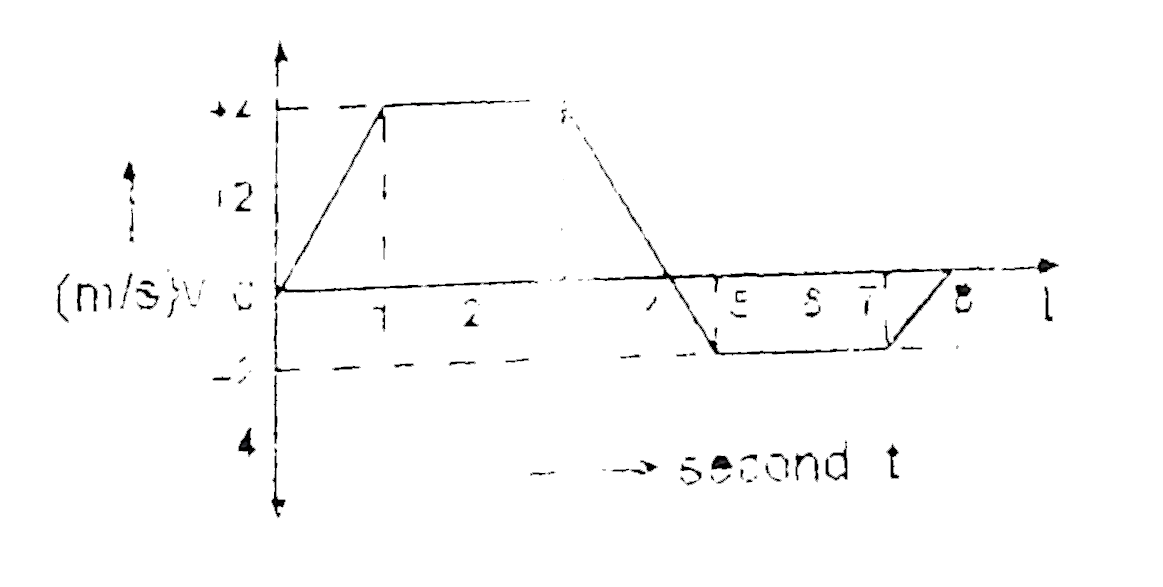
The distance travelled by the particle is :
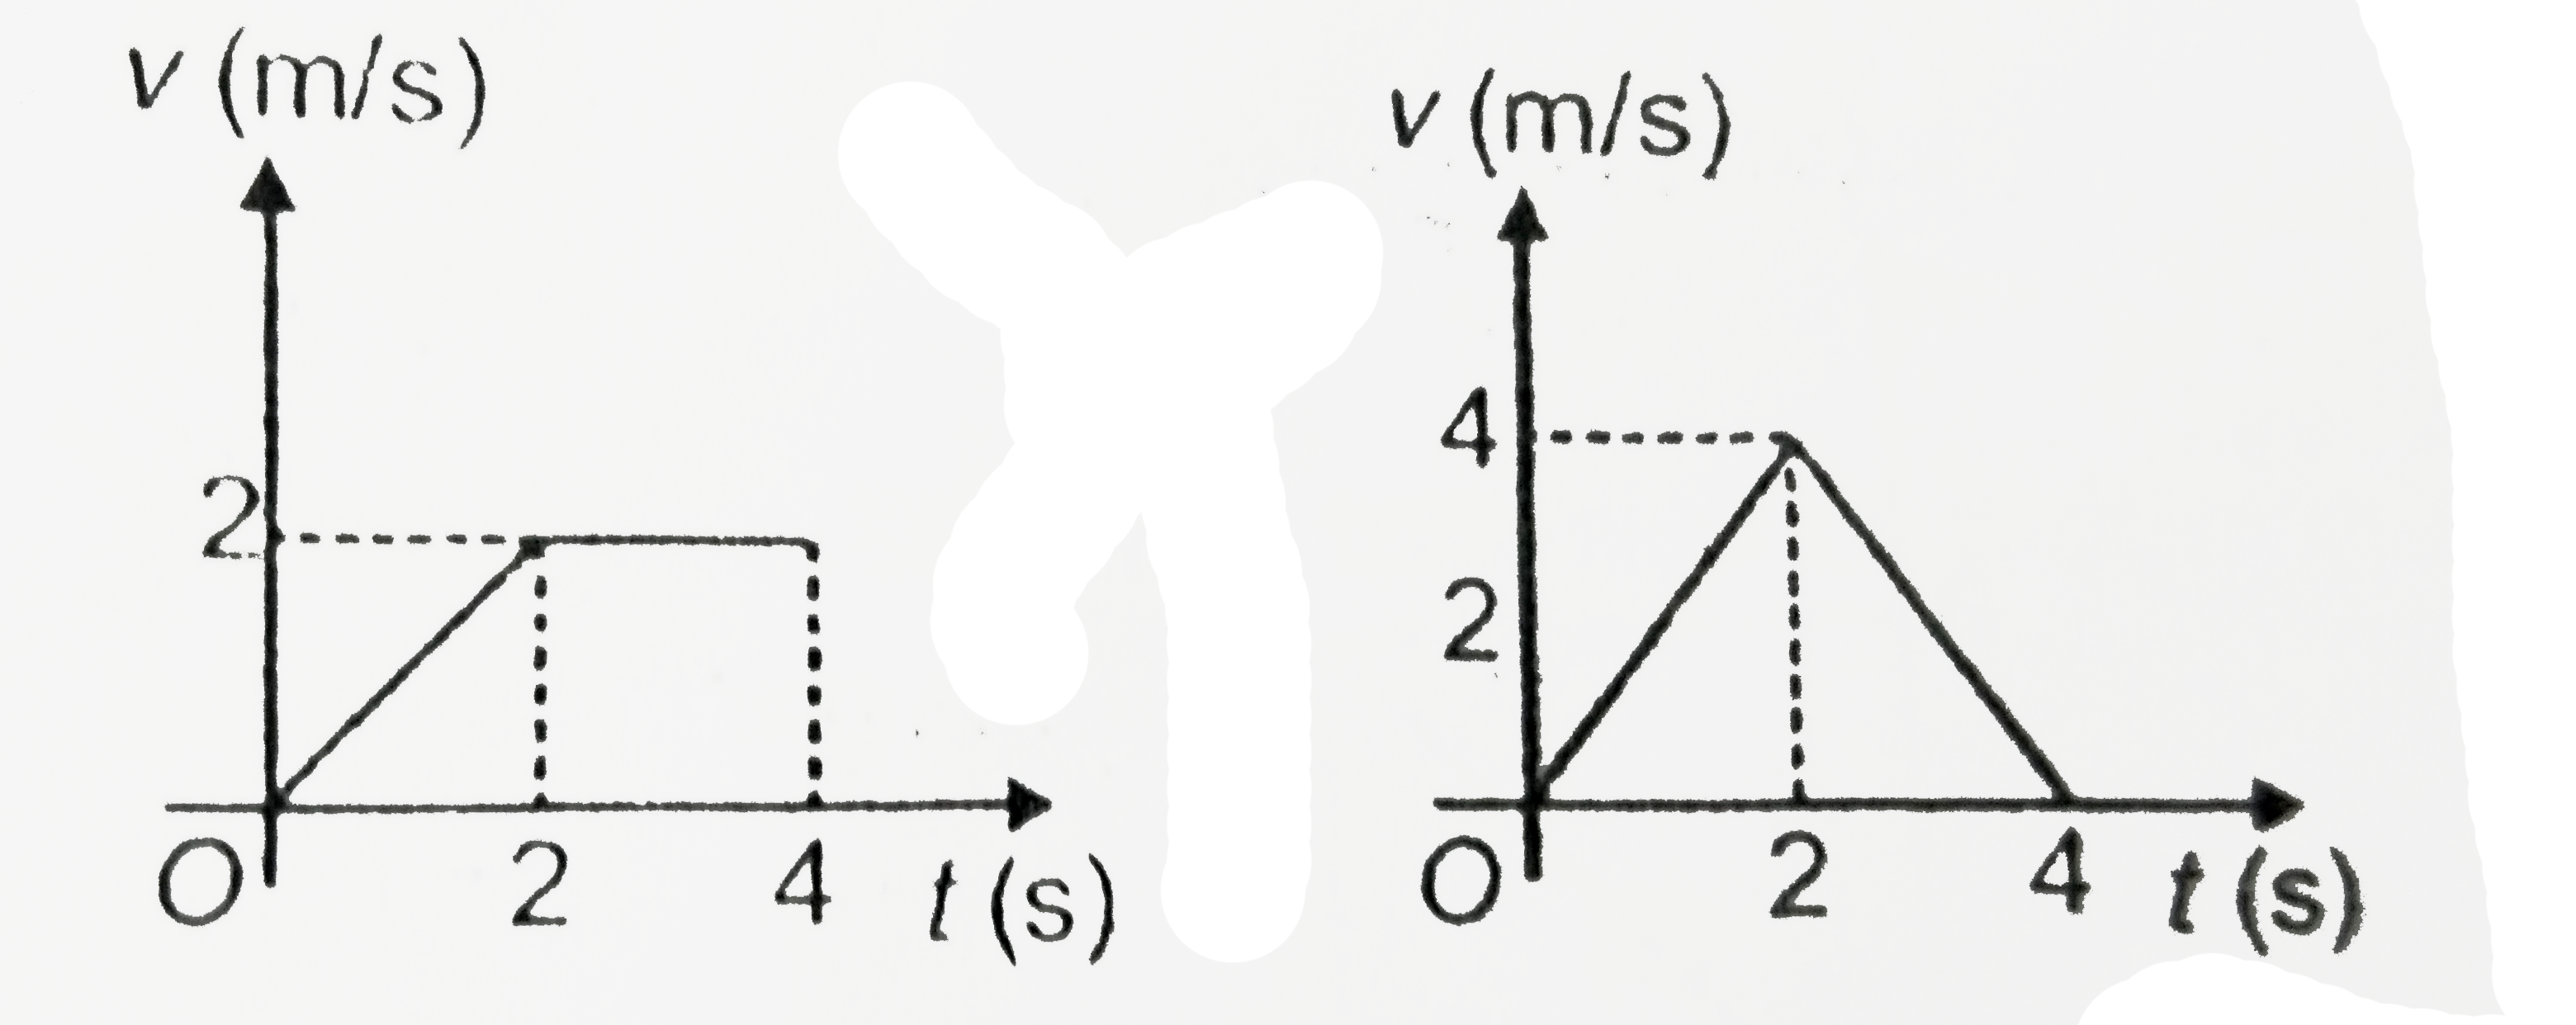
View SolutionThe velocity versus time graph of two particles moving along x-axis varies are shown in the following two plots. Then
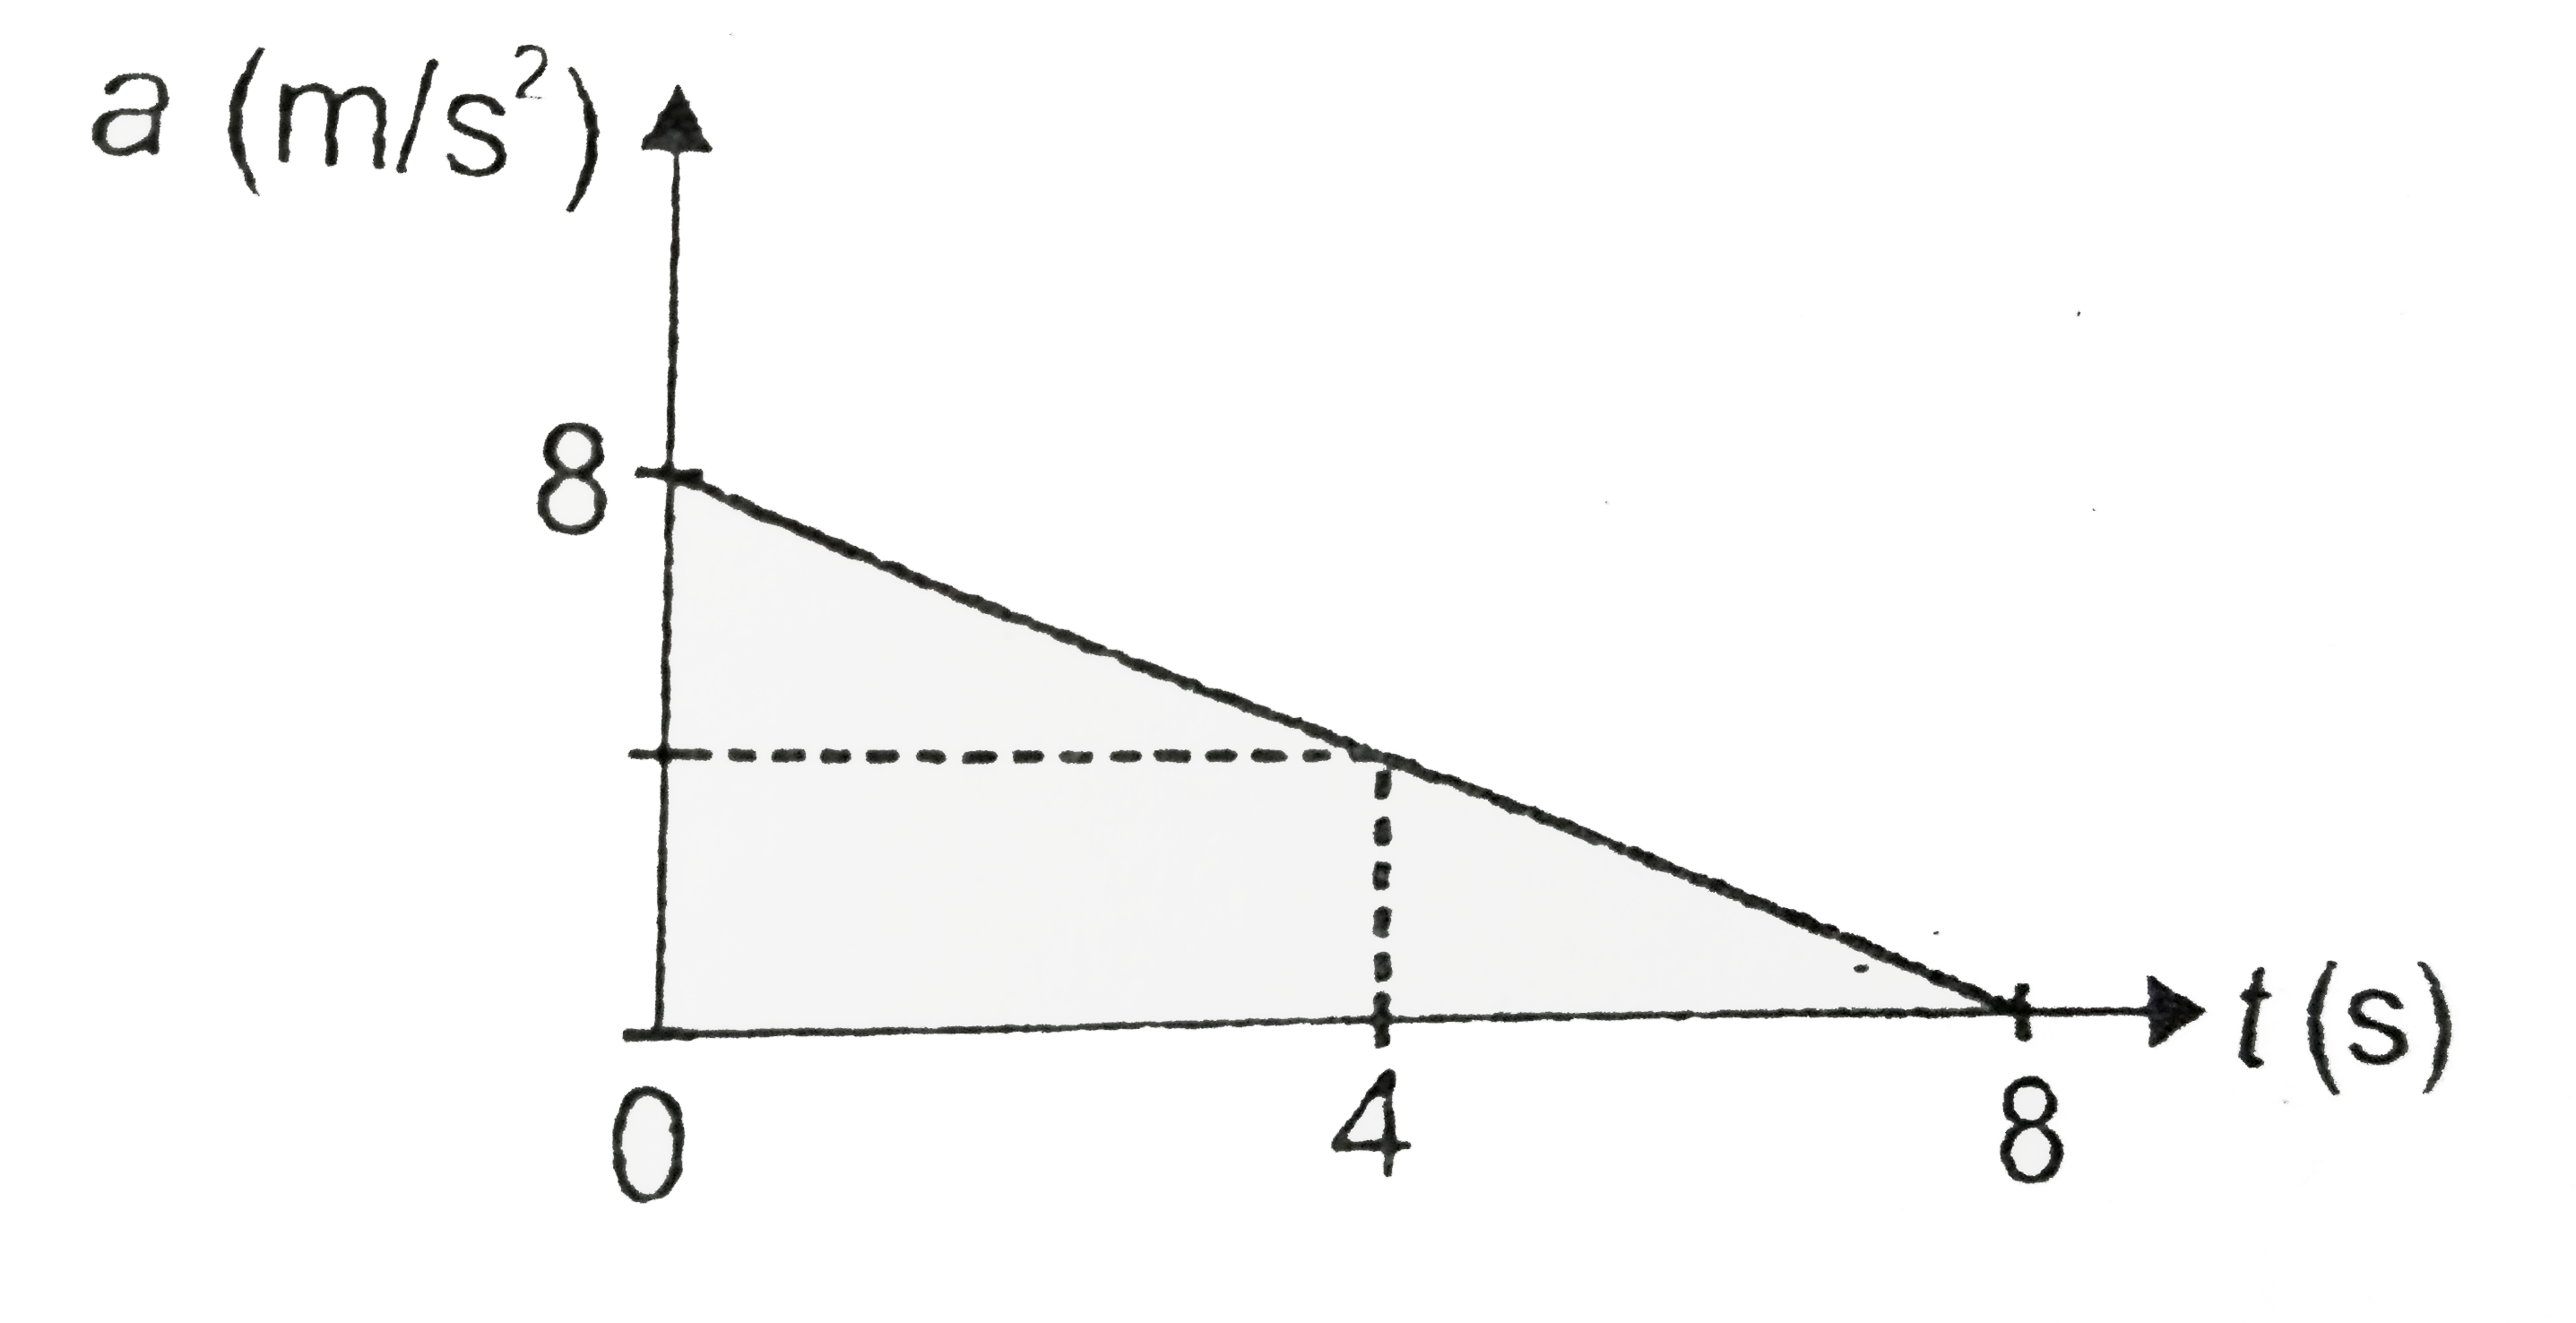
View SolutionThe acceleration-time graph of a particle moving along x-axis is shown in the figure. If the particle starts with velocity 3 m/s at t = 0, find the velocity of particle at t = 4 s.
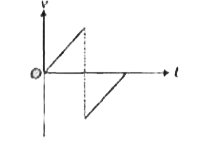
View SolutionThe velocity (v) - time (t) graph for a particle moving along x - axis is shown in the figure. The corresponding position (x) - time (t) is best represented by
View SolutionThe velocity-time graph of a particle in straight line motion is velocity-time graph of a particle in straight line motion is shown in. The particle starts its motion from origin.
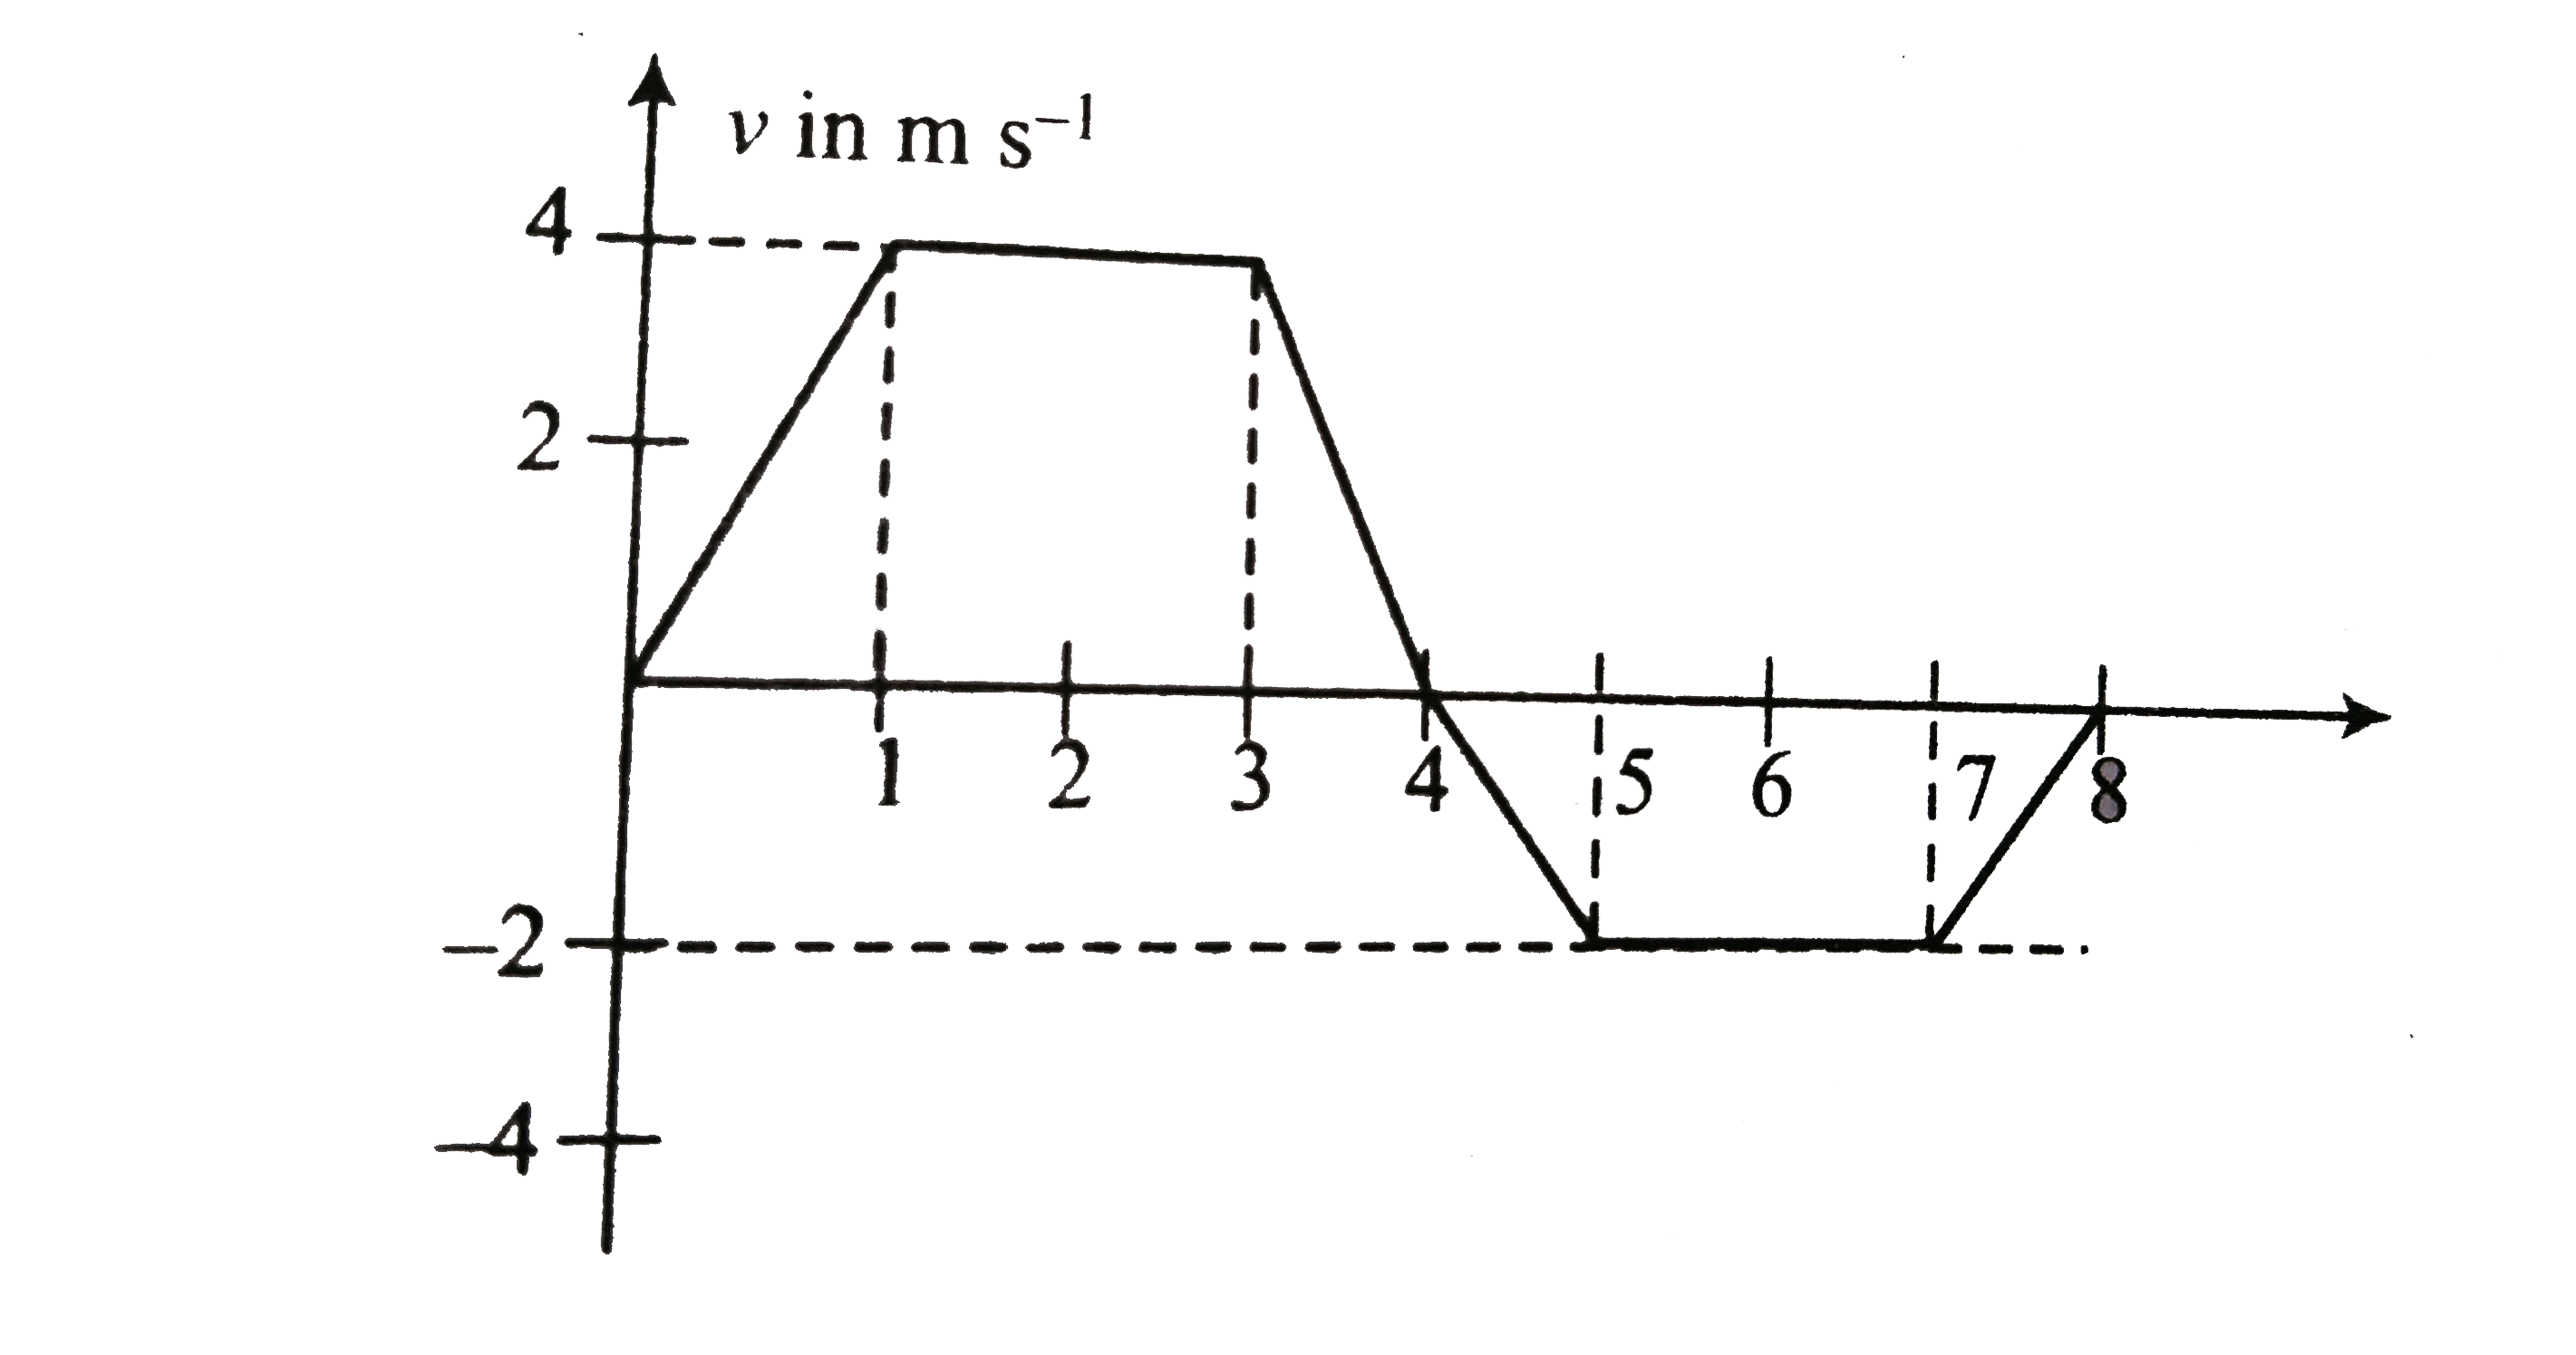 .
.
The distance of the particle from the origin after 8s is .
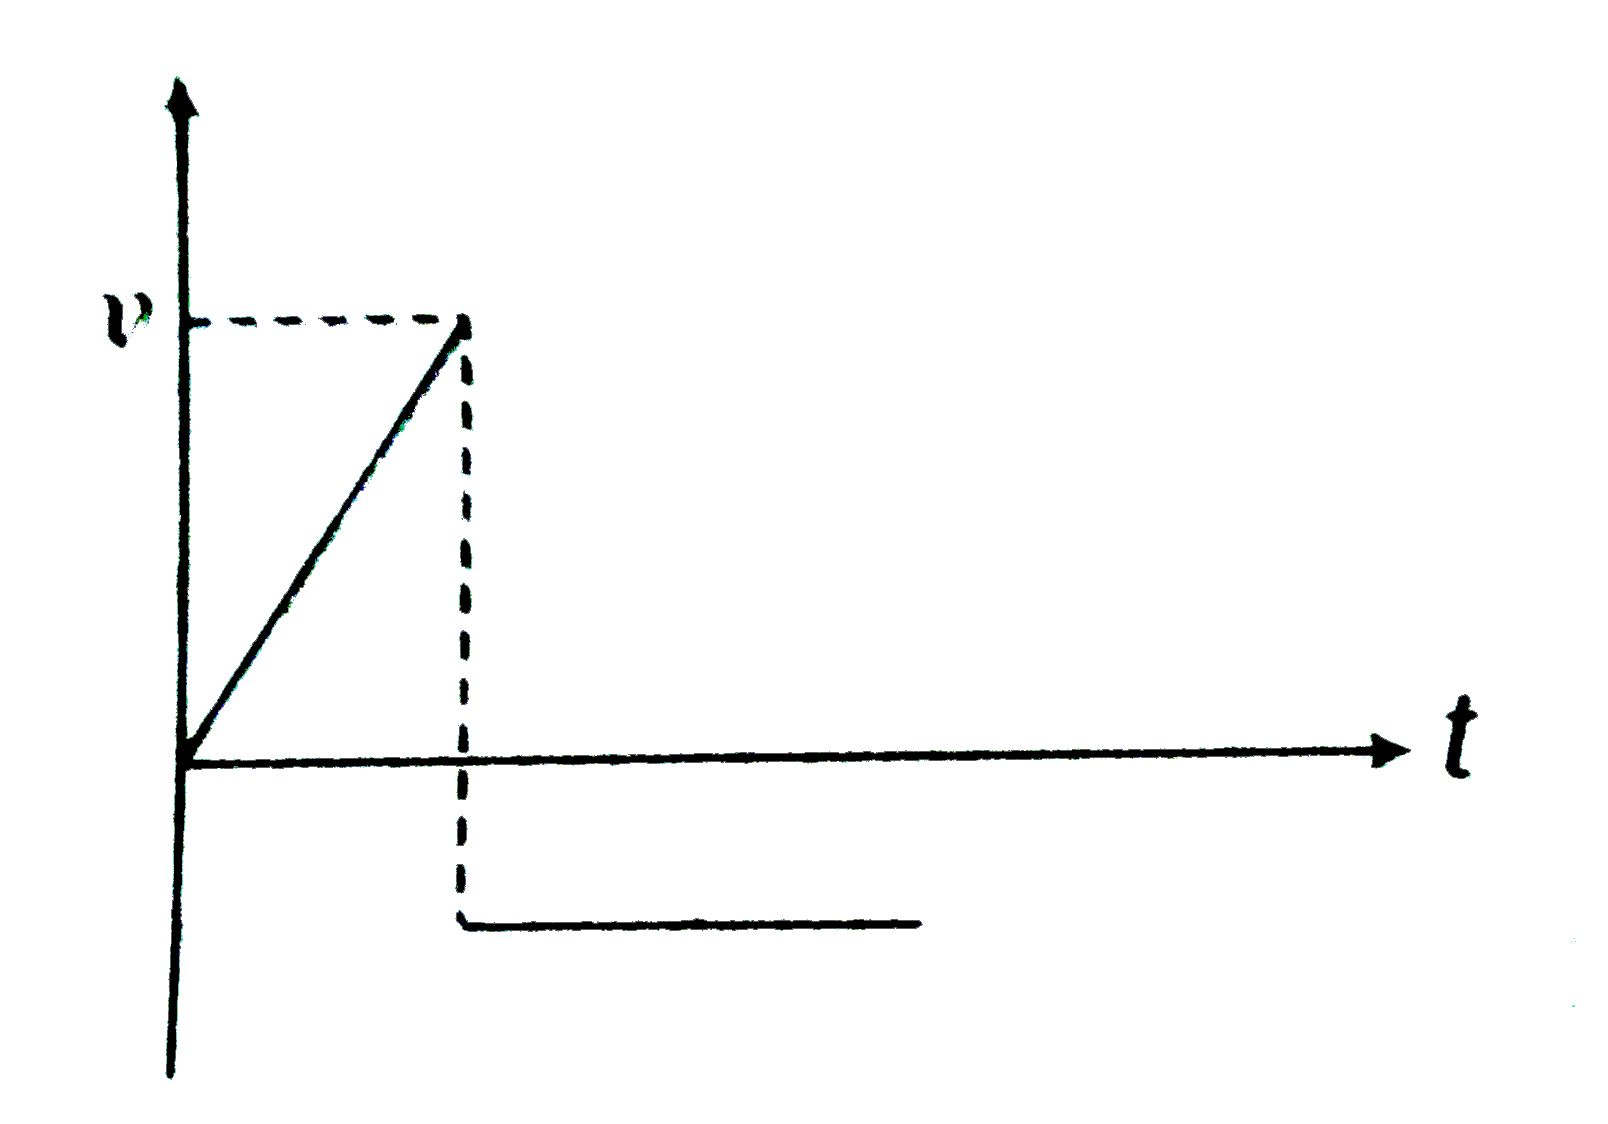
View SolutionThe velocity-time graph for a particle moving along X-axis is shown in the figure. The corresponding displacement-time graph is correctly shown by
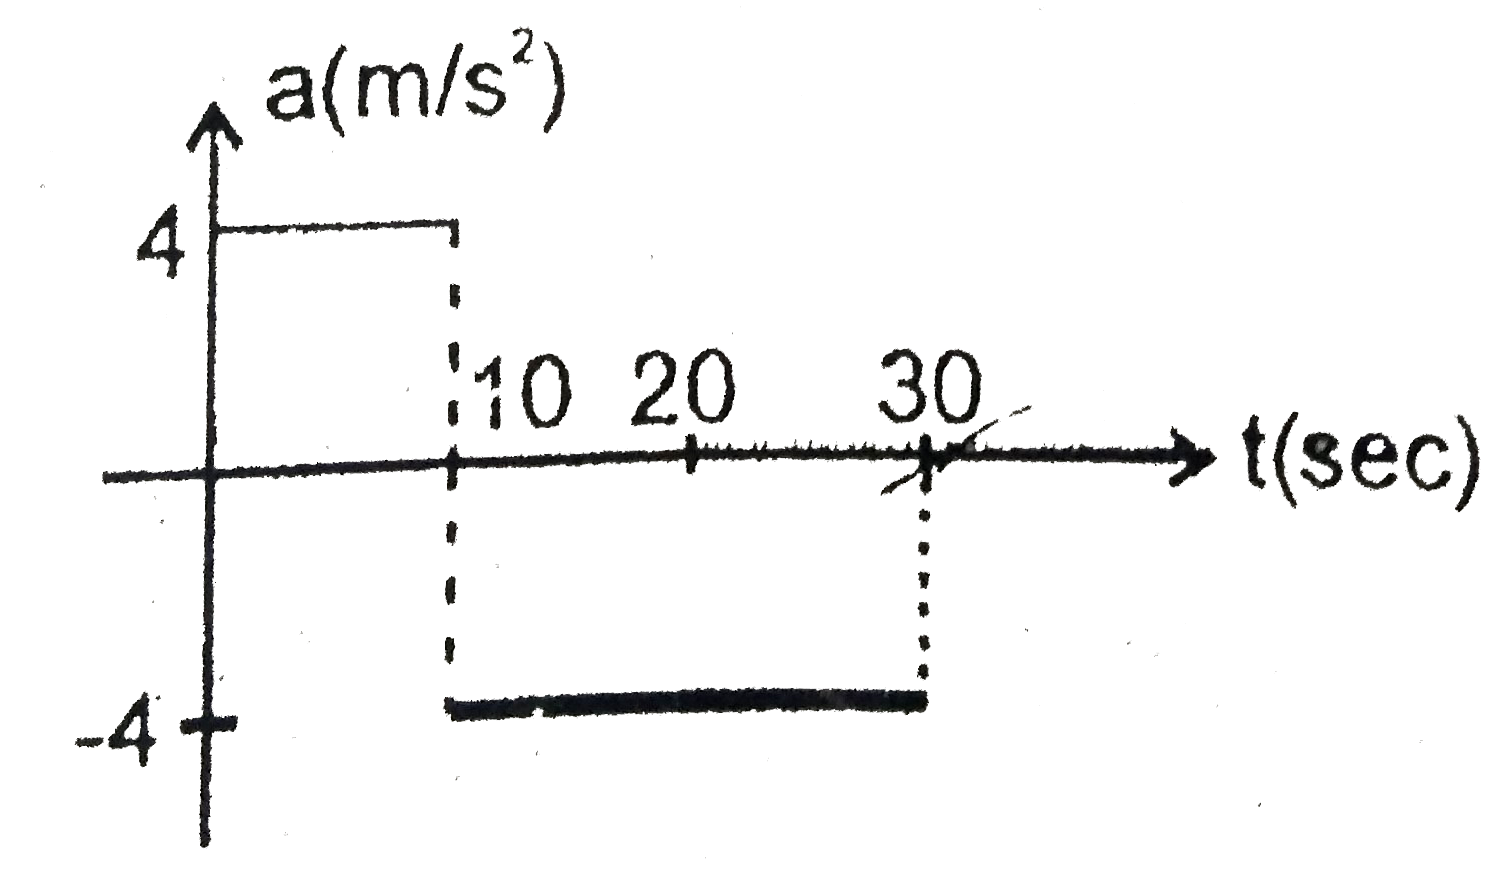
View SolutionThe acceleration versus time graph for a particle moving along a straight line is shown in the figure. If the particle starts from rest at t = 0, then its speed at t = 30 sec will be :
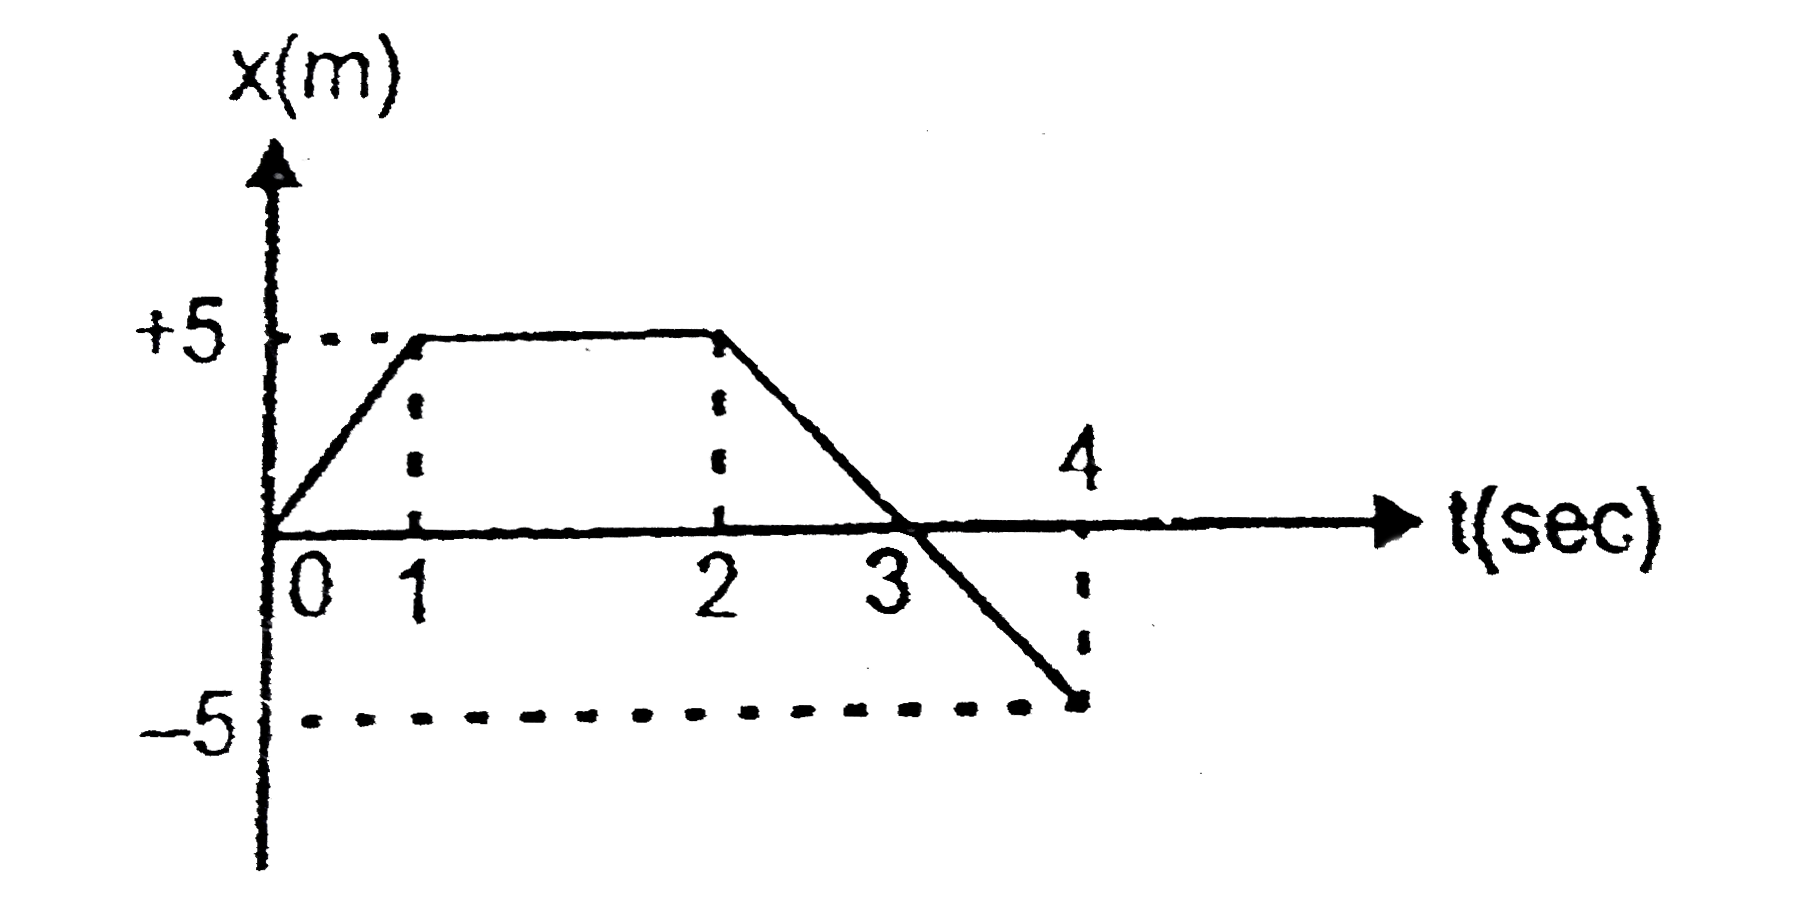
View SolutionPosition-time graph for a particle moving along x− direction is as shown in the figure. Average speed of the particle from t=0 to t=4 is :
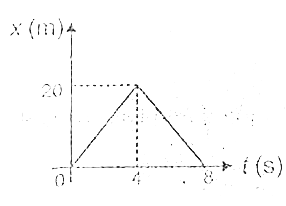
View SolutionThe position (X)-time (t) graph for a particle of mass 1 kg moving along x-axis is shown in figure. Find impulse on particle at t = 4 s.
View Solution
