Isothermal expansion from state A to B, isochoric pressure increment from B to C, isothermal contraction from C to D, isobaric contraction from D→A.
To solve the problem of plotting the PV diagram for the given thermodynamic processes, we will follow these steps:
Step 1: Identify the Processes
- Isothermal Expansion (A to B): The process occurs at constant temperature, and the volume increases.
- Isochoric Pressure Increment (B to C): The volume remains constant while the pressure increases.
- Isothermal Contraction (C to D): The process occurs at constant temperature, and the volume decreases.
- Isobaric Contraction (D to A): The pressure remains constant while the volume decreases.
Step 2: Plot Isothermal Expansion (A to B)
- On the PV diagram, plot point A at coordinates (V_A, P_A).
- Since this is an isothermal expansion, draw a curve from point A to point B where the volume increases and the pressure decreases. The curve should be a hyperbola, reflecting the relationship PV=nRT (constant temperature).
Step 3: Plot Isochoric Pressure Increment (B to C)
- From point B, draw a vertical line upwards to point C. This represents the isochoric process where the volume remains constant (V_B = V_C) and the pressure increases from P_B to P_C.
Step 4: Plot Isothermal Contraction (C to D)
- From point C, draw a curve downwards to point D. This is the isothermal contraction where the volume decreases while the temperature remains constant. The curve should again resemble a hyperbola, similar to the expansion but in the opposite direction.
Step 5: Plot Isobaric Contraction (D to A)
- From point D, draw a horizontal line to the left back to point A. This represents the isobaric contraction where the pressure remains constant (P_D = P_A) and the volume decreases from V_D to V_A.
Step 6: Label the Points
- Clearly label the points A, B, C, and D on the graph to indicate the states of the system during the transitions.
Final PV Diagram
- The final diagram will consist of:
- A hyperbolic curve from A to B (isothermal expansion).
- A vertical line from B to C (isochoric).
- A hyperbolic curve from C to D (isothermal contraction).
- A horizontal line from D to A (isobaric contraction).
- Isothermal Expansion (A to B): The process occurs at constant temperature, and the volume increases.
- Isochoric Pressure Increment (B to C): The volume remains constant while the pressure increases.
- Isothermal Contraction (C to D): The process occurs at constant temperature, and the volume decreases.
- Isobaric Contraction (D to A): The pressure remains constant while the volume decreases.
- On the PV diagram, plot point A at coordinates (V_A, P_A).
- Since this is an isothermal expansion, draw a curve from point A to point B where the volume increases and the pressure decreases. The curve should be a hyperbola, reflecting the relationship PV=nRT (constant temperature).
- From point B, draw a vertical line upwards to point C. This represents the isochoric process where the volume remains constant (V_B = V_C) and the pressure increases from P_B to P_C.
- From point C, draw a curve downwards to point D. This is the isothermal contraction where the volume decreases while the temperature remains constant. The curve should again resemble a hyperbola, similar to the expansion but in the opposite direction.
- From point D, draw a horizontal line to the left back to point A. This represents the isobaric contraction where the pressure remains constant (P_D = P_A) and the volume decreases from V_D to V_A.
- Clearly label the points A, B, C, and D on the graph to indicate the states of the system during the transitions.
- The final diagram will consist of:
- A hyperbolic curve from A to B (isothermal expansion).
- A vertical line from B to C (isochoric).
- A hyperbolic curve from C to D (isothermal contraction).
- A horizontal line from D to A (isobaric contraction).
Topper's Solved these Questions
- THERMODYNAMICSBOOK - RESONANCE ENGLISHCHAPTER - THERMODYNAMICSEXERCISE - B-2
1 Videos
- THERMODYNAMICSBOOK - RESONANCE ENGLISHCHAPTER - THERMODYNAMICSEXERCISE - B-3
1 Videos
- THERMODYNAMICSBOOK - RESONANCE ENGLISHCHAPTER - THERMODYNAMICSEXERCISE - A-3
1 Videos
- TEST SERIESBOOK - RESONANCE ENGLISHCHAPTER - TEST SERIESEXERCISE - CHEMISTRY
50 Videos
Similar Questions
Knowledge Check
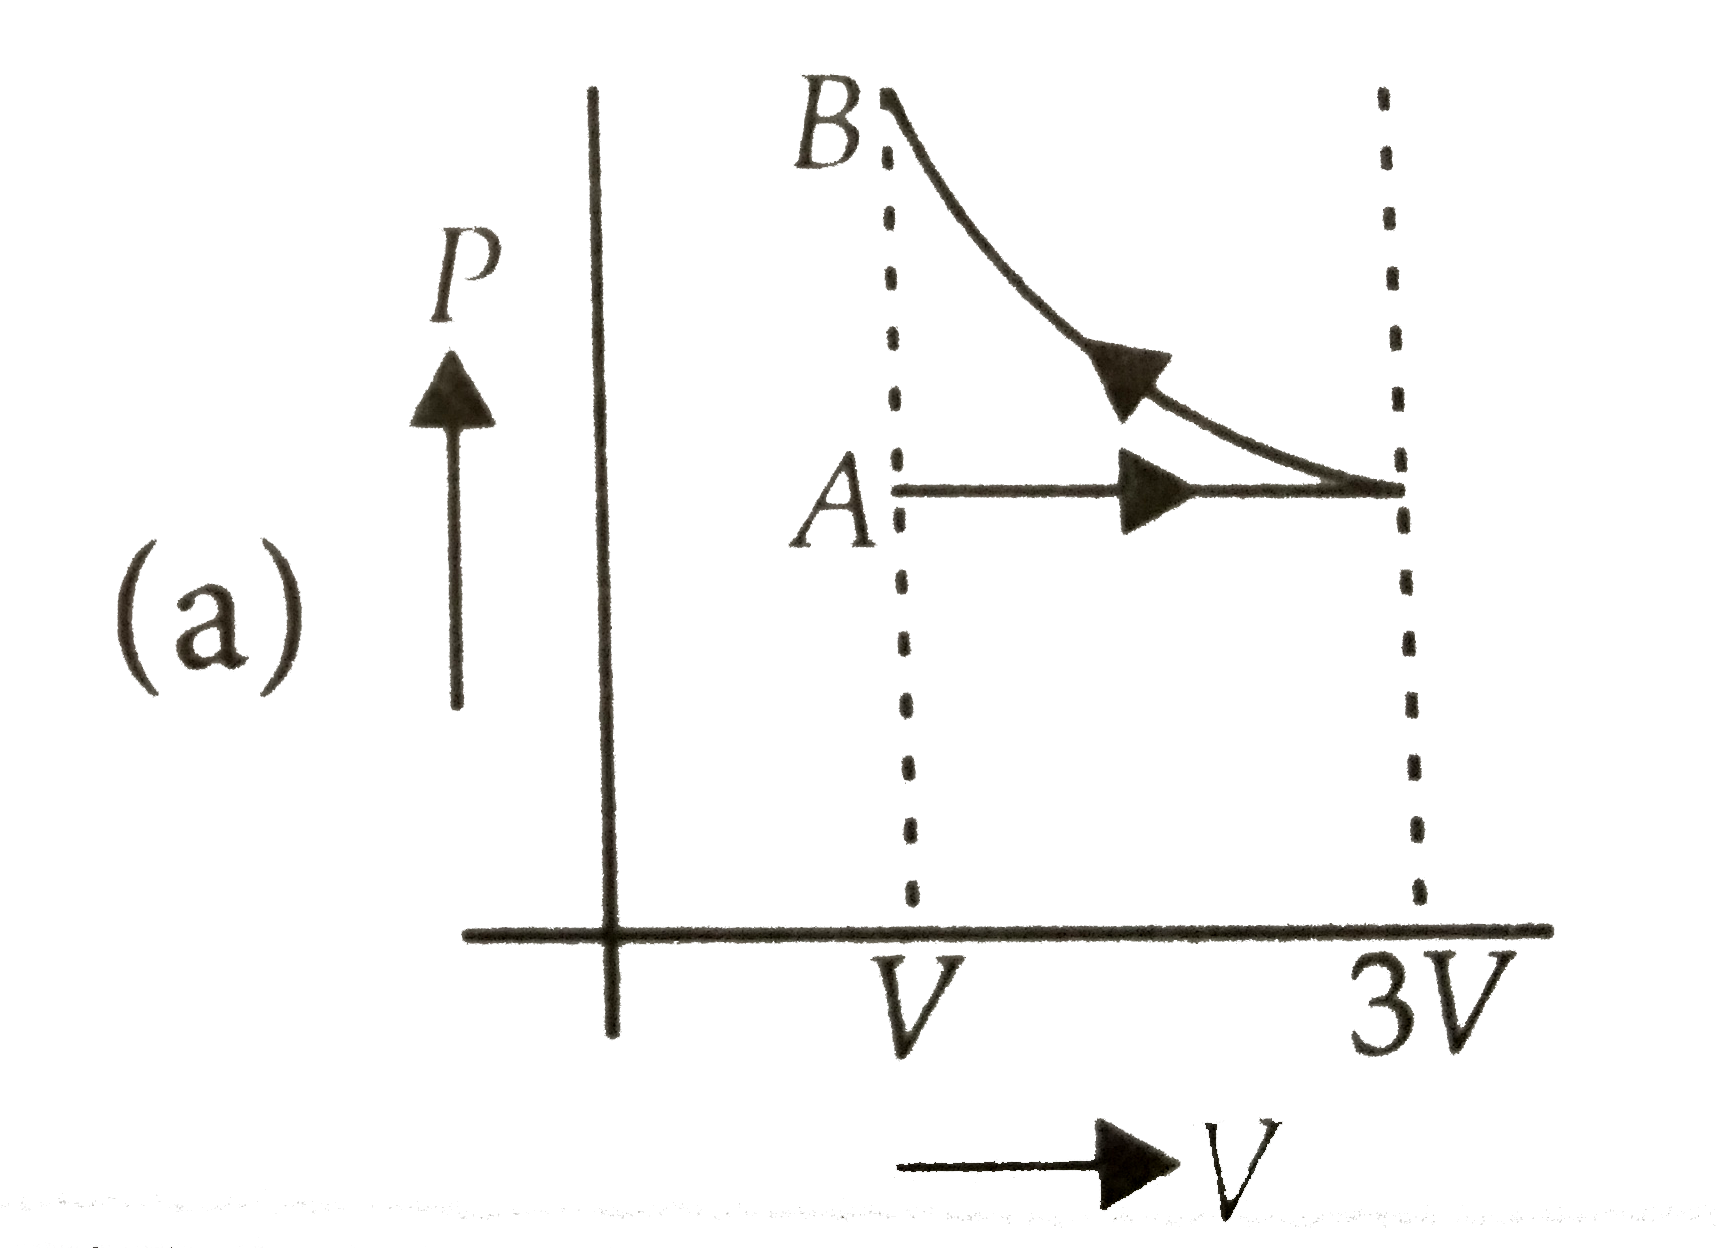
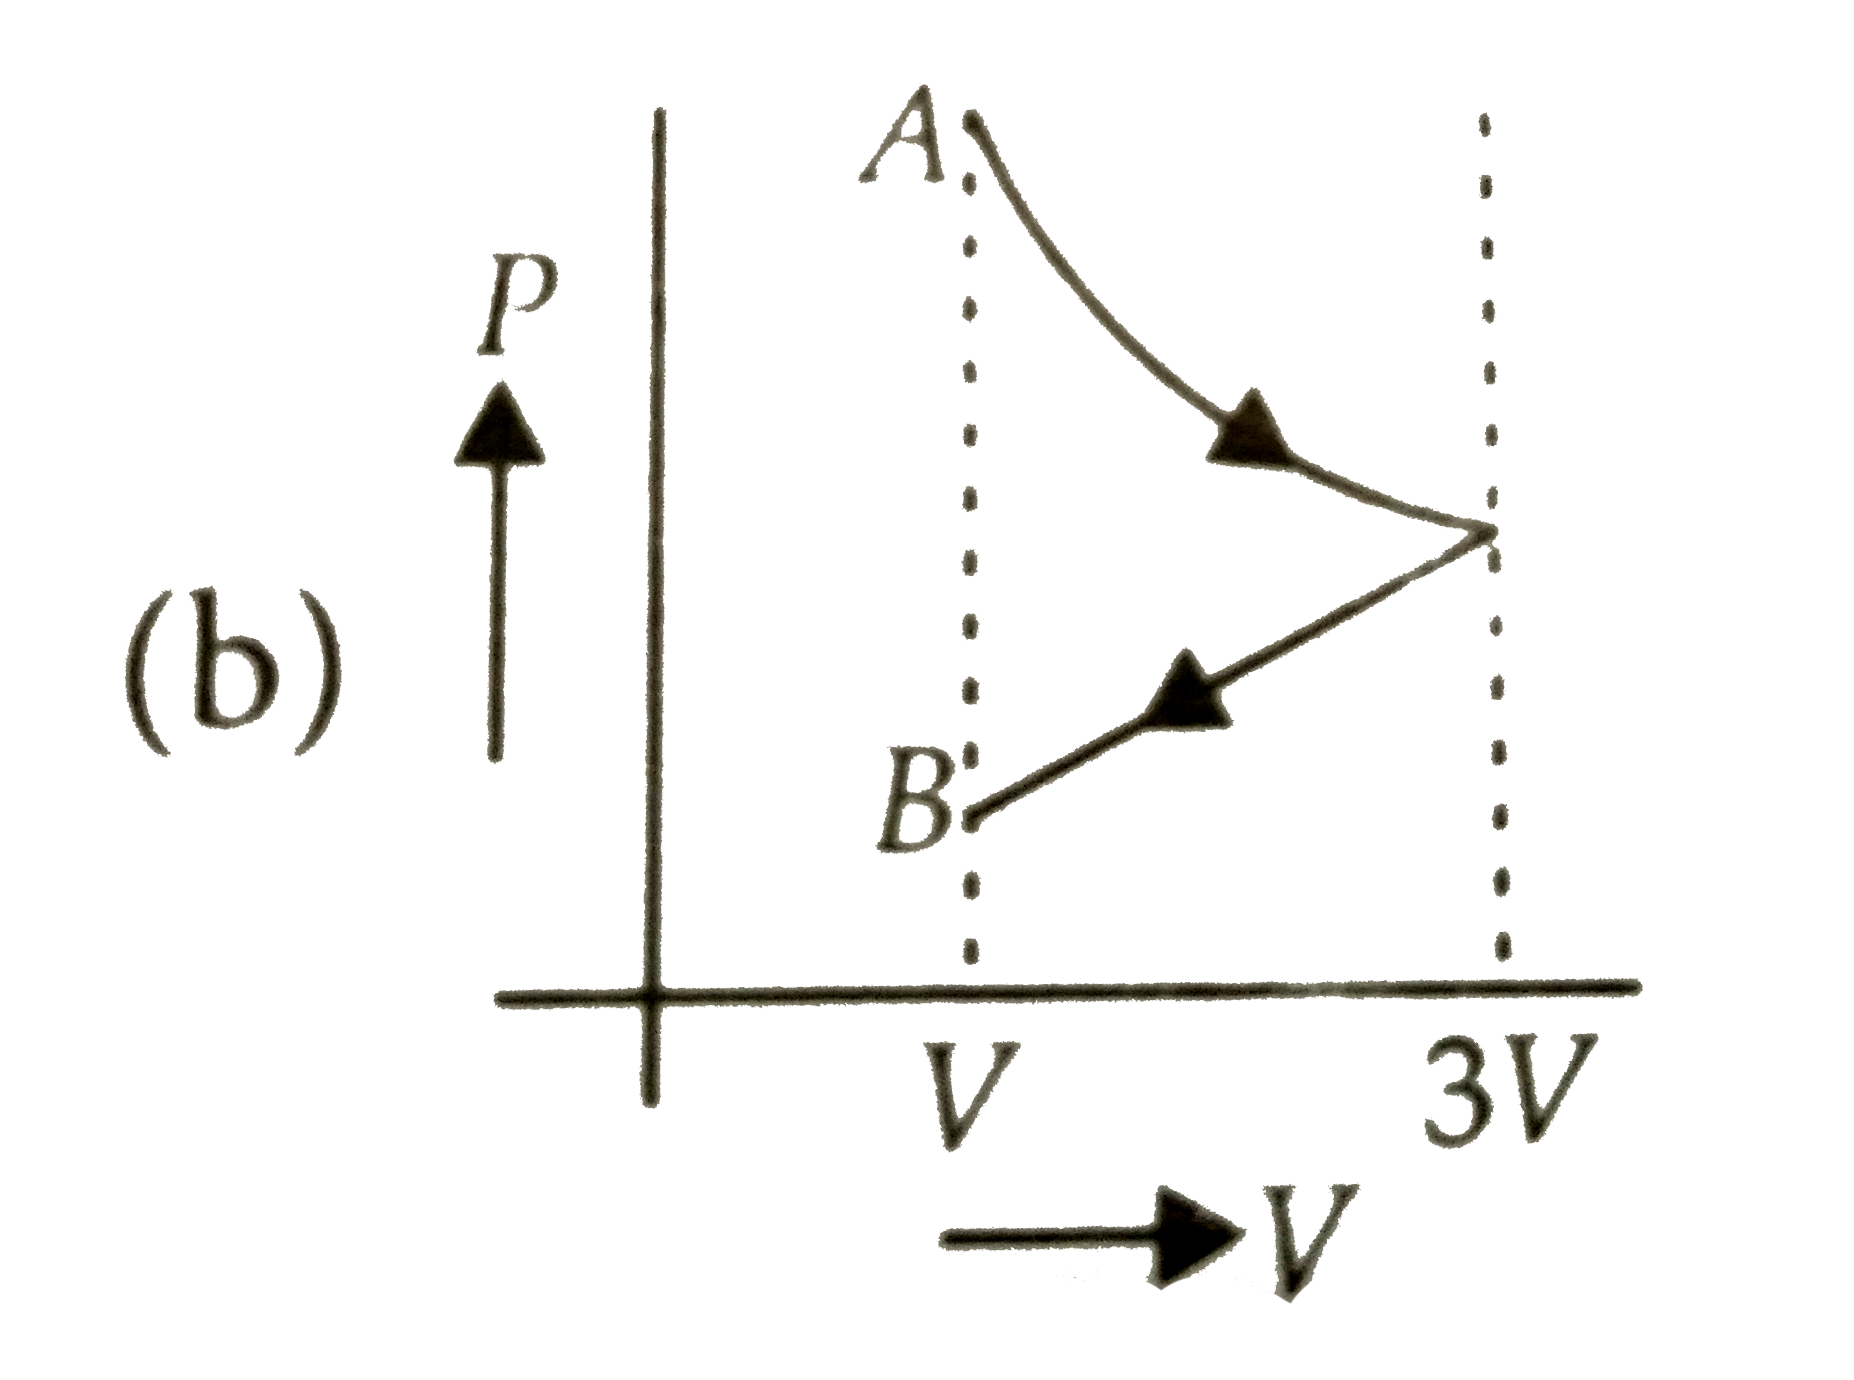
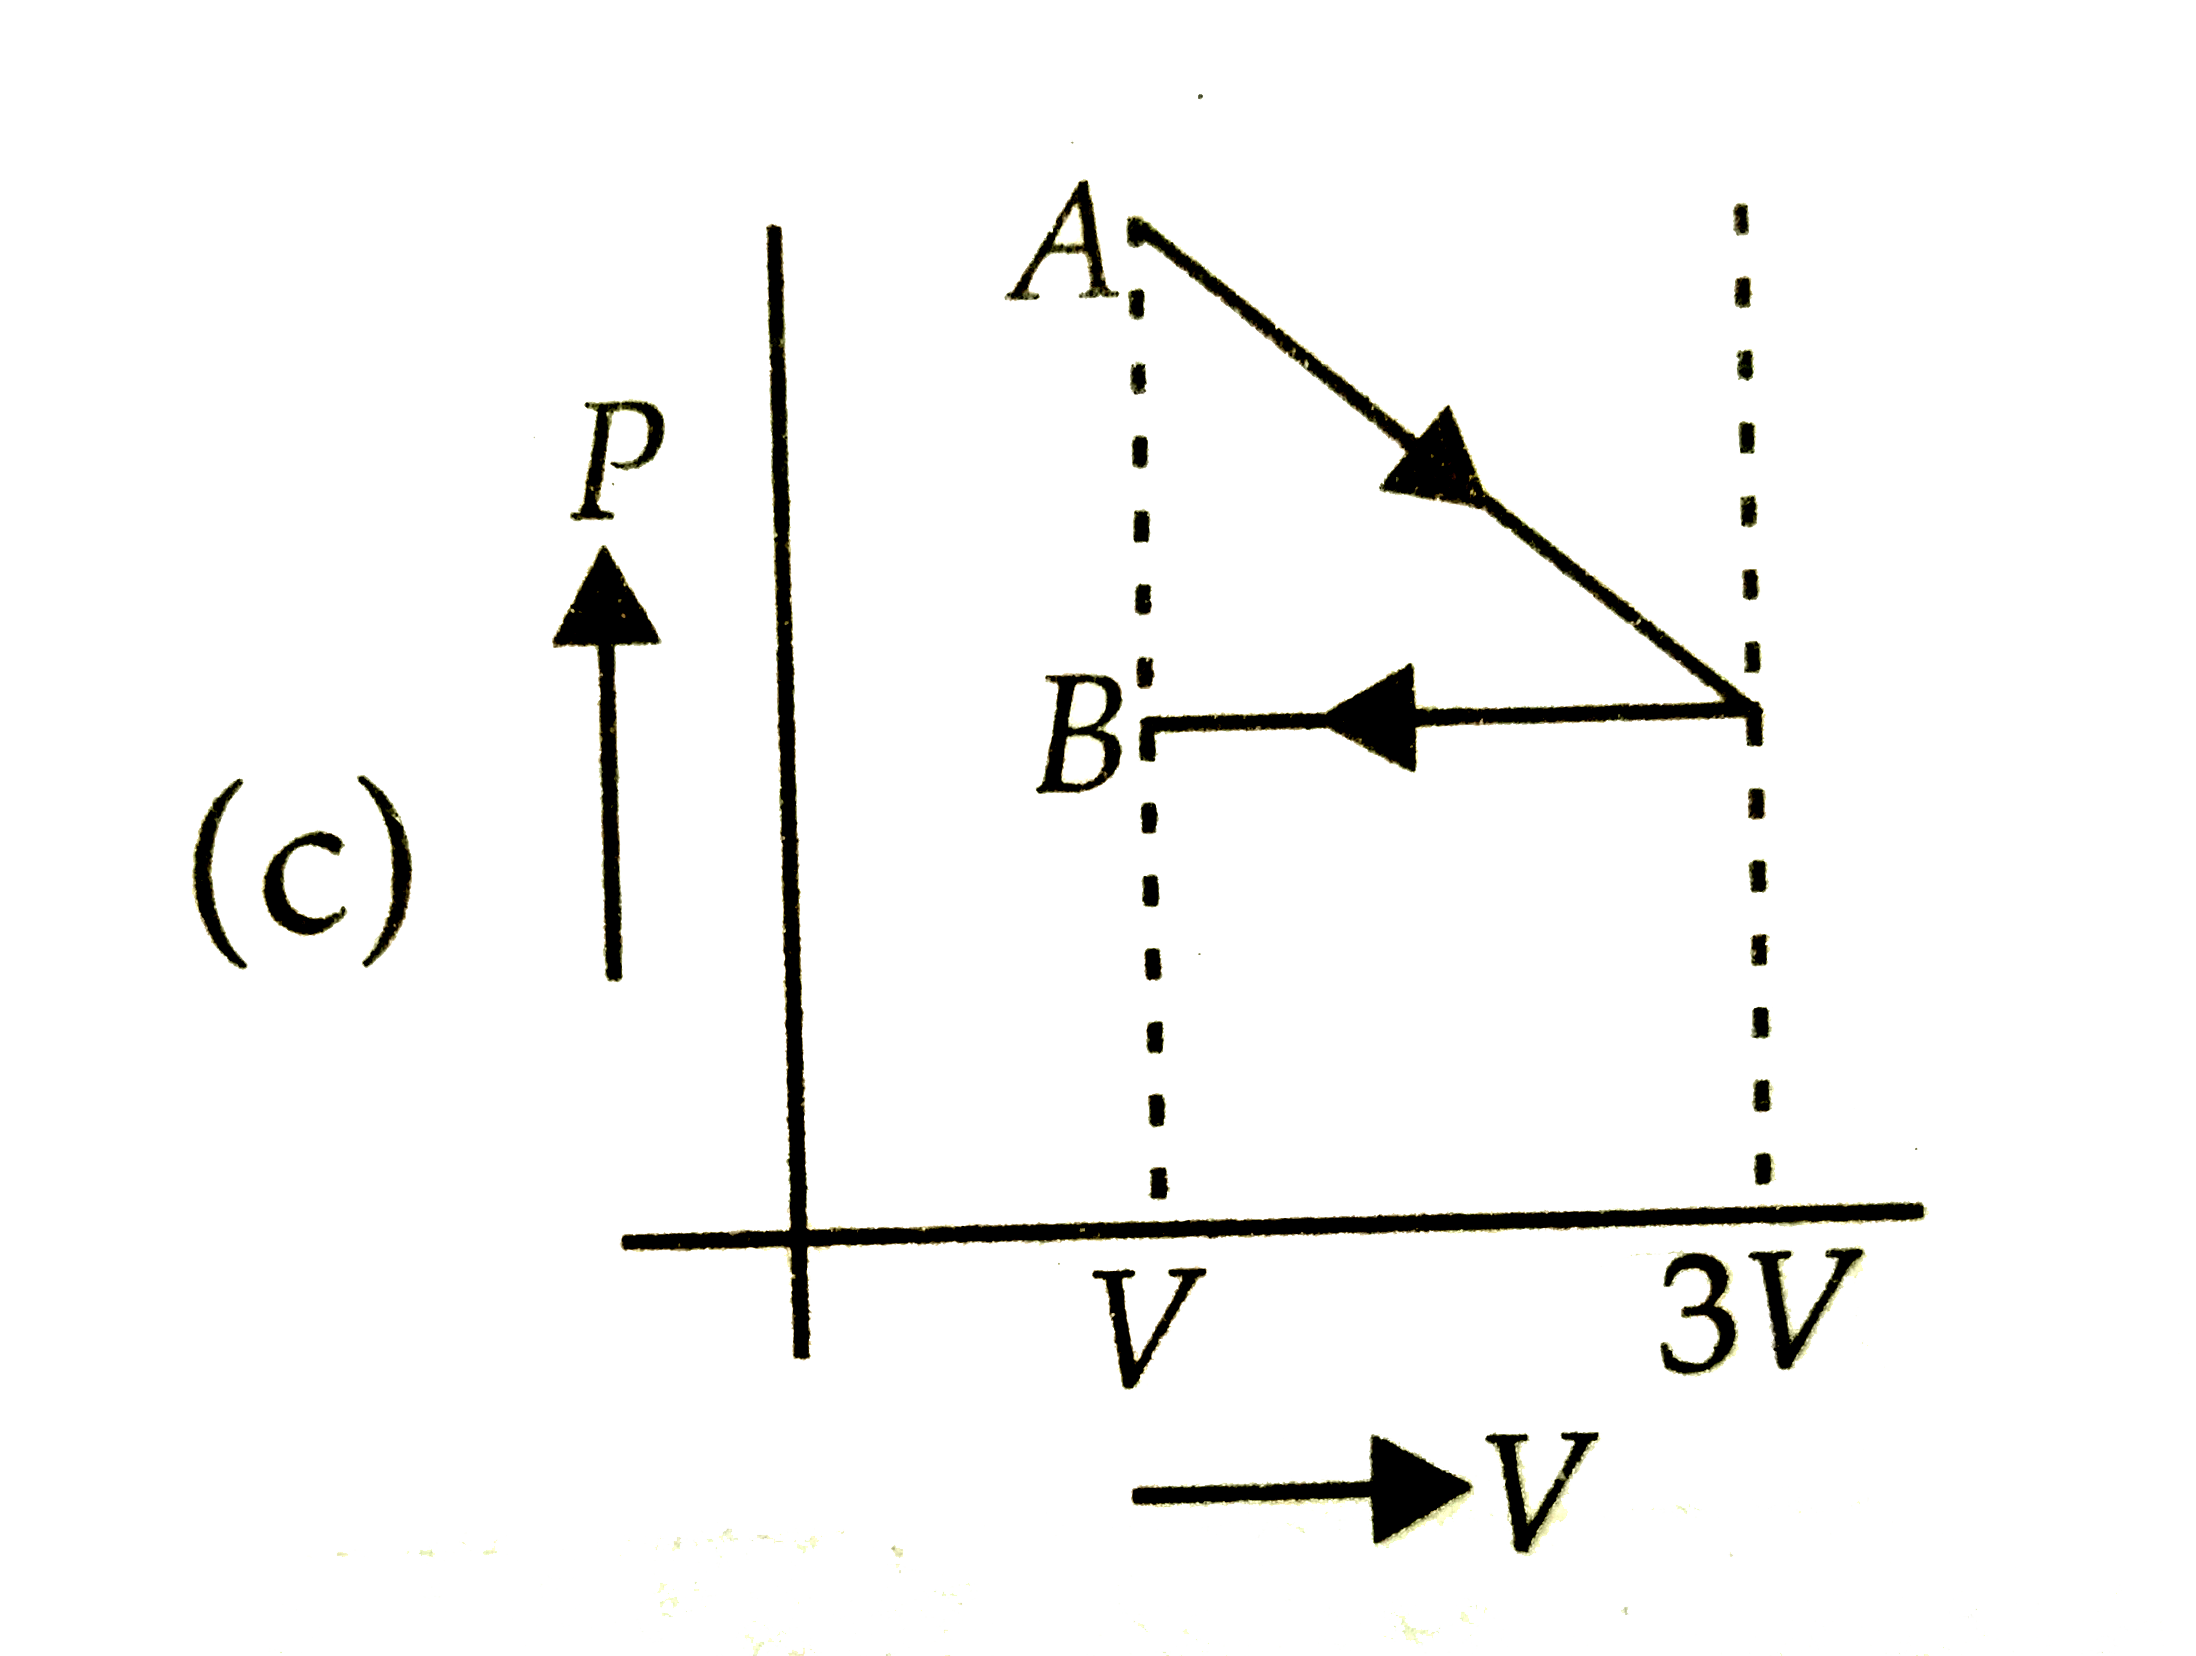
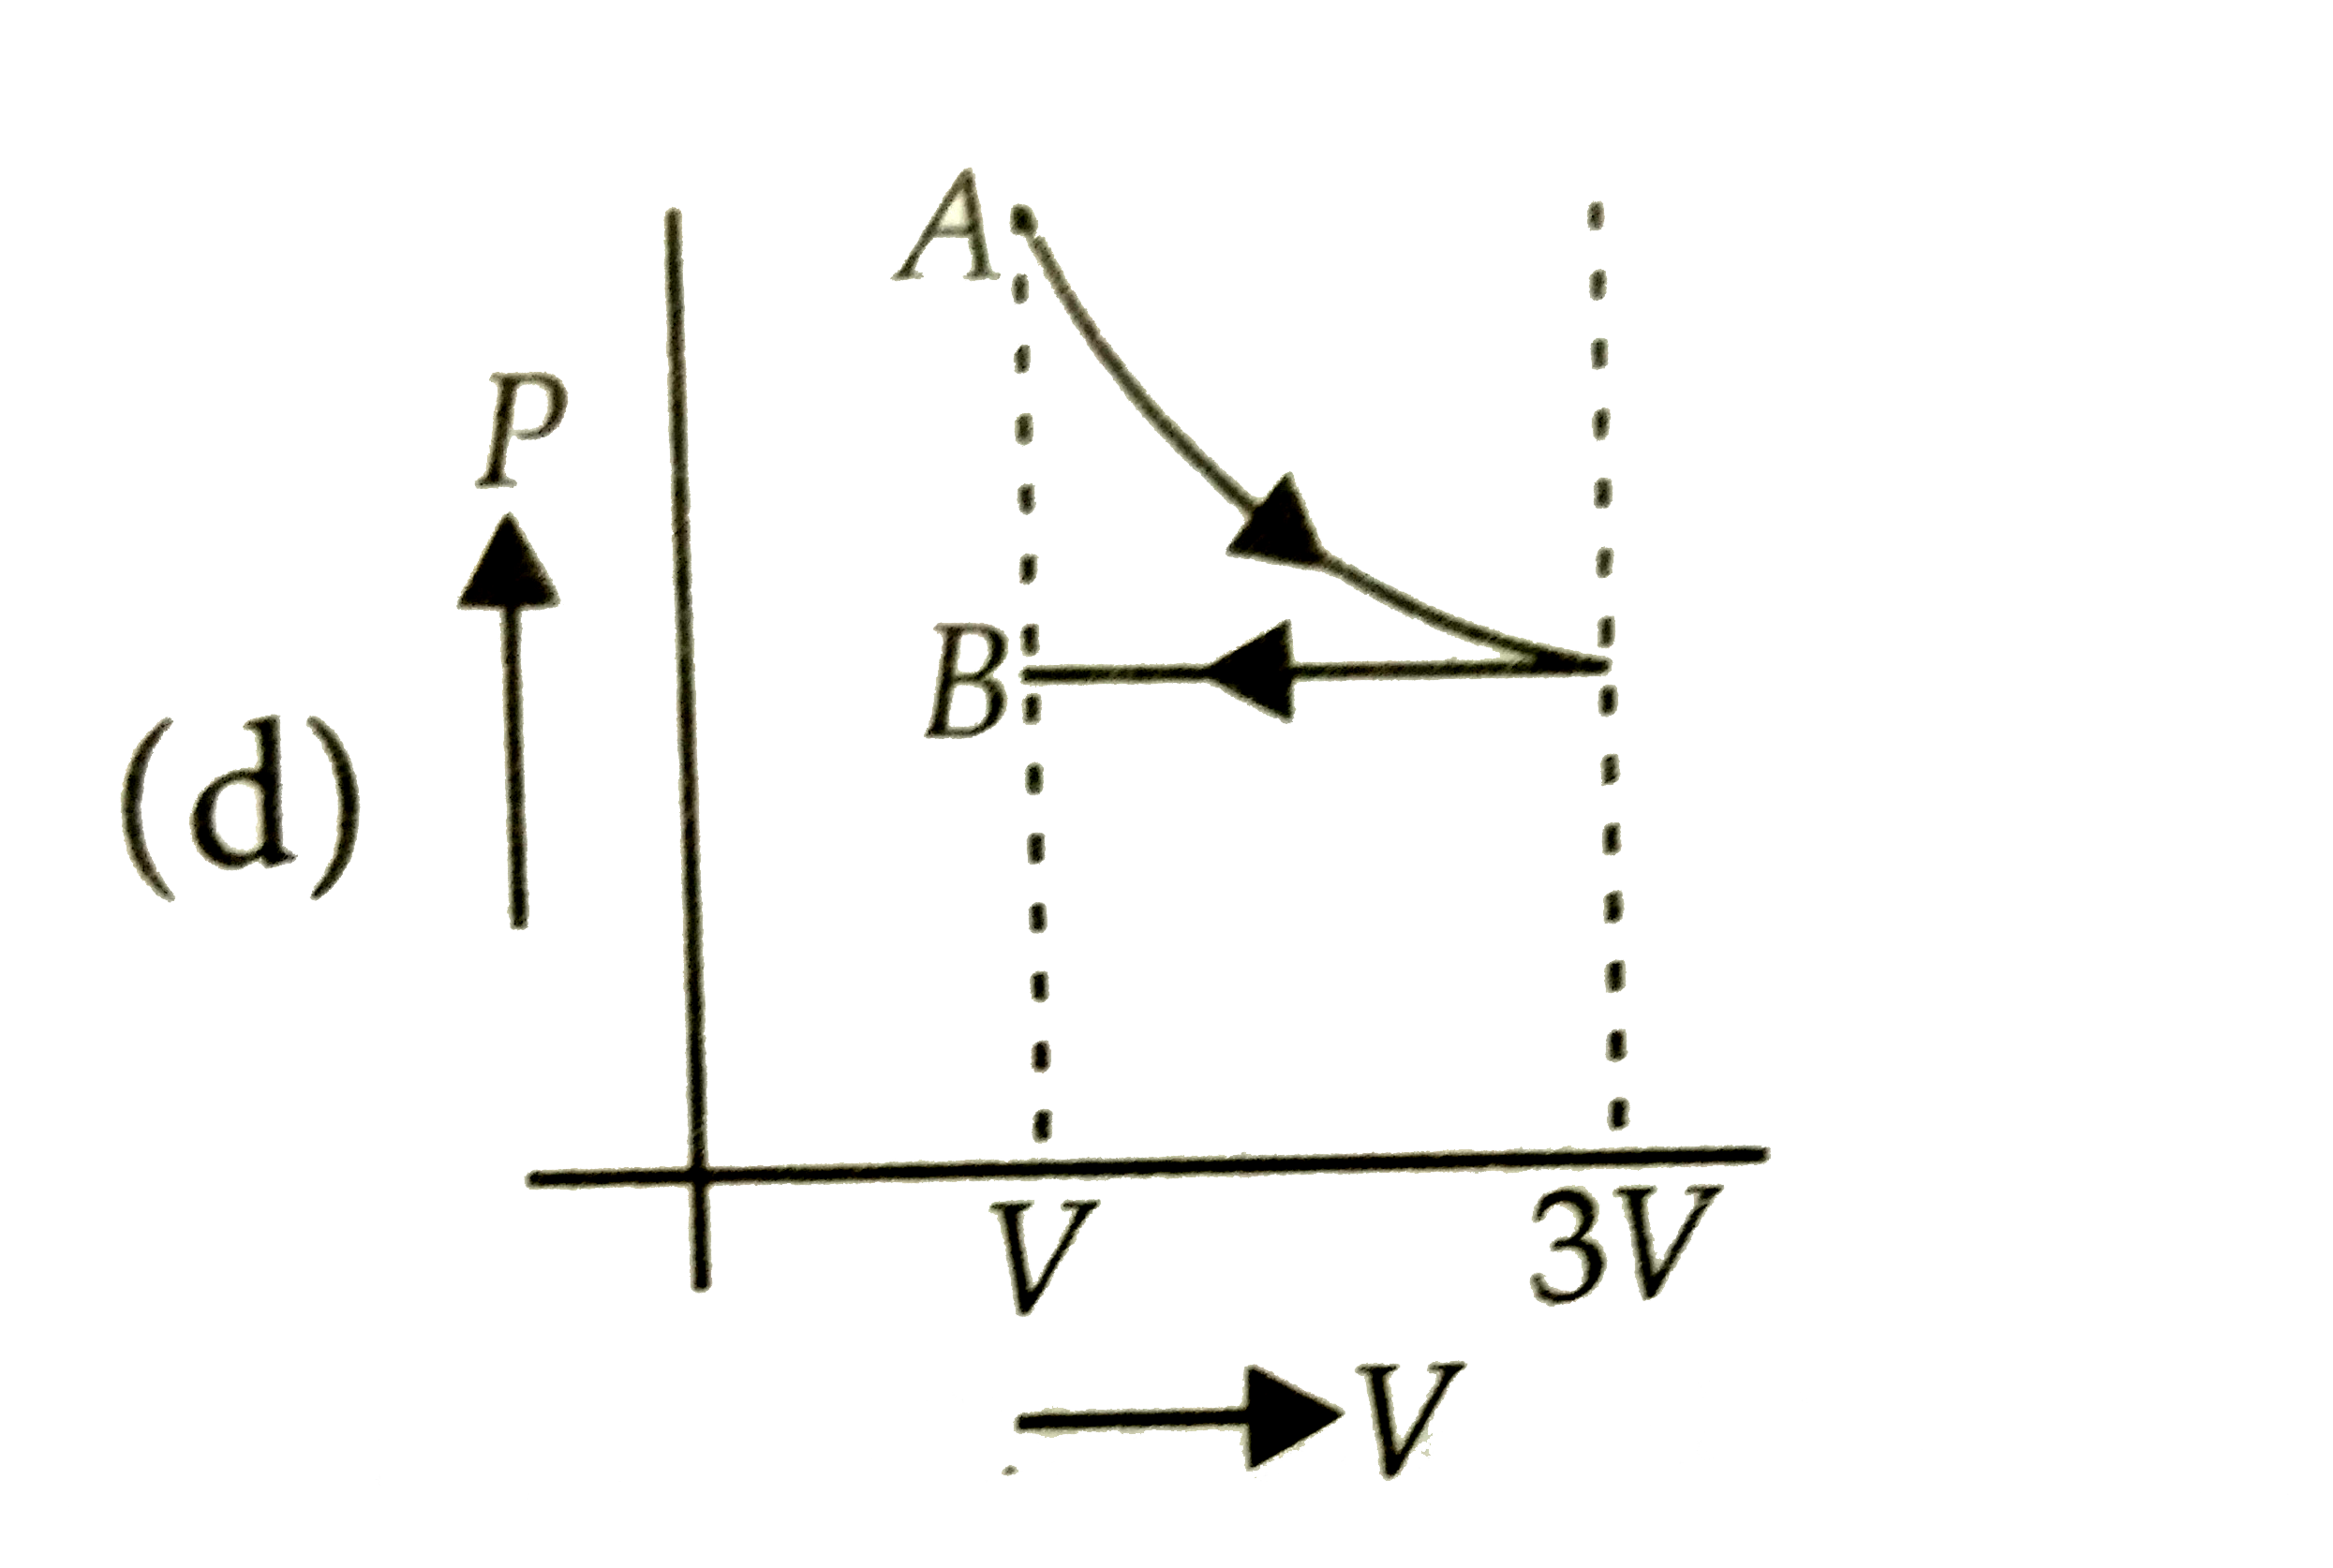
One mole of an ideal gas goes from an initial state A to final state B via two processs : It first undergoes isothermal expansion from volume V to 3V and then its volume is reduced from 3V to V at constant pressure. The correct P−V diagram representing the two process in (figure)
A B
B C
C D
D
The eye ball protrudes from the orbit with the contraction of
View SolutionForceful expiration results from a forceful contraction of diaphragm.
View SolutionIf R is a relation from a set A to a set B and S is a relation from B to a set C, then the relation SoR a) is from A to C b) is from C to A c) does not exist d) None of these
View SolutionActinoid contraction is greater from element to element than lanthanoid contraction Why?
View SolutionA body is falling freely from a point A at certain height from the ground and passes through point B, C and D (vertically as shown) so that BC=CD. The time taken by the particle to move from B to C is 2 seconds and from C to D 1 second. Time taken to move from A to B in second is

View SolutionThe carnot cycle of a reversible heat engine consist of
A. one isothermal and two adiabatic processes
B. Two isobaric and one adiabatic processes
C. Two isothermal and two adiabatic processes
D. Two isobraic and two isothermal processes
View SolutionThe pressure of a gas kept in an isothermal container is 200Kpa. If half the gas is removed from it, the pressure will be
View Solution
