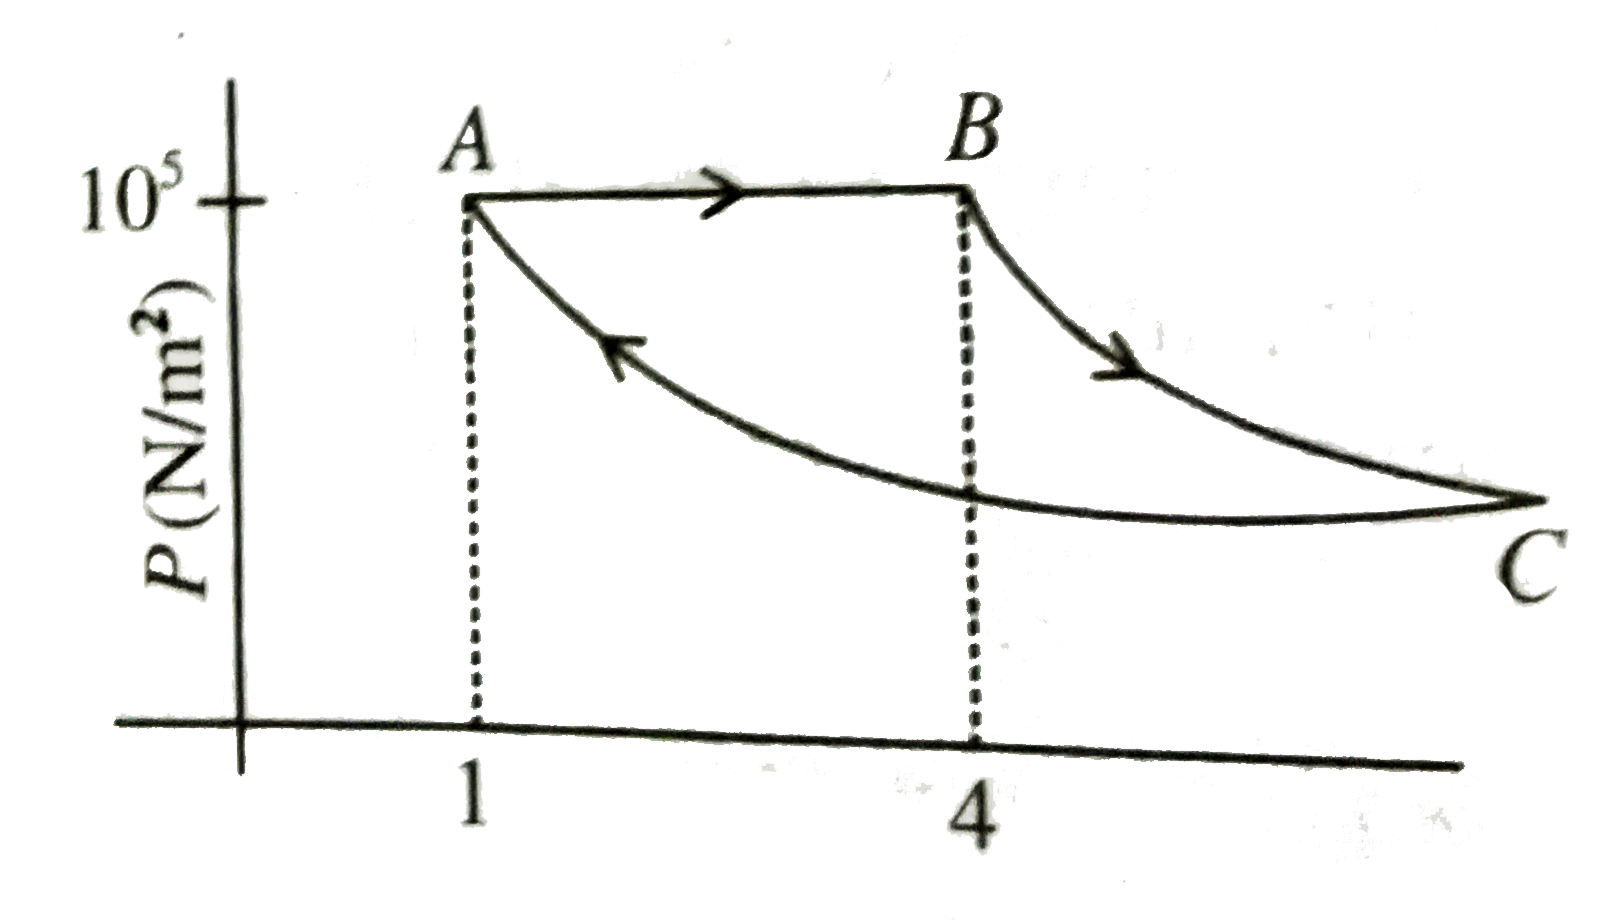
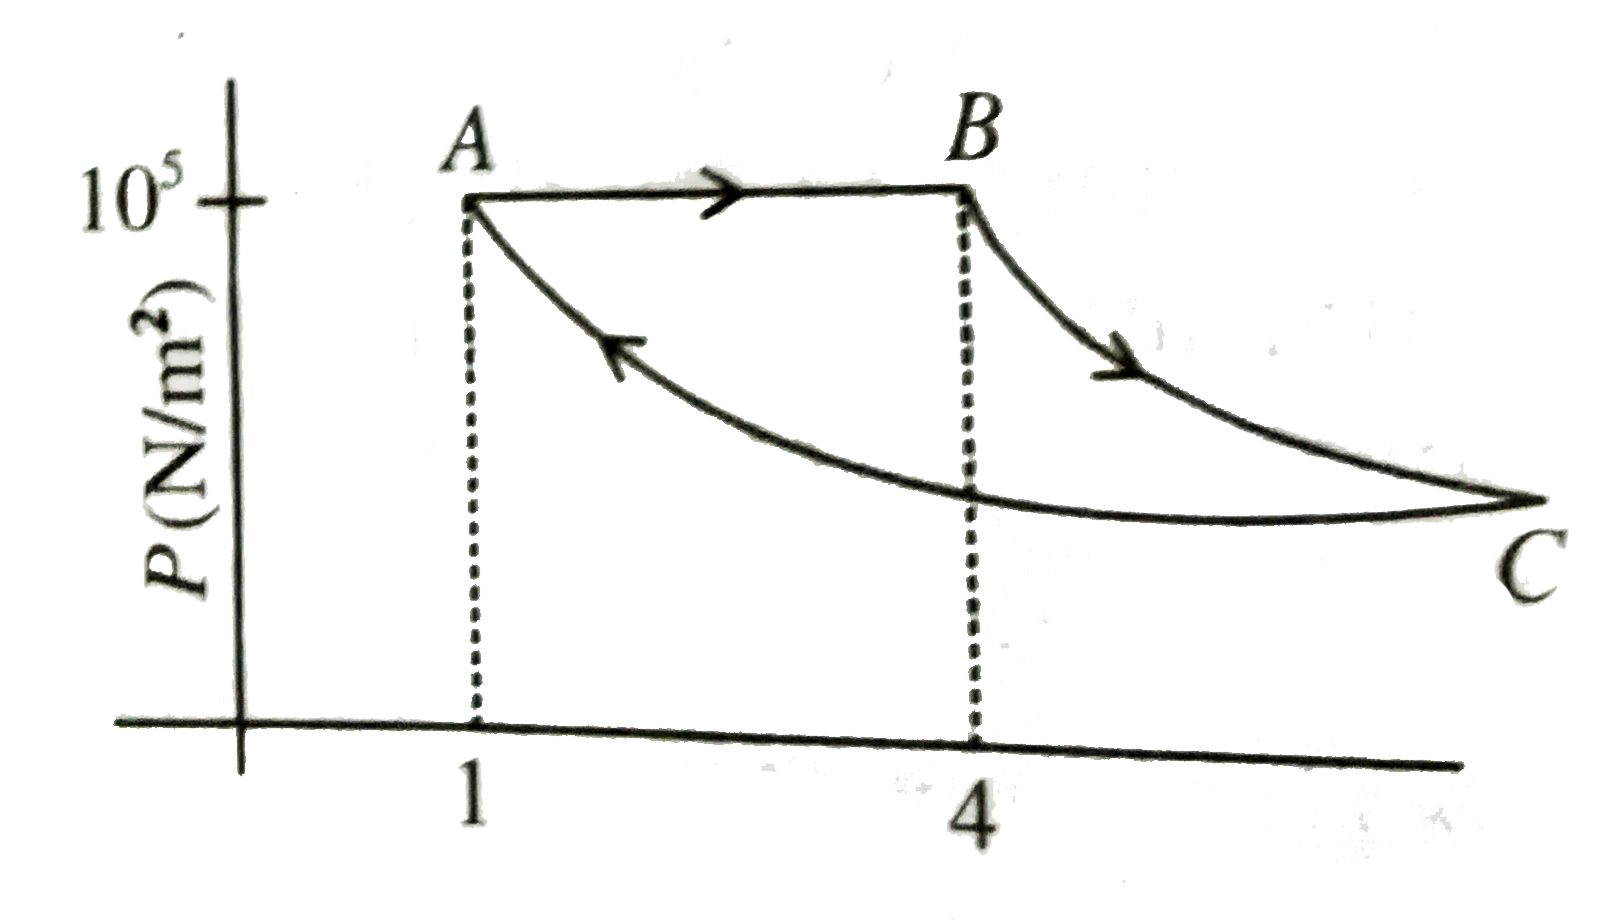
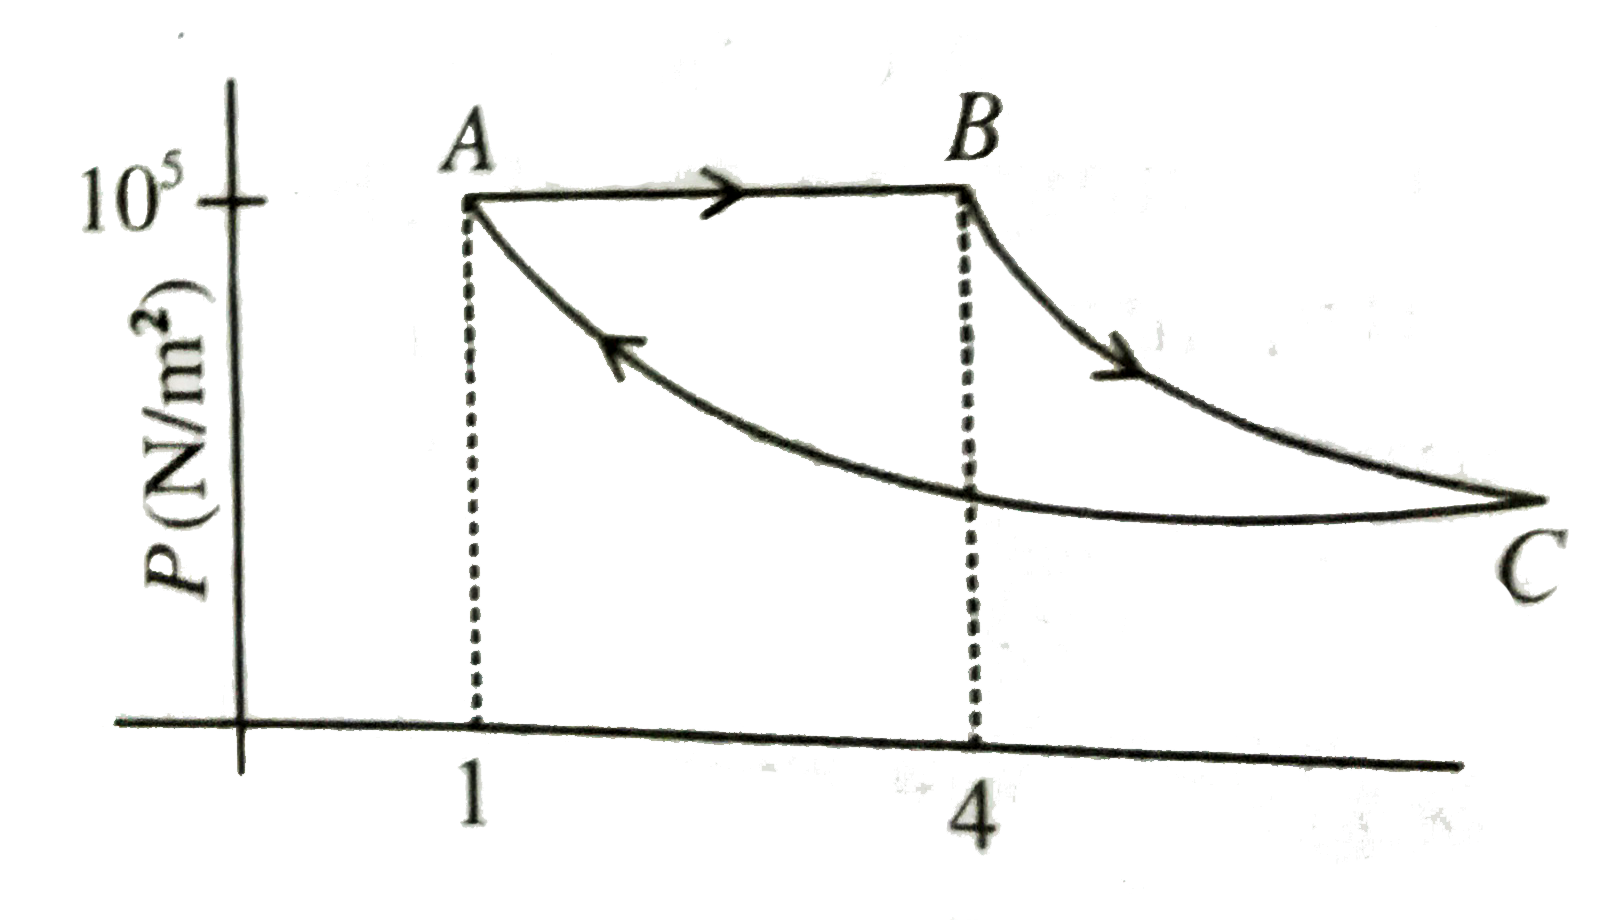
Isobaric expansion from A→B, isochoric pressure drop from B→C, isothermal compression C→A.
To solve the problem of drawing the PV curve for the given thermodynamic processes, we will follow these steps:
Step 1: Understand the Processes
1. Isobaric Expansion (A to B): This means that the pressure remains constant while the volume increases.
2. Isochoric Pressure Drop (B to C): In this process, the volume remains constant while the pressure decreases.
3. Isothermal Compression (C to A): Here, the temperature remains constant while the volume decreases.
Step 2: Draw the Axes
- Draw the x-axis for Volume (V) and the y-axis for Pressure (P).
Step 3: Plot the Isobaric Expansion (A to B)
- Since this process is isobaric (constant pressure), draw a horizontal line from point A to point B.
- Mark point A at a certain volume and pressure, and point B at a higher volume but the same pressure.
Step 4: Plot the Isochoric Pressure Drop (B to C)
- For the isochoric process, the volume remains constant (the same as at point B), but the pressure decreases.
- Draw a vertical line downwards from point B to point C, indicating that the pressure is dropping while the volume stays constant.
Step 5: Plot the Isothermal Compression (C to A)
- For the isothermal compression, the temperature is constant, and the volume decreases.
- Draw a curve from point C to point A that slopes downwards to the left, indicating that as the volume decreases, the pressure increases (since it's isothermal).
Step 6: Label the Points
- Clearly label the points A, B, and C on the graph.
Final PV Curve
- The final PV curve will consist of:
- A horizontal line from A to B (isobaric expansion).
- A vertical line from B to C (isochoric pressure drop).
- A downward sloping curve from C to A (isothermal compression).
1. Isobaric Expansion (A to B): This means that the pressure remains constant while the volume increases.
2. Isochoric Pressure Drop (B to C): In this process, the volume remains constant while the pressure decreases.
3. Isothermal Compression (C to A): Here, the temperature remains constant while the volume decreases.
- Draw the x-axis for Volume (V) and the y-axis for Pressure (P).
- Since this process is isobaric (constant pressure), draw a horizontal line from point A to point B.
- Mark point A at a certain volume and pressure, and point B at a higher volume but the same pressure.
- For the isochoric process, the volume remains constant (the same as at point B), but the pressure decreases.
- Draw a vertical line downwards from point B to point C, indicating that the pressure is dropping while the volume stays constant.
- For the isothermal compression, the temperature is constant, and the volume decreases.
- Draw a curve from point C to point A that slopes downwards to the left, indicating that as the volume decreases, the pressure increases (since it's isothermal).
- Clearly label the points A, B, and C on the graph.
- The final PV curve will consist of:
- A horizontal line from A to B (isobaric expansion).
- A vertical line from B to C (isochoric pressure drop).
- A downward sloping curve from C to A (isothermal compression).
Topper's Solved these Questions
- THERMODYNAMICSBOOK - RESONANCE ENGLISHCHAPTER - THERMODYNAMICSEXERCISE - C-1
1 Videos
- THERMODYNAMICSBOOK - RESONANCE ENGLISHCHAPTER - THERMODYNAMICSEXERCISE - C-2
1 Videos
- THERMODYNAMICSBOOK - RESONANCE ENGLISHCHAPTER - THERMODYNAMICSEXERCISE - B-2
1 Videos
- TEST SERIESBOOK - RESONANCE ENGLISHCHAPTER - TEST SERIESEXERCISE - CHEMISTRY
50 Videos
Similar Questions
Isothermal expansion from A→B, isochoric pressure increase from B→C, isobaric compression from C→D, isochoric pressure drop from D→A.
View SolutionIsothermal expansion from state A to B, isochoric pressure increment from B to C, isothermal contraction from C to D, isobaric contraction from D→A.
View Solution
The process which occurs in going from B→C is
View SolutionOn mole of a monoatomic ideal gas is taken through the cycle shown in figure .
A→B : Adiabatic expansion B→C : Cooling at constant volume
C→D: Adiabatic compression D→A : Heating at constant volume
The pressure and temperature at A,B, etc, are denoted by PA,TA,PB,TB etc., respectively . Given that TA=1000K,PB=(23)PAandPC=(13)PA. Calculate the following quantities: (i) The work done by the gas in the processs A→B (ii) The heat lost by the gas in the process B→C (iii) The temperature TD.(Given:(23)2/5=0.85)
<
View SolutionA fixed mass of gas is taken through a process A→B→C→A. Here A→B is isobaric, B→C is adiabatic and C→Ais isothermal. Find pressure at C

.
View SolutionFor a gaseous reaction
aA(g)+bB(g)⇔cC(g)+dD(g)
equilibrium constants Kc,Kp and Kx are
Kc=[C]c[D]d[A]a[B]b,Kp=Pcc.PdDPaA/Pbb and Kx=xcC.xdDxaA.xbB
where [A]→ molar concentration of A,pA → partial pressure of A and P → total pressure, xA → mole fraction of A
Select the write option
View SolutionA fixed mass of gas is taken through a process A→B→C→A. Here A→B is isobaric, B→C is adiabatic and C→Ais isothermal. Find volume at C.

View SolutionA fixed mass of gas is taken through a process A→B→C→A. Here A→B is isobaric, B→C is adiabatic and C→Ais isothermal. Find work done is the process ( take γ=1.5).

View SolutionXeF2+HCl→A+B+C
View SolutionA following mechanism has been proposed for a reaction
2A+B→D→E
A+B→C+D(slow)
A+C→E (fast)
The rate law expression for the reaction by RDS methd is:
View Solution
