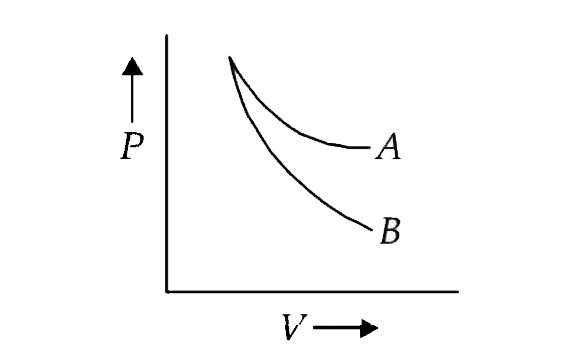
In figure, A and B are two adiabatic curves for two different gases. Then A and B corresponds to:
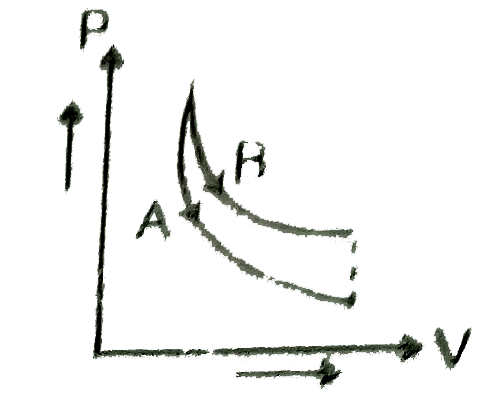
Ar and He respectively
He and H2 respectively
O2 and H2 respectively
H2 and He respectively
The correct Answer is:B
Step by step video & image solution for In figure, A and B are two adiabatic curves for two different gases. Then A and B corresponds to: by Chemistry experts to help you in doubts & scoring excellent marks in Class 12 exams.
Updated on:21/07/2023Topper's Solved these Questions
- THERMODYNAMICSBOOK - RESONANCE ENGLISHCHAPTER - THERMODYNAMICSEXERCISE - Exercise -2 Part-I: Only one option correct type
23 Videos
- THERMODYNAMICSBOOK - RESONANCE ENGLISHCHAPTER - THERMODYNAMICSEXERCISE - Exercise-2 II: Single and double value integer type
16 Videos
- THERMODYNAMICSBOOK - RESONANCE ENGLISHCHAPTER - THERMODYNAMICSEXERCISE - H-1
1 Videos
- TEST SERIESBOOK - RESONANCE ENGLISHCHAPTER - TEST SERIESEXERCISE - CHEMISTRY
50 Videos
Similar Questions
Write two differences between: B cells and T cells
View SolutionFigure shows the adiabatic curve for n moles of an ideal gas, the bulk modulus for the gas corresponding to the point P will be
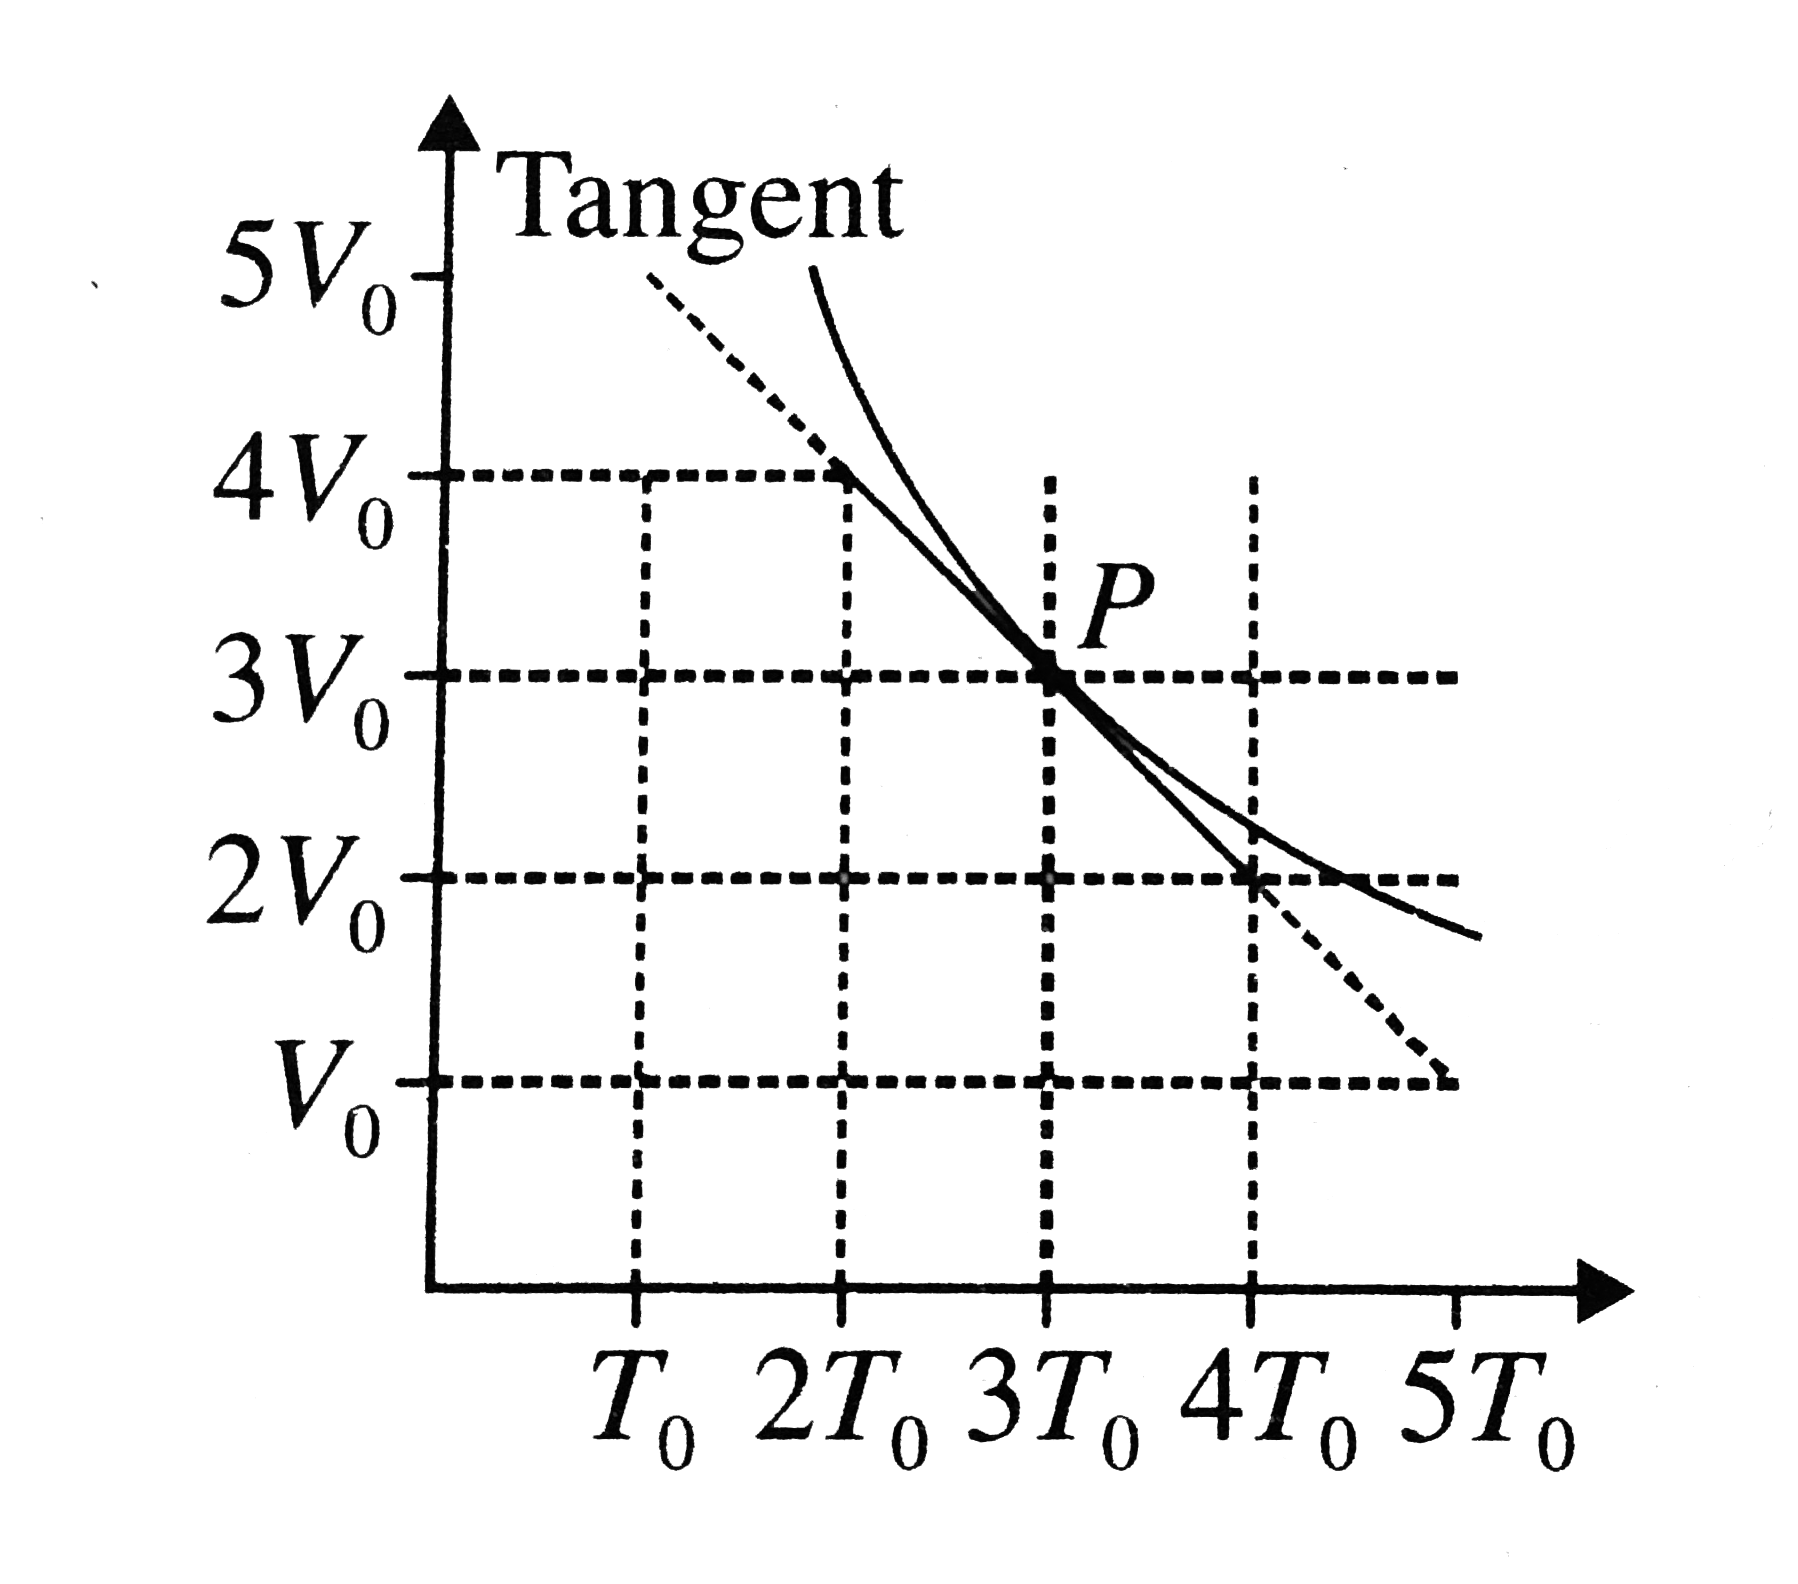
View SolutionFigure shows the adiabatic curve for n moles of an ideal gas, the bulk modulus for the gas corresponding to the point P will be

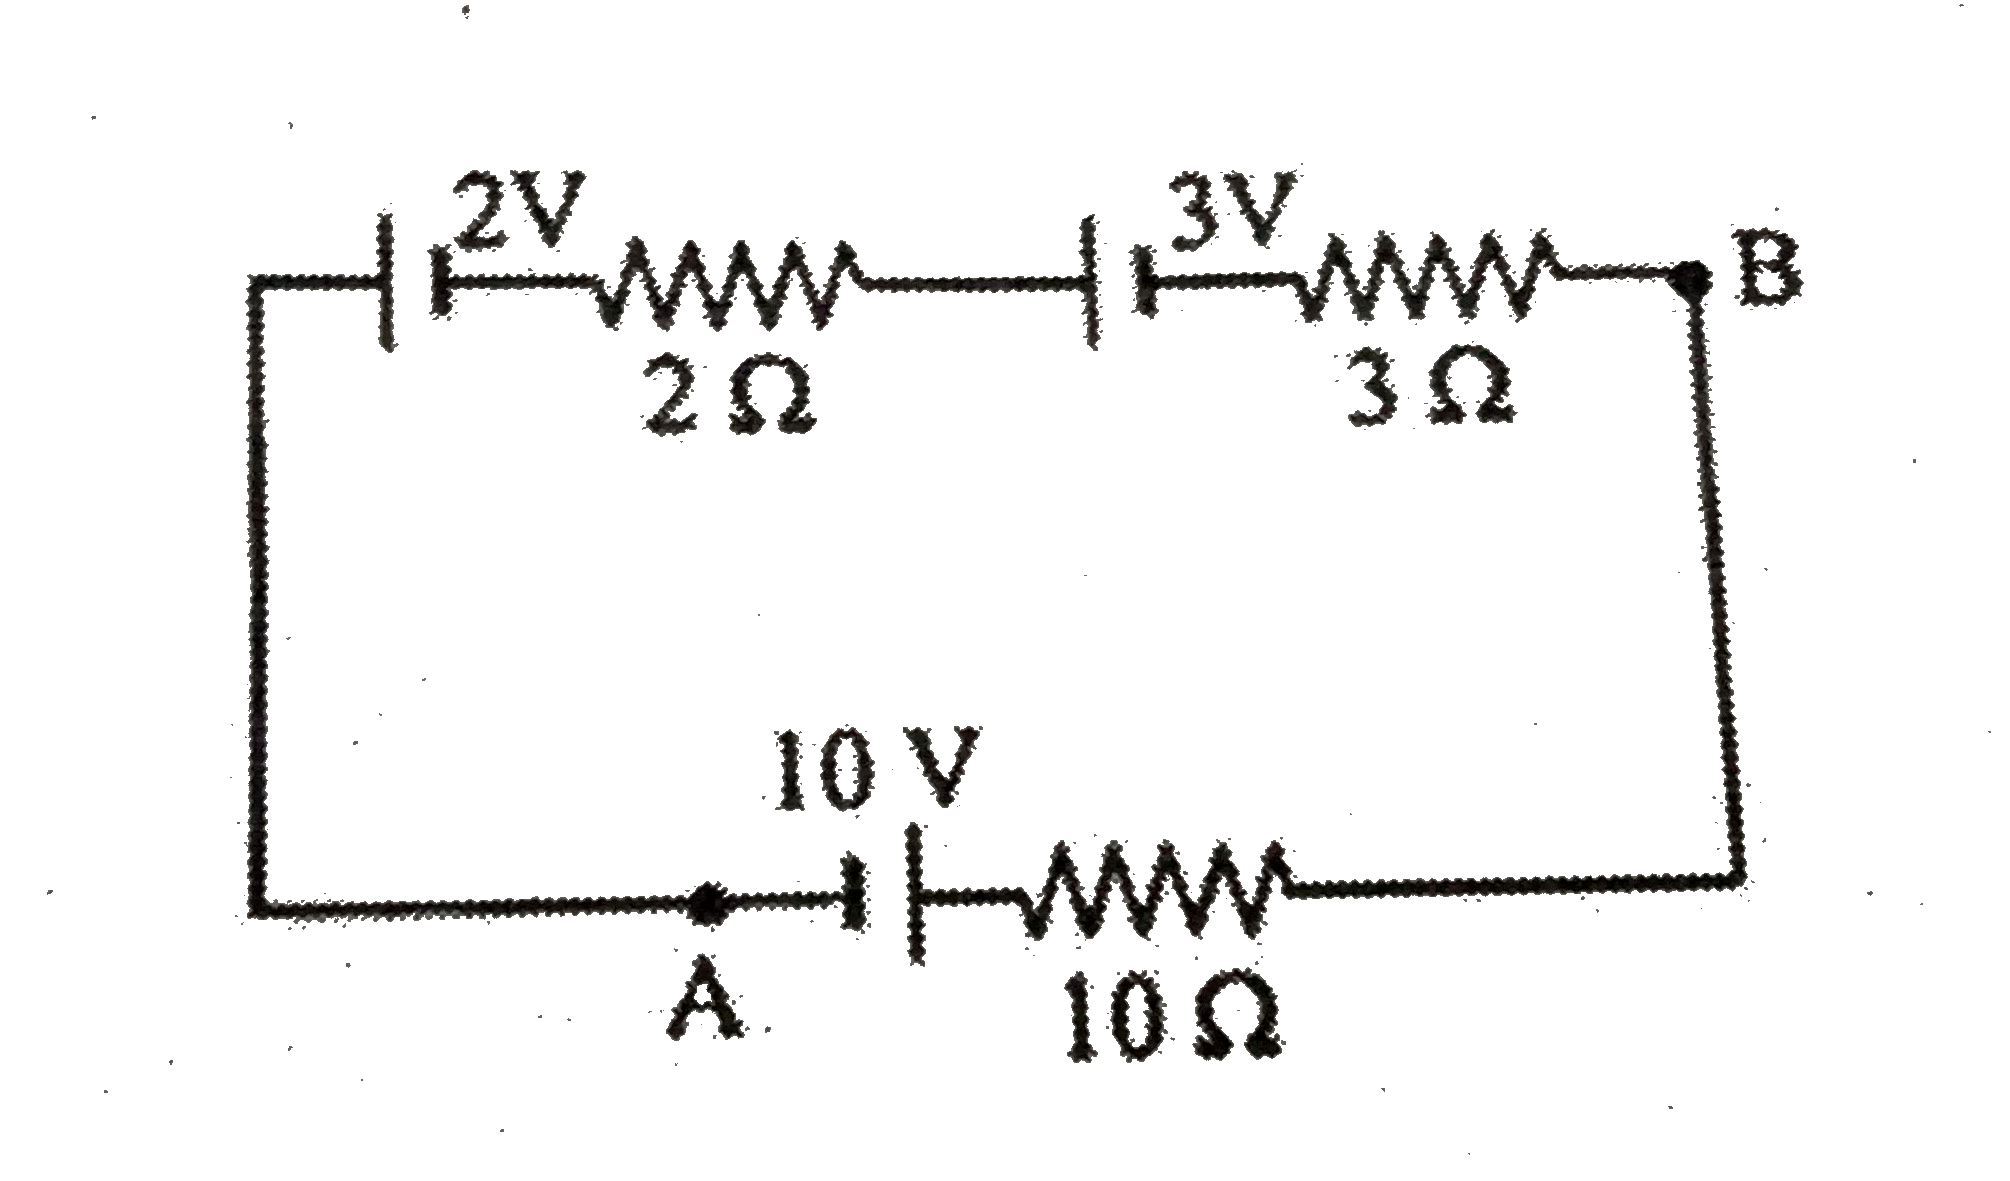
View SolutionIn the figure potential difference between A and B is :
View SolutionThe sum of two vectors A and B is at right angles to their difference. Then
View SolutionThe sum of two vectors A and B is at right angles to their difference. Then
View SolutionThe sum of two vectors A and B is at right angles to their difference. Then
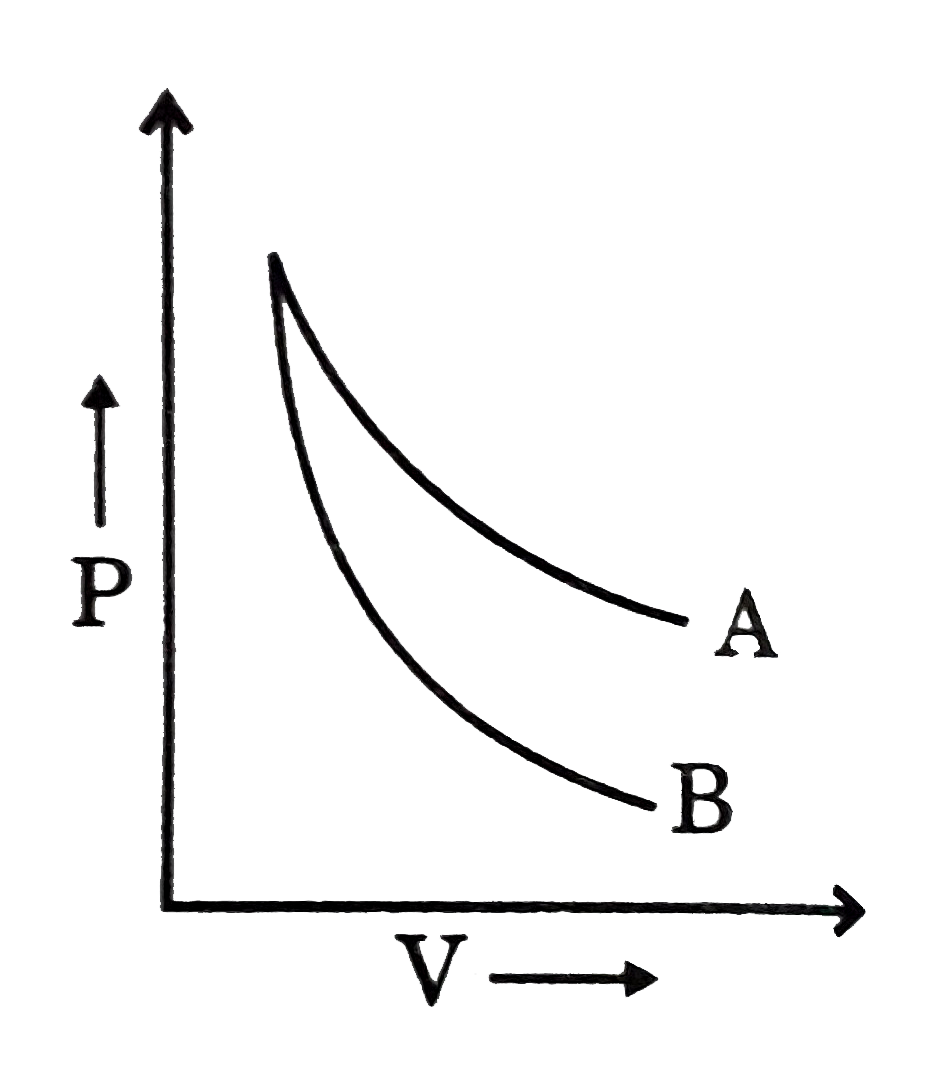
View SolutionP-V plots for two gases during an adiabatic process are given in the figure:
Plot A and plot B should correspond to :
View SolutionP-V plot for two gases (assuming ideal) during adiabatic processes are given in the figure. Plot A and plot B should correspond respectively to :
View SolutionThe curves A and B in the figure shown P-V graphs for an isothermal and an adiabatic process for an idea gas. The isothermal process is represented by the curve A.
View Solution
