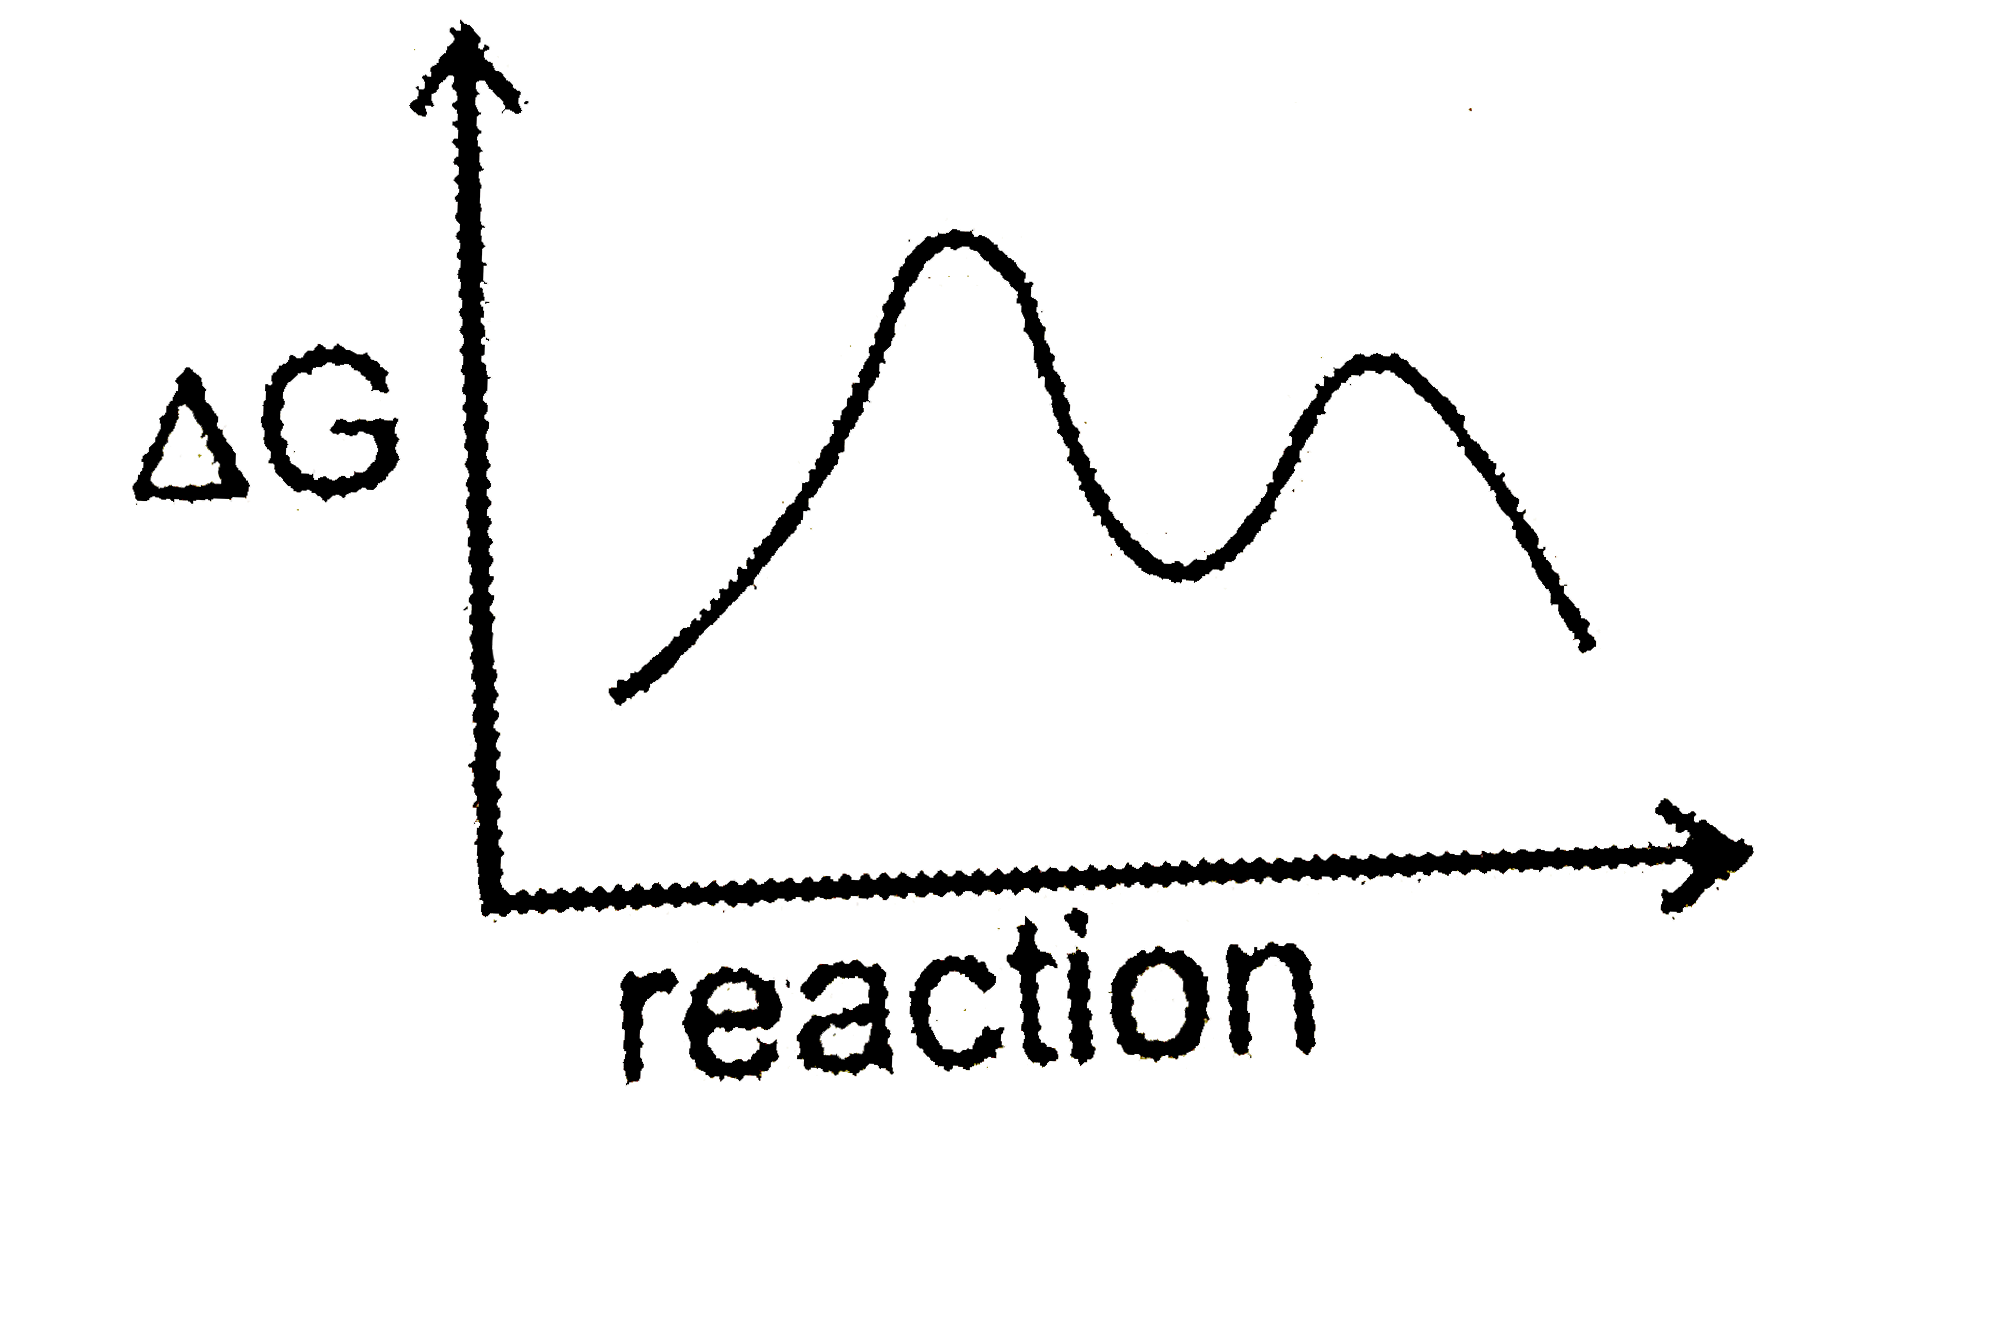
Following graph between ΔG and reaction progress in for/can be :

SN1 reaction
E1 reaction
Aromatic electrophilic substitution
Electrophilic addition reaction
The correct Answer is:A, B, C, D
Step by step video & image solution for Following graph between DeltaG and reaction progress in for/can be : by Chemistry experts to help you in doubts & scoring excellent marks in Class 11 exams.
Updated on:21/07/2023Topper's Solved these Questions
- ORGANIC REACTION MECHANISMS-IVBOOK - RESONANCE ENGLISHCHAPTER - ORGANIC REACTION MECHANISMS-IVEXERCISE - Exercise-2 Part-4
8 Videos
- ORGANIC REACTION MECHANISMS-IVBOOK - RESONANCE ENGLISHCHAPTER - ORGANIC REACTION MECHANISMS-IVEXERCISE - Exercise-3 Part-1
18 Videos
- ORGANIC REACTION MECHANISMS-IVBOOK - RESONANCE ENGLISHCHAPTER - ORGANIC REACTION MECHANISMS-IVEXERCISE - Exercise-2 Part-2
7 Videos
- ORGANIC REACTION MECHANISMS - IIBOOK - RESONANCE ENGLISHCHAPTER - ORGANIC REACTION MECHANISMS - IIEXERCISE - APSP Part - 3
22 Videos
- PERIODIC TABLE & PERIODICITYBOOK - RESONANCE ENGLISHCHAPTER - PERIODIC TABLE & PERIODICITYEXERCISE - ORGANIC CHEMISTRY(BASIC CONCEPTS)
27 Videos
Similar Questions
Knowledge Check
Which of the following graphs shows a stong positive association between x and y?
A B
B C
C D
D
In which of the following reactions, standard reaction entropy changes (ΔS) is positive and standard Gibbs energy change ('DeltaG) decreases sharply with increasing temperature?
AC(graphite)+12O2(g)→CO(g)BCO(g)+12O2(g)→CO2(g)CMg(s)+12O2(g)→MgO(g)D12C(graphite)+12O2(g)→12CO2(g)
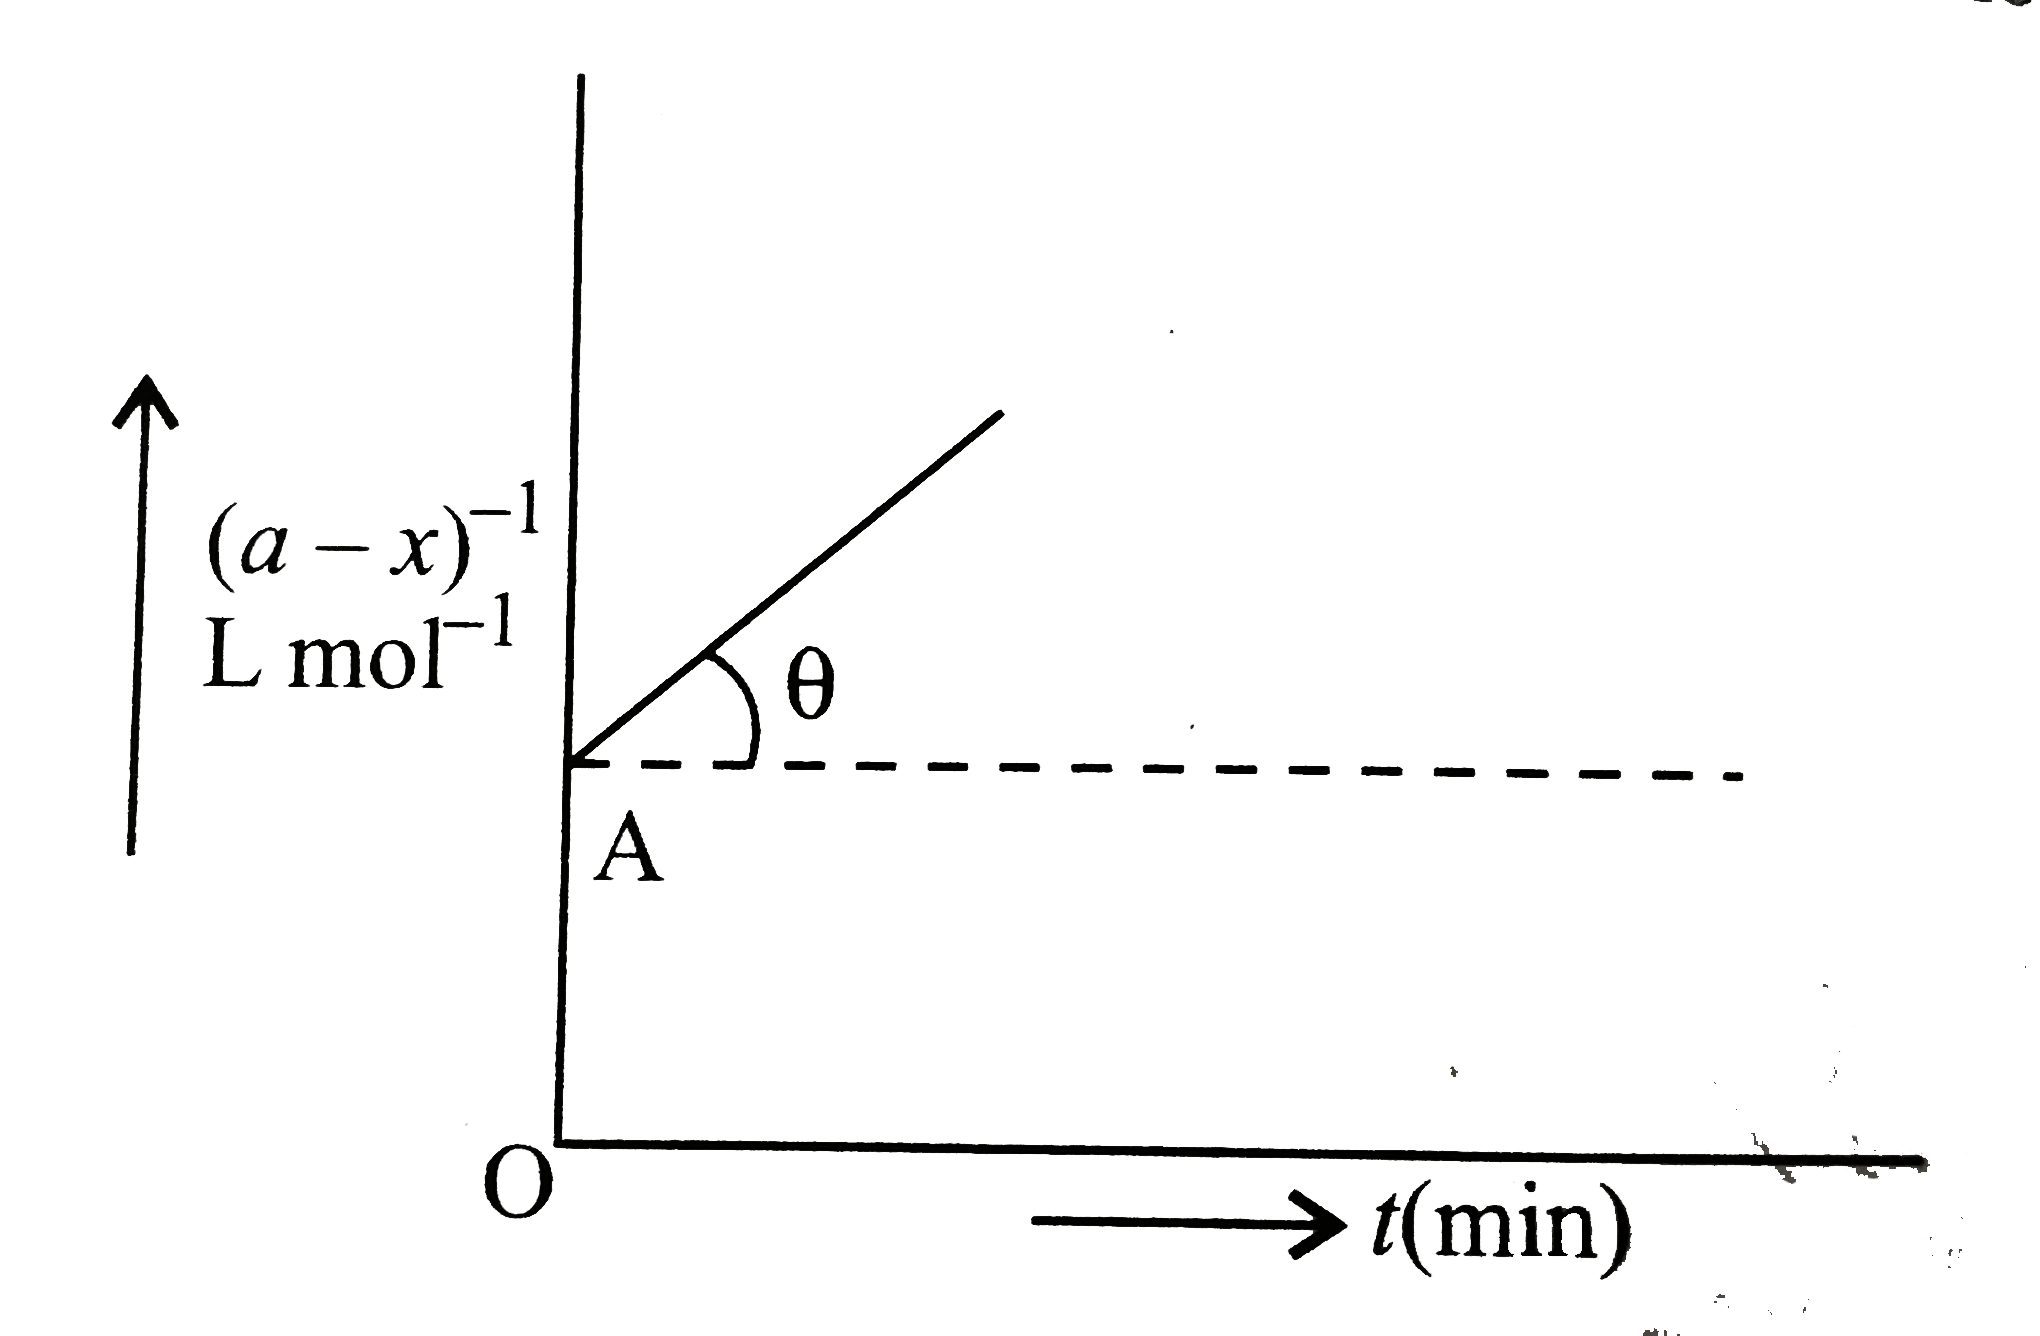
Following is the graph between (a−x) and time t for second order reaction θ=tan−1(0.5)OA=2Lmol−

Hence, the rate at the start of the reaction is
View SolutionIn a first order reaction , on plotting a graph between t1/2 and concentration of reactant
View SolutionWhich of the following graphs represents the relationship between the force F between two point charges and the distance r between them :
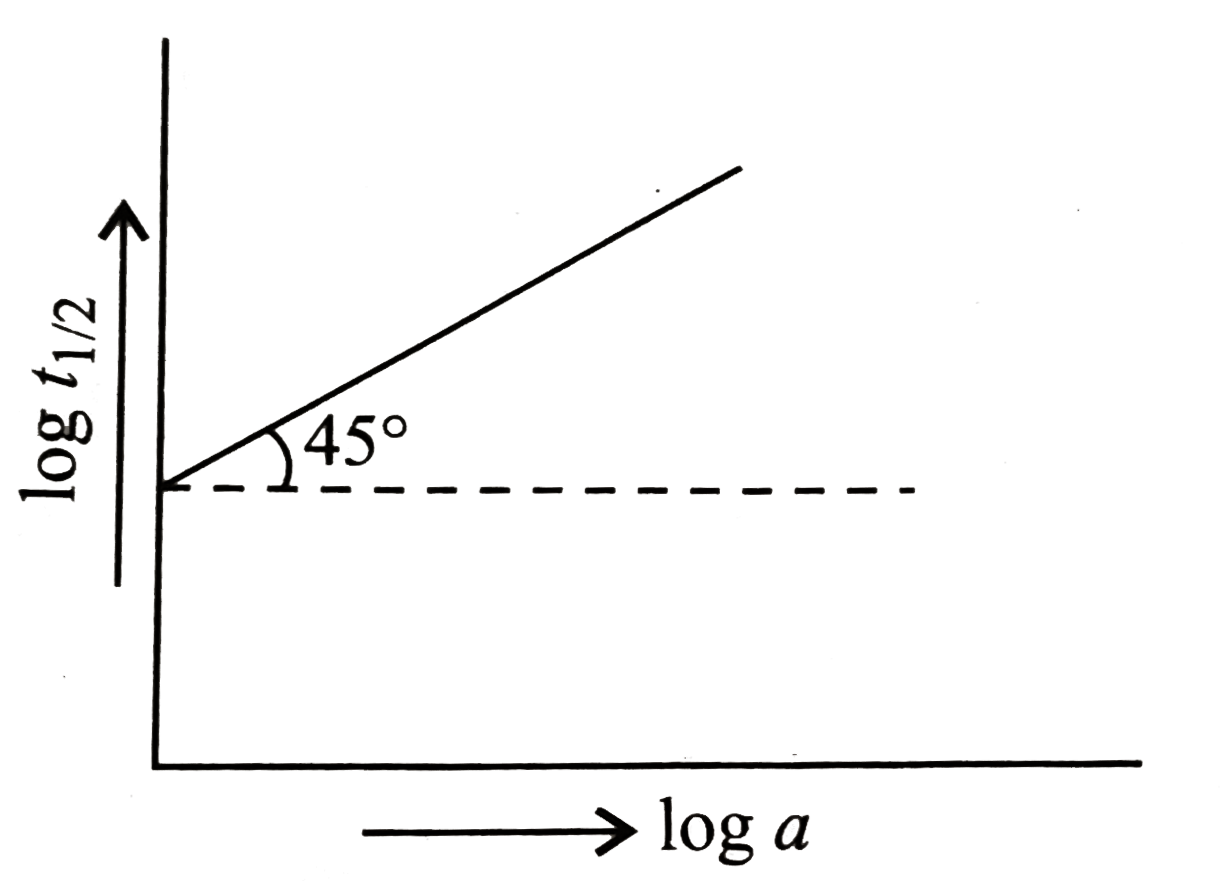
View SolutionFollowing is the graph between logt1/2 and loga (a initial concentration) for a given reaction at 300K

Find the order of reaction.
View SolutionIdentify the appropriate graph between enthalpy and progress of physical adsorption.
View SolutionFollowing is the graph between logT50 and loga (a= initial concentration) for a given reaction at 27∘C. Hence order is

View Solution

