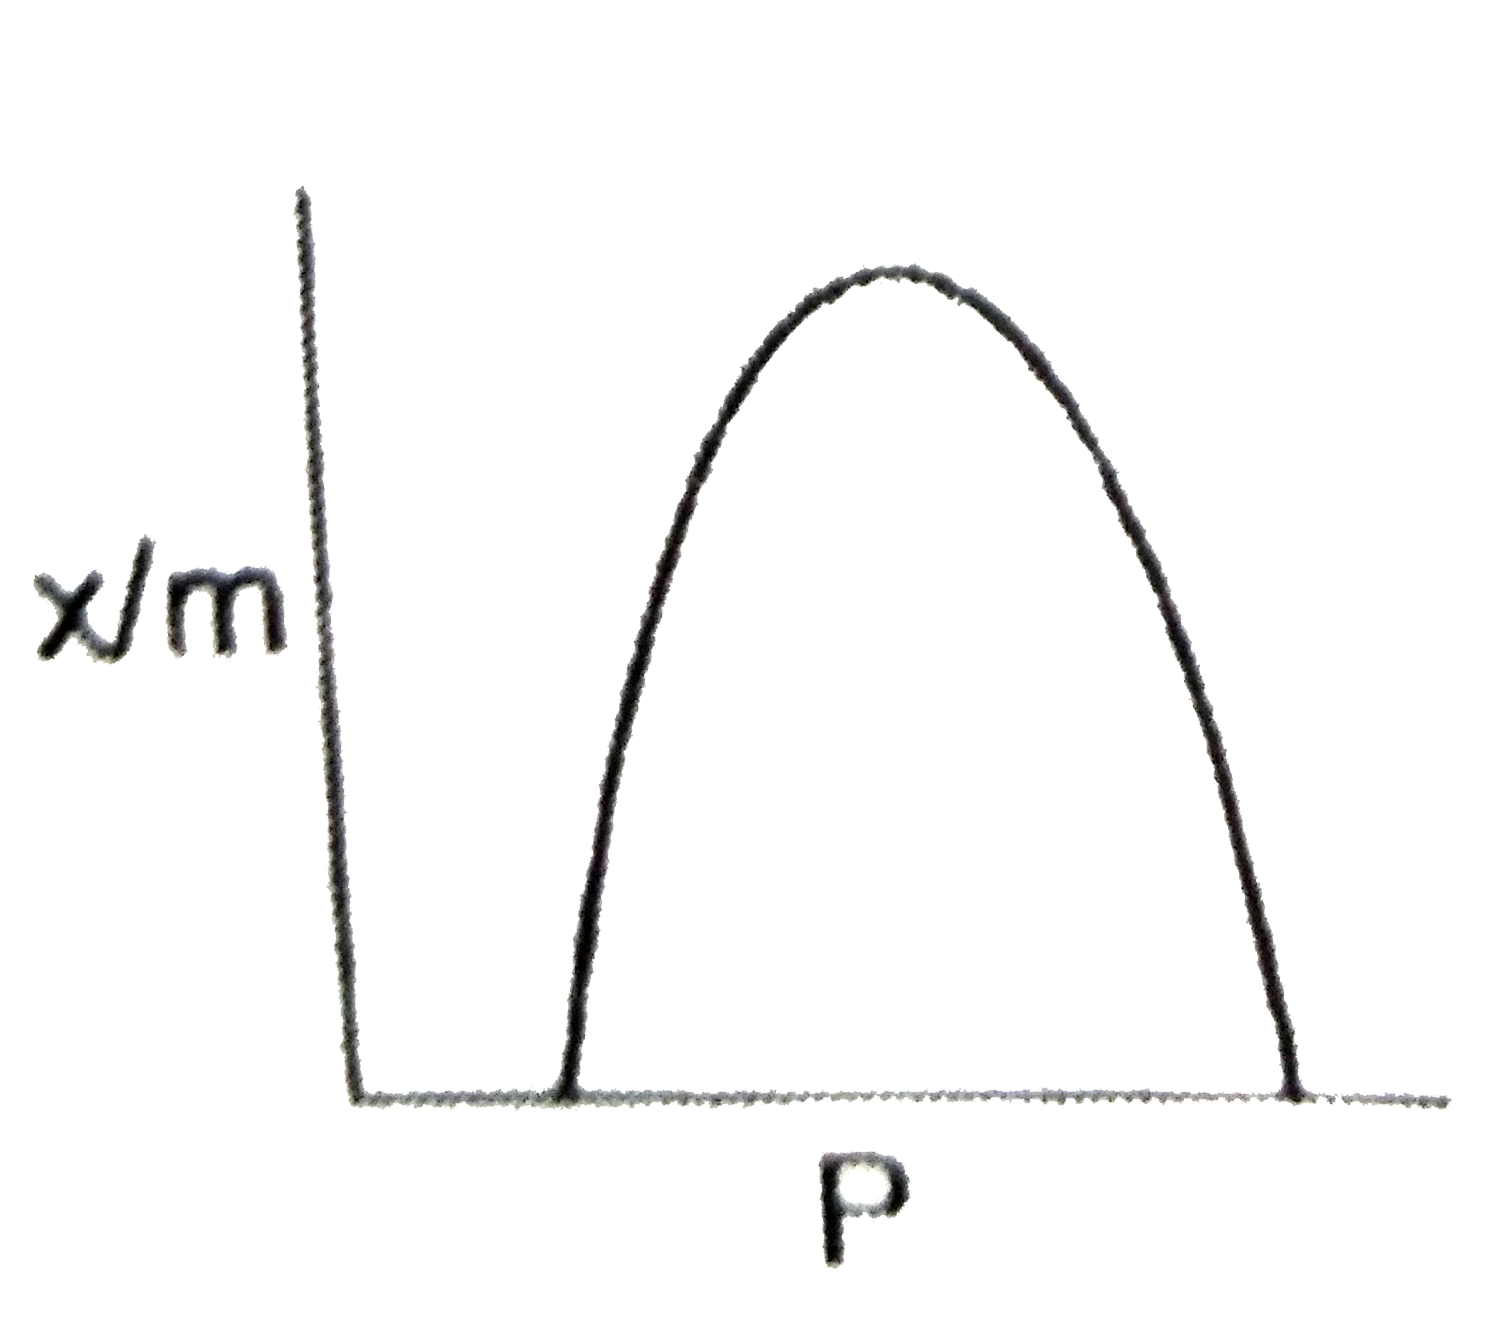
The plot representing Langmuir's adsorption isotherm is :


The correct Answer is:B
To solve the question regarding the plot representing Langmuir's adsorption isotherm, we will follow these steps:
Step 1: Understand Langmuir's Adsorption Isotherm
Langmuir's adsorption isotherm describes how gas molecules adsorb onto a solid surface. It is based on the assumption that adsorption occurs at specific homogeneous sites within the adsorbent. The equation for Langmuir adsorption isotherm is given by:
θ=kP1+kP
where:
- θ is the fractional coverage of the adsorbent (extent of adsorption, xm),
- P is the pressure of the gas,
- k is the Langmuir constant related to the affinity of the binding sites.
Step 2: Identify the Variables
In the equation, as pressure P increases, the extent of adsorption θ will also change until it reaches a maximum value (saturation). Beyond this saturation point, further increases in pressure will not lead to an increase in adsorption.
Step 3: Analyze the Behavior of the Plot
- At low pressures, the extent of adsorption increases linearly with pressure.
- As pressure increases, the adsorption continues to increase but at a decreasing rate.
- Eventually, the plot will level off, indicating that all available adsorption sites are filled (saturation).
Step 4: Determine the Shape of the Plot
The plot of θ (or xm) versus P will initially rise steeply and then plateau as it approaches saturation. This characteristic shape is typical of Langmuir isotherm plots.
Step 5: Identify the Correct Option
Given the options, the correct plot representing Langmuir's adsorption isotherm will show:
- An initial increase in θ with increasing P,
- A leveling off at higher pressures, indicating saturation.
Thus, the correct answer is Option C, which depicts this behavior.
---
Langmuir's adsorption isotherm describes how gas molecules adsorb onto a solid surface. It is based on the assumption that adsorption occurs at specific homogeneous sites within the adsorbent. The equation for Langmuir adsorption isotherm is given by:
- θ is the fractional coverage of the adsorbent (extent of adsorption, xm),
- P is the pressure of the gas,
- k is the Langmuir constant related to the affinity of the binding sites.
In the equation, as pressure P increases, the extent of adsorption θ will also change until it reaches a maximum value (saturation). Beyond this saturation point, further increases in pressure will not lead to an increase in adsorption.
- At low pressures, the extent of adsorption increases linearly with pressure.
- As pressure increases, the adsorption continues to increase but at a decreasing rate.
- Eventually, the plot will level off, indicating that all available adsorption sites are filled (saturation).
The plot of θ (or xm) versus P will initially rise steeply and then plateau as it approaches saturation. This characteristic shape is typical of Langmuir isotherm plots.
Given the options, the correct plot representing Langmuir's adsorption isotherm will show:
- An initial increase in θ with increasing P,
- A leveling off at higher pressures, indicating saturation.
Topper's Solved these Questions
- SURFACE CHEMISTRYBOOK - RESONANCE ENGLISHCHAPTER - SURFACE CHEMISTRYEXERCISE - Part - III : High Level Problems
2 Videos
- SURFACE CHEMISTRYBOOK - RESONANCE ENGLISHCHAPTER - SURFACE CHEMISTRYEXERCISE - Only One Option Correct Type
7 Videos
- SURFACE CHEMISTRYBOOK - RESONANCE ENGLISHCHAPTER - SURFACE CHEMISTRYEXERCISE - Part - I Practice Test - 1 (IIT - JEE (Main Pattern))
29 Videos
- STRUCTURAL IDENTIFICATIONBOOK - RESONANCE ENGLISHCHAPTER - STRUCTURAL IDENTIFICATIONEXERCISE - Advanced level Problems (Part-III)
12 Videos
- TEST PAPERSBOOK - RESONANCE ENGLISHCHAPTER - TEST PAPERSEXERCISE - FST-3
30 Videos
Similar Questions
If x/m is the mass of adsorbate adsorbed per unit mass of adsorbent, P is the pressure of the adsorbate gas ,a and b are constant ,which of the following represent "Langmuir adsorption isotherm"?
View SolutionFreundlich adsorption isotherm is
View SolutionFor Langmuir adsorption isotherm, which is correct?
View SolutionWhat is an adsorption isotherm ?
View SolutionWhich of the following does not represent freundlich
adsorption isotherm?
View SolutionAccording of Langmuir adsorption isotherm amount of gas adsorbed at very low pressure
View SolutionA mono atomic gas [X] adsorbed on a surface follows. Langmuir adsorption isotherm. A plot of the fraction of source coverage θ, against concentration of the gas [X], for very low concentration of gas, is described by the equation.
View SolutionWhich of the following graphs represents freundlich adsorption isotherm?
View SolutionWhat is Freundlich adsorption isotherm ?
View SolutionThe Langmuir adsorption isotherm is deduced using the assumption.
View Solution
