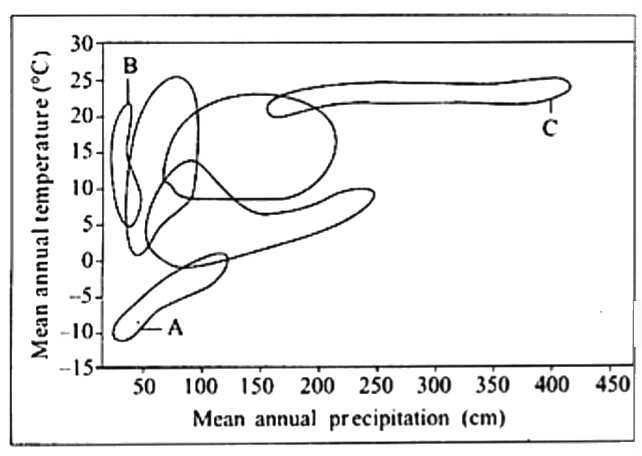
Show the graphical representation of mean annual rainfall with respect to mean annual temperature.
Step by step video & image solution for Show the graphical representation of mean annual rainfall with respect to mean annual temperature. by Biology experts to help you in doubts & scoring excellent marks in Class 12 exams.
Topper's Solved these Questions
- BOOK - NAVNEET PUBLICATION - MAHARASHTRA BOARDCHAPTER - QUESTION BANK 2021EXERCISE - CHAPTER 13 (3 marks)7videos
QUESTION BANK 2021
- BOOK - NAVNEET PUBLICATION - MAHARASHTRA BOARDCHAPTER - QUESTION BANK 2021EXERCISE - CHAPTER 13 (4 marks)3videos
QUESTION BANK 2021
- BOOK - NAVNEET PUBLICATION - MAHARASHTRA BOARDCHAPTER - QUESTION BANK 2021EXERCISE - CHAPTER 13 (Single sentence answers)8videos
QUESTION BANK 2021
- BOOK - NAVNEET PUBLICATION - MAHARASHTRA BOARDCHAPTER - MULTIPLE CHOICE QUESTIONS EXERCISE - Organisms and Environment -II18videos
MULTIPLE CHOICE QUESTIONS
- BOOK - NAVNEET PUBLICATION - MAHARASHTRA BOARDCHAPTER - SHORT ANSWER QUESTIONS -I EXERCISE - Chapter 19 : Organisms and Environment - II7videos
SHORT ANSWER QUESTIONS -I
Similar Questions
Knowledge Check
- Question 1 - Select One
Monsoon forests annual rainfall is
A50-150 cmB150-200 cmC70-200 cmD70-100 cm - Question 2 - Select One
What is the cause of annual varaition in the intesity and during the temperature?
ARotation of earth around sunBTilt of axis of earthCAnnual variation in the precipitationDBoth A and B - Question 3 - Select One
Mean monthly temperature means :
AThe sum of daily temperature in a monthBThe sum of daily temperature in a year divide by 12CThe sum of daly mean temperature in a month divided by the number of days in that monthDThe sum of daily moon temperature divided by the number of days in that month
Show graphical representation of energy distribution spectrum of perfectly black body.
View SolutionThe graph given below is showing biome distribution with respect to annual temperature and precipitation. Identify A, B and C, respectively.
 View Solution
Formation of tropical forests needs mean annual temperature and mean annual precipitation as:
View SolutionFormation of tropical forests needs mean annual temperature and mean annual precipitation as:
View SolutionThe area with annual rainfall less than 50 cm in a year is
View Solution
