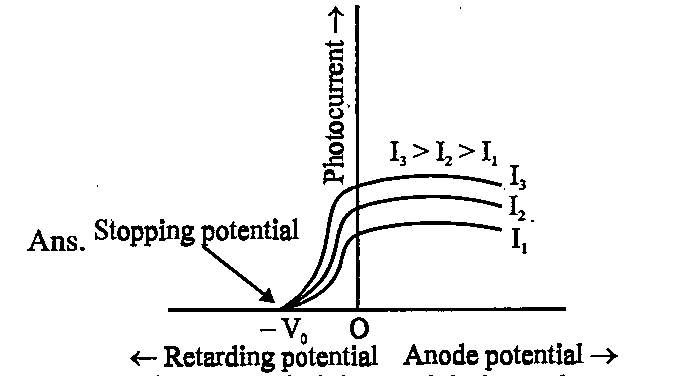
Plot a graph showing the variation of photoelectric current with anode potential for two light beams of same wavelength but different intensity.
Similar Questions
Plot a graph showing the variation of photoelectric current with anode potential for two light beam of same wavelength but different intensity.
View SolutionDraw suitable graphs to show the variation of photoelectric current with collector plate potential for
(i) a fixed frequency but different intensities I1>I2>I3 of radiation.
(ii) a fixed intensity but different frequencies v1>v2>v3 of radiation.
View SolutionDarw graphs showing variation of photoelctric current with applied voltage for two incident radiations of equal frequecny and different intensities. Mark the graph for the radiaiton of higher intensity.
View SolutionDarw graphs showing variation of photoelctric current with applied voltage for two incident radiations of equal frequecny and different intensities. Mark the graph for the radiaiton of higher intensity.
View SolutionDarw graphs showing variation of photoelctric current with applied voltage for two incident radiations of equal frequecny and different intensities. Mark the graph for the radiaiton of higher intensity.
View SolutionDraw graphs showing variation of photoelectric current with applied voltage for three incident radiations of equal frequency and different intensities. Mark the graph for the radiation of higher intensity.
View SolutionDraw a plot showing the variation of photoelectric current with collector plate potential for two different frequencies, v1>v2 of incident radiation having the same intensity. In which case will the stopping potential be higher? Justify your answer.
View SolutionDraw a plot showing the variation of photoelectric current with collector plate potential for two different frequencies, v1>v2 of incident radiation having the same intensity. In which case will the stopping potential be higher? Justify your answer.
View SolutionDraw a plot showing the variation of photoelectric current with collector plate potential for two different frequenciesv1andv2(v1>v2) of incident radiation having the same intensity. In which case will the stopping potential be higher? Justify your answer.
View SolutionDraw a plot showing the variation of photoelectric current with collector plate potential for two different frequencies, v1>v2, of incident radiation having the same intensity. In which case will the stopping potential be higher ? Justify your answer.
View Solution

