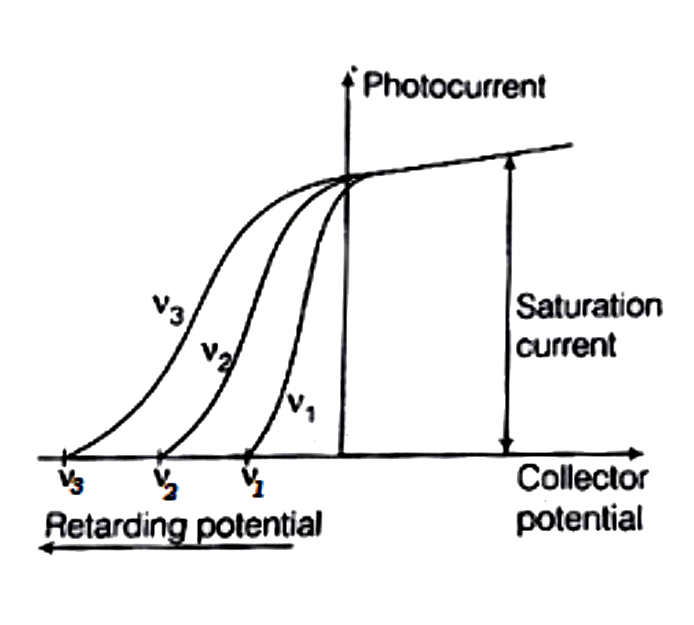
Draw a plot showing the variation of photoelectric current with collector plate potential for two different frequencies, v1>v2 of incident radiation having the same intensity. In which case will the stopping potential be higher? Justify your answer.
To solve the problem, we need to analyze the photoelectric effect and how the photoelectric current varies with the collector plate potential for two different frequencies of incident radiation.
1. Understanding the Photoelectric Effect:
- The photoelectric effect occurs when light of sufficient frequency strikes a metal surface, causing the emission of electrons. The energy of the incident photons is given by E=hν, where h is Planck's constant and ν is the frequency of the incident light.
2. Einstein's Photoelectric Equation:
- According to Einstein's photoelectric equation, the energy of the incident photon is related to the work function (ϕ) of the metal and the maximum kinetic energy (Kmax) of the emitted electrons:
hν=ϕ+Kmax
- The maximum kinetic energy can also be expressed in terms of the stopping potential (Vs):
Kmax=eVs
- Thus, we can rewrite the equation as:
hν=ϕ+eVs
3. Comparing Two Frequencies:
- Let ν1 and ν2 be two frequencies such that ν1>ν2.
- For frequency ν1:
eVs1=hν1−ϕ
- For frequency ν2:
eVs2=hν2−ϕ
- Since ν1>ν2, it follows that Vs1>Vs2.
4. Plotting the Graph:
- On the x-axis, we will plot the collector plate potential (V) and on the y-axis, we will plot the photoelectric current (I).
- For both frequencies, the photoelectric current will increase with increasing collector plate potential until it reaches a saturation current, which is the same for both frequencies since the intensity of light is the same and the work function is constant.
- The stopping potential for ν1 will be higher than that for ν2, leading to the following characteristics in the graph:
- The curve for ν1 will reach saturation at a higher potential than the curve for ν2.
5. Final Graph:
- The graph will show two curves:
- One for frequency ν1 that saturates at a higher collector plate potential.
- One for frequency ν2 that saturates at a lower collector plate potential.
- Both curves will have the same saturation current value.
Conclusion:
- The stopping potential for the higher frequency (ν1) will be greater than that for the lower frequency (ν2) because the energy of the incident photons is greater, allowing for more kinetic energy to be imparted to the emitted electrons.
- The photoelectric effect occurs when light of sufficient frequency strikes a metal surface, causing the emission of electrons. The energy of the incident photons is given by E=hν, where h is Planck's constant and ν is the frequency of the incident light.
- According to Einstein's photoelectric equation, the energy of the incident photon is related to the work function (ϕ) of the metal and the maximum kinetic energy (Kmax) of the emitted electrons:
hν=ϕ+Kmax
- The maximum kinetic energy can also be expressed in terms of the stopping potential (Vs):
Kmax=eVs
- Thus, we can rewrite the equation as:
hν=ϕ+eVs
- Let ν1 and ν2 be two frequencies such that ν1>ν2.
- For frequency ν1:
eVs1=hν1−ϕ
- For frequency ν2:
eVs2=hν2−ϕ
- Since ν1>ν2, it follows that Vs1>Vs2.
- On the x-axis, we will plot the collector plate potential (V) and on the y-axis, we will plot the photoelectric current (I).
- For both frequencies, the photoelectric current will increase with increasing collector plate potential until it reaches a saturation current, which is the same for both frequencies since the intensity of light is the same and the work function is constant.
- The stopping potential for ν1 will be higher than that for ν2, leading to the following characteristics in the graph:
- The curve for ν1 will reach saturation at a higher potential than the curve for ν2.
- The graph will show two curves:
- One for frequency ν1 that saturates at a higher collector plate potential.
- One for frequency ν2 that saturates at a lower collector plate potential.
- Both curves will have the same saturation current value.
- The stopping potential for the higher frequency (ν1) will be greater than that for the lower frequency (ν2) because the energy of the incident photons is greater, allowing for more kinetic energy to be imparted to the emitted electrons.
Topper's Solved these Questions
- XII BOARDSBook:XII BOARD PREVIOUS YEAR PAPER ENGLISHChapter:XII BOARDSExercise:[Set- II]
Explore 4 Videos
- XII BOARDSBook:XII BOARD PREVIOUS YEAR PAPER ENGLISHChapter:XII BOARDSExercise:[Set-III]
Explore 3 Videos
- XII BOARDSBook:XII BOARD PREVIOUS YEAR PAPER ENGLISHChapter:XII BOARDSExercise:SET-III, DELHI BOARD
Explore 4 Videos
- SAMPLE PAPER 2019Book:XII BOARD PREVIOUS YEAR PAPER ENGLISHChapter:SAMPLE PAPER 2019Exercise:SECTION D
Explore 6 Videos
Similar Questions
The variation of photocurrent with collector potential for different frequencies of incident radiation v1,v2,v3 is as shown in the the graph , then

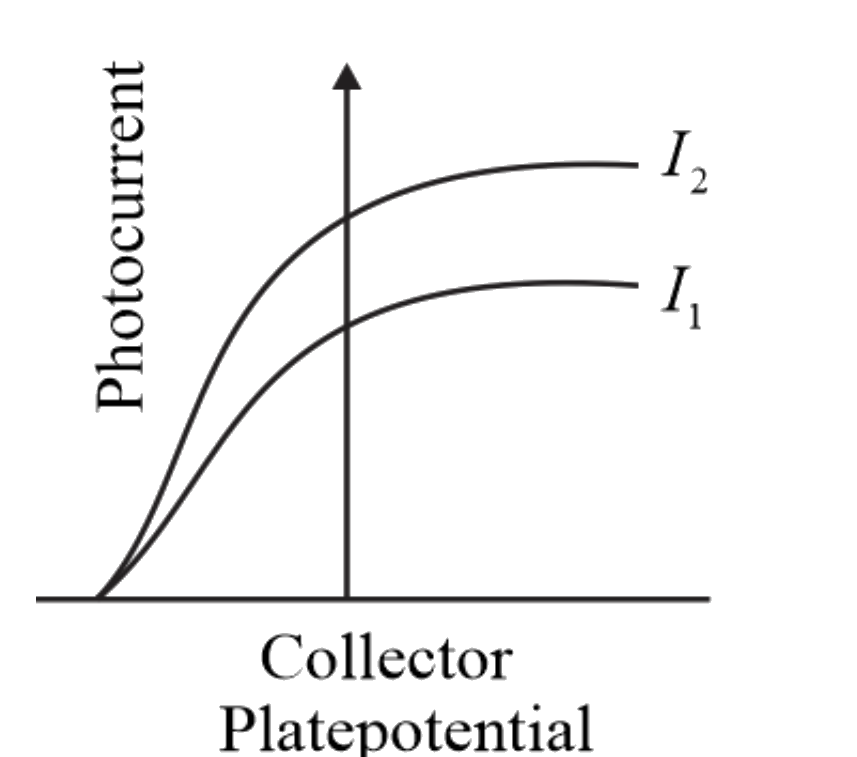
View SolutionFrom the following graph of photocurrent against collector plate potential for two different intensities of light I1andI2 one can , conclude

View SolutionDarw graphs showing variation of photoelctric current with applied voltage for two incident radiations of equal frequecny and different intensities. Mark the graph for the radiaiton of higher intensity.
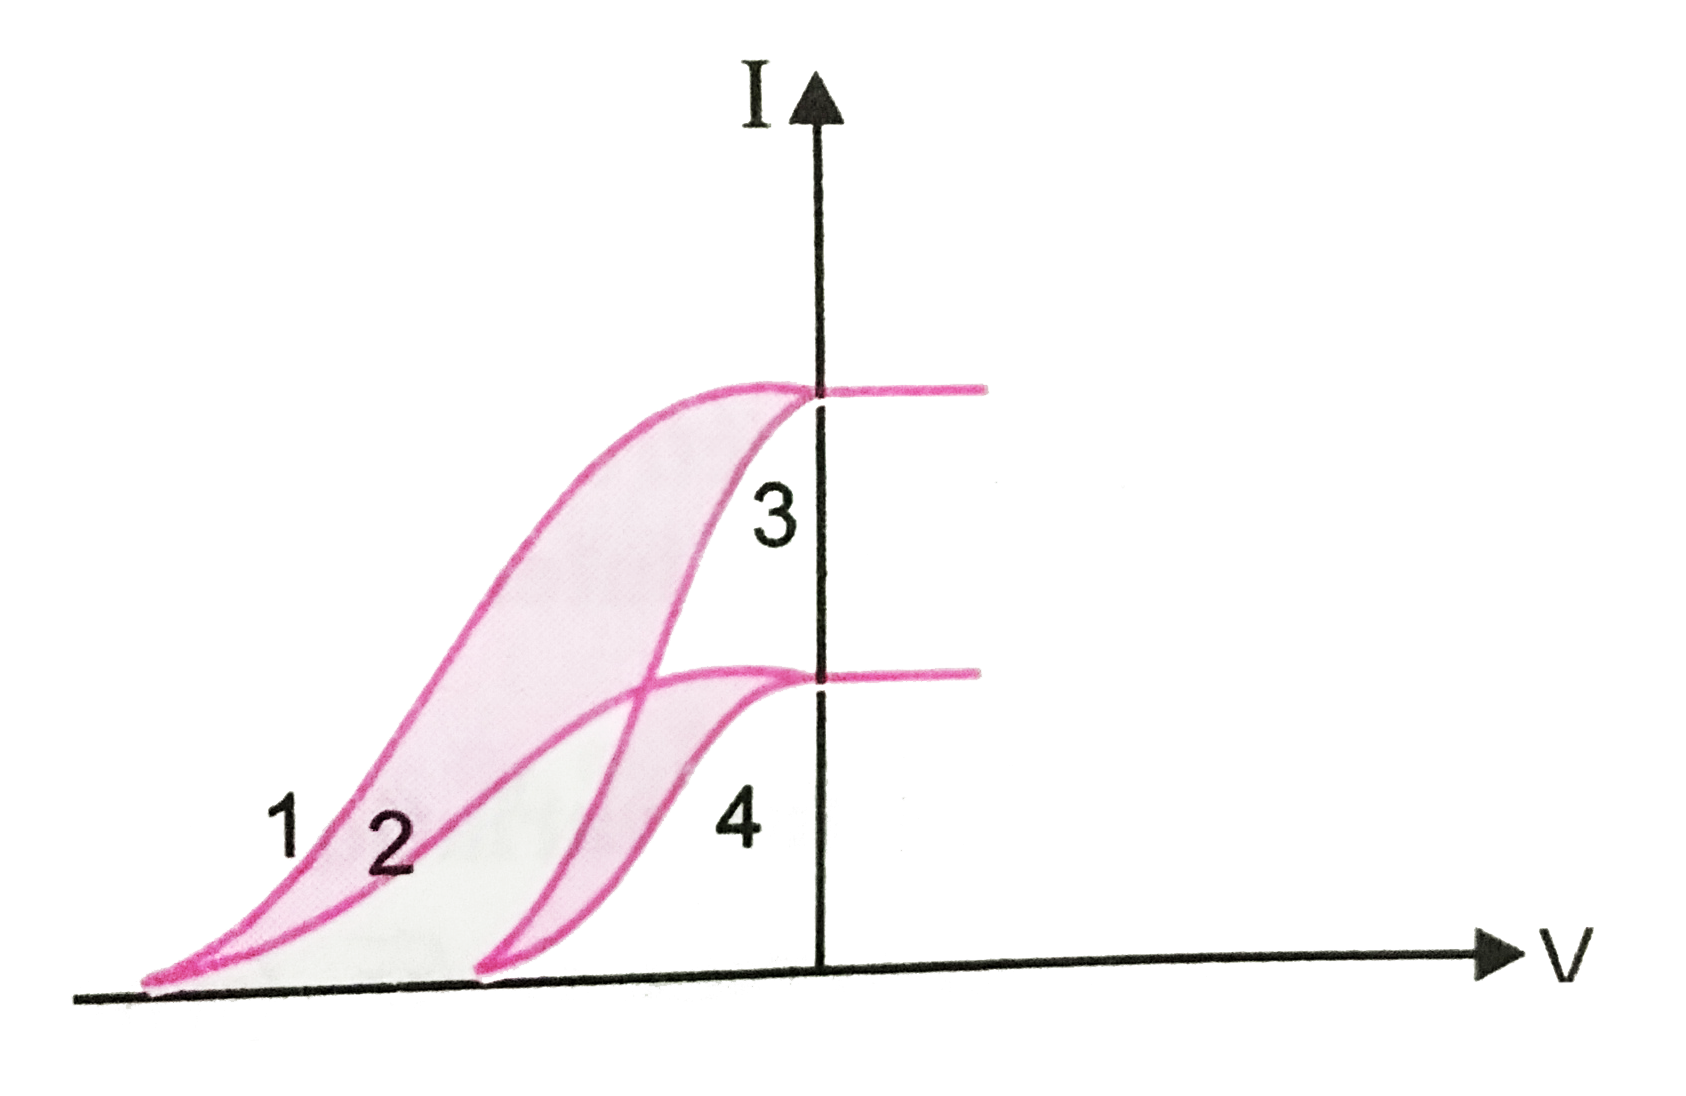
View SolutionThe graph of Fig. shows the variation of photoelectric current (I) versus applied voltage (V) for the two different photosensitive materials for two different intensities of the incident radiation. Identify the pairs of curves that correspond to different materials but same intensity of incident radiation.

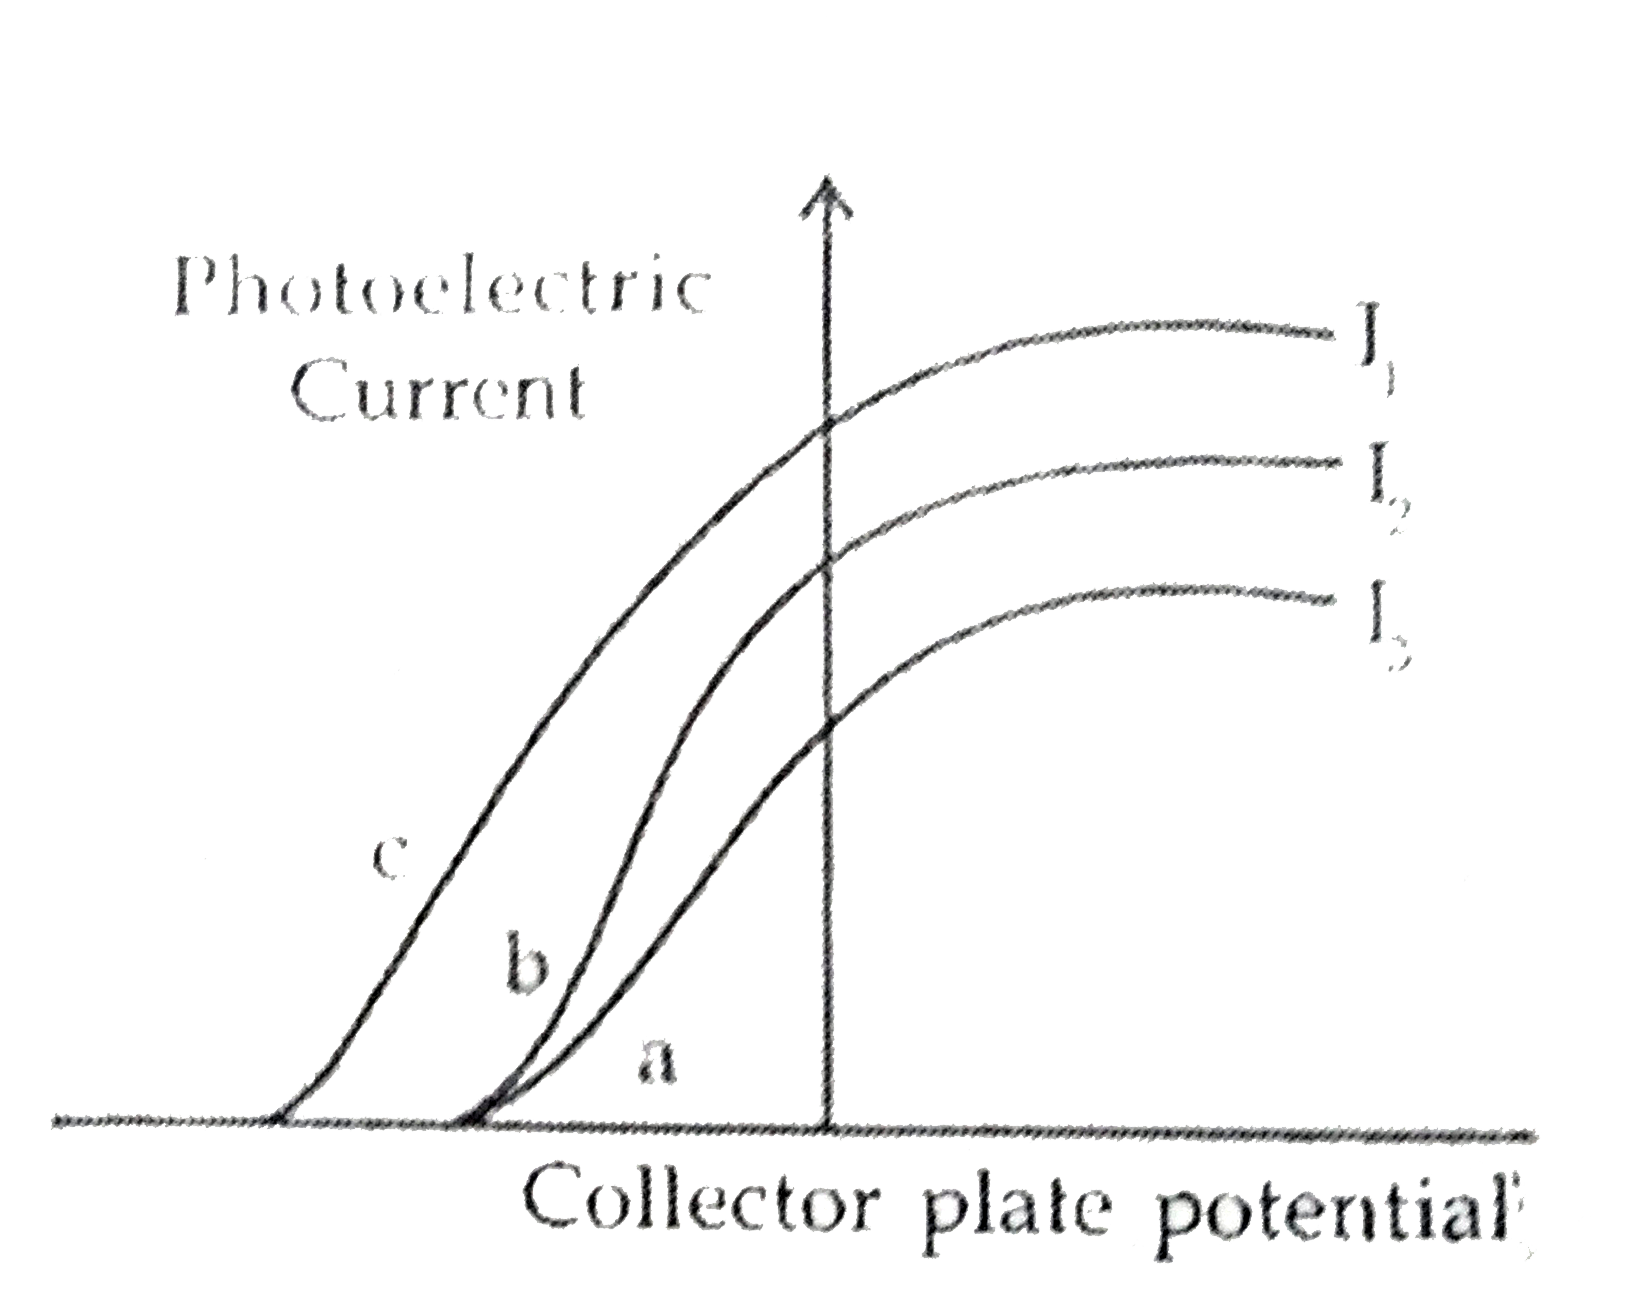
View SolutionThe figure shows a plot of three curves a, b, c, showing variation of photocurrent vs collector plate potential for three different intensities I1,I2andI3 having frequencies v1,v2andv3 respectively incident on a photosensitive surface.
Point out the two curves for which the incident radioations have same frequency but different intensities.

View SolutionThe graph between photo electric current and cathode potential when the anode is kept at zero potential, for light of two different intensities out of the same frequency looks like the one:
View SolutionIn a series LCR circuit connected to an ac source of variable frequency and voltage v=vmsinωt, draw a plot showing the variation of current (I) with angular frequency (ω) for two different values of resistance R1andR2(R1>R2). Write the condition under which the phenomenon of resonance occurs. For which value of the resistance out of the two curves, a sharper resonance is produced ? Define Q-factor of the circuit and give its significance.
View SolutionDraw a graph showing the variation of de Broglie wavelength of a particle of charge q and mass m with accelerating potential. Proton and deuteron have the same de Broglie wavelengths. Explain which has more kinetic energy.
View SolutionWhat amount of energy sould be added to an electron to reduce its de Broglie wavelength λ1=550nm incident on it, causing the ejection of photoelectrons for which the stopping potential is Vs1=0.19V. If the radiation of wavelength λ2=190nm is now incident on the surface, (a) calculate the stopping potential VS2, (b) the work function of the surface, and (c) the threshold frequency for the surface.
View SolutionSketch the graphs, showing the variation of stopping potential Vs with frequency v of the incident radiations for two photosensitive materials A and B having threshold frequencies v0>v'0 respectively.
(i) which of the two metals A or B has higher work function?
(ii) What information do you get from the slope of the graphs?
(iii) What does the value of the intercept of graph A on the potential axis represent?
View Solution
