Which of the graphs shown below does not represent the relationship between incident light and the electron ejected from metal surface?
The correct Answer is:D
To solve the question about which graph does not represent the relationship between incident light and the electrons ejected from a metal surface, we need to analyze the principles of the photoelectric effect and the relationships involved.
1. Understanding the Photoelectric Effect:
- According to Einstein's photoelectric equation, the energy of the incident photon (light) is given by E=hν, where h is Planck's constant and ν is the frequency of the light.
- The equation can be expressed as:
hν=hν0+12mv2
where ν0 is the threshold frequency, m is the mass of the electron, and v is its velocity.
2. Analyzing the Graphs:
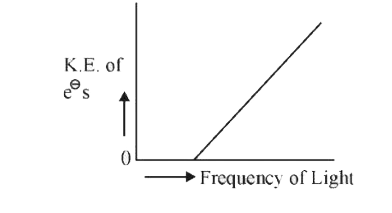
- Graph A: Represents the kinetic energy of the ejected electrons as a function of the frequency of the incident light. This is correct as per the photoelectric effect; kinetic energy increases with frequency above the threshold frequency.
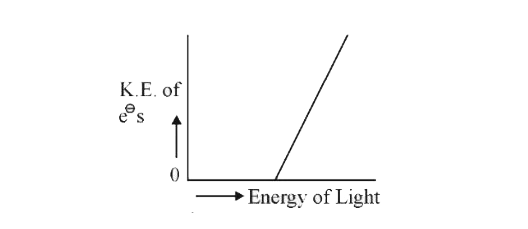
- Graph B: Indicates that the kinetic energy of electrons is directly proportional to the energy of the light. This is also correct since energy is proportional to frequency.
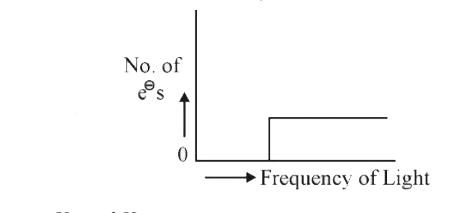
- Graph C: Suggests that the number of electrons ejected per second depends on the intensity of light but is independent of frequency. This is true; however, the graph may incorrectly imply a relationship that doesn't exist.
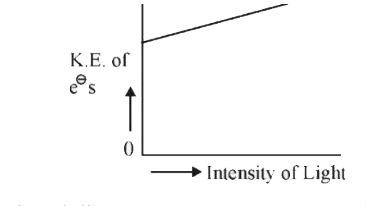
- Graph D: Shows that the kinetic energy of electrons remains constant with changes in intensity. This is incorrect because the kinetic energy of ejected electrons depends on the frequency of the incident light, not its intensity.
3. Conclusion:
- The graph that does not correctly represent the relationship between incident light and the ejected electrons is Graph D. This is because it incorrectly suggests that the kinetic energy of the electrons is constant regardless of changes in intensity, which contradicts the principles of the photoelectric effect.
Final Answer:
Graph D does not represent the relationship between incident light and the electrons ejected from a metal surface.
- According to Einstein's photoelectric equation, the energy of the incident photon (light) is given by E=hν, where h is Planck's constant and ν is the frequency of the light.
- The equation can be expressed as:
hν=hν0+12mv2
where ν0 is the threshold frequency, m is the mass of the electron, and v is its velocity.
- Graph A: Represents the kinetic energy of the ejected electrons as a function of the frequency of the incident light. This is correct as per the photoelectric effect; kinetic energy increases with frequency above the threshold frequency.
- Graph B: Indicates that the kinetic energy of electrons is directly proportional to the energy of the light. This is also correct since energy is proportional to frequency.
- Graph C: Suggests that the number of electrons ejected per second depends on the intensity of light but is independent of frequency. This is true; however, the graph may incorrectly imply a relationship that doesn't exist.
- Graph D: Shows that the kinetic energy of electrons remains constant with changes in intensity. This is incorrect because the kinetic energy of ejected electrons depends on the frequency of the incident light, not its intensity.
- The graph that does not correctly represent the relationship between incident light and the ejected electrons is Graph D. This is because it incorrectly suggests that the kinetic energy of the electrons is constant regardless of changes in intensity, which contradicts the principles of the photoelectric effect.
Graph D does not represent the relationship between incident light and the electrons ejected from a metal surface.
Topper's Solved these Questions
Similar Questions
Knowledge Check
- Question 1 - Select One
Assertion : The number of electrons ejected from a metal surface depend upon the frequency of light.
Reason : There is a time lag between the striking of light beam and the ejection of electrons from the metal surface.AIf both assertion and reason are true and reason is the correct explanation of assertion.BIf both assertion and reason are true but reason is not the correct explanation of assertion.CIf assertion is true but reason is false.DIf both assertion and reason are false. - Question 2 - Select One
Which of the following inequalities represents the graph shown below on the real number line ?
 A0<x<5B0<x≤4C−2<x≤4D1≤x≤4
 - Question 3 - Select One
Assertion : The threshold frequency of photoelectric effect supports the particle nature of light.
Reason : If frequency of incident light is less than the threshold frequency, electrons are not emitted from metal surface.AIf both assertion and reason are true and reason is the correct explanation of assertion.BIf both assertion and reason are true but reason is not the correct explanation of assertion.CIf assertion is true but reason is false.DIf both assertion and reason are false.
Linear relationship exists between incident light and rate of CO2 fixation at/in.
View SolutionIf λoandλ be the threshold wavelength and wavelength of incident light , the velocity of photoelectron ejected from the metal surface is :
View SolutionWhich of the following graphs represents the relationship between the force F between two point charges and the distance r between them :
View Solution
A metal surface in an evacuated tube is illuminated with monochromatic light causing the emission of photoelectrons. For a given intensity of light, a graph between saturation current and potential of the electrode is given in Fig. If the experiment were repeated with light of twice the intensity but the same wavelength, which of the graphs below would best represent the new relation between I and V?(Dotted represents initial condition)View SolutionWhich one of the following function best represents the graphs as shown below?
 View Solution

