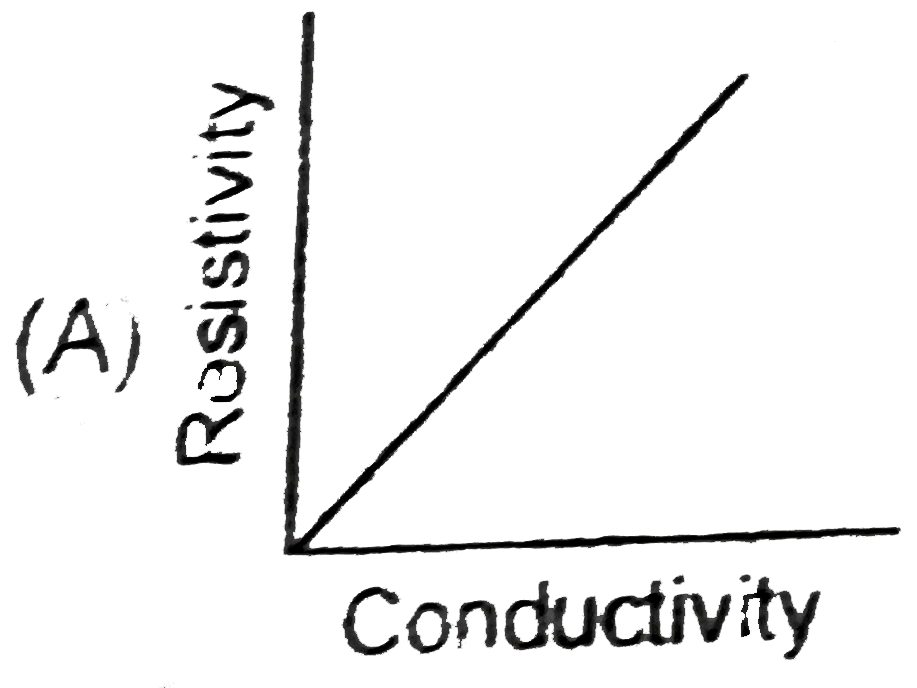
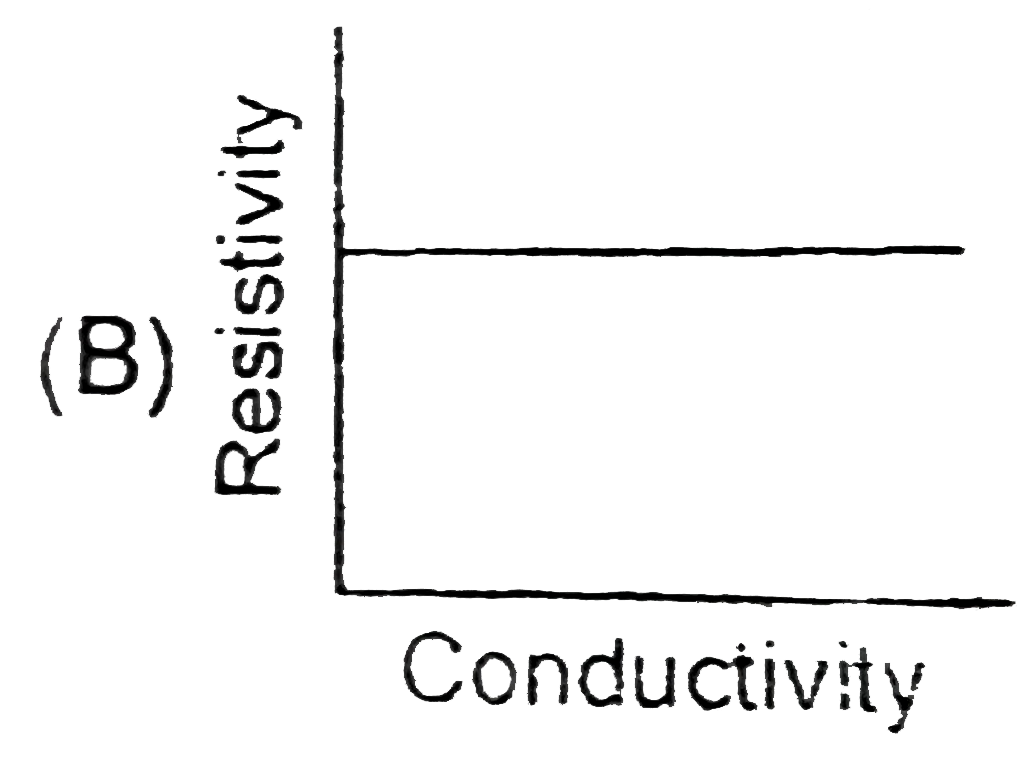
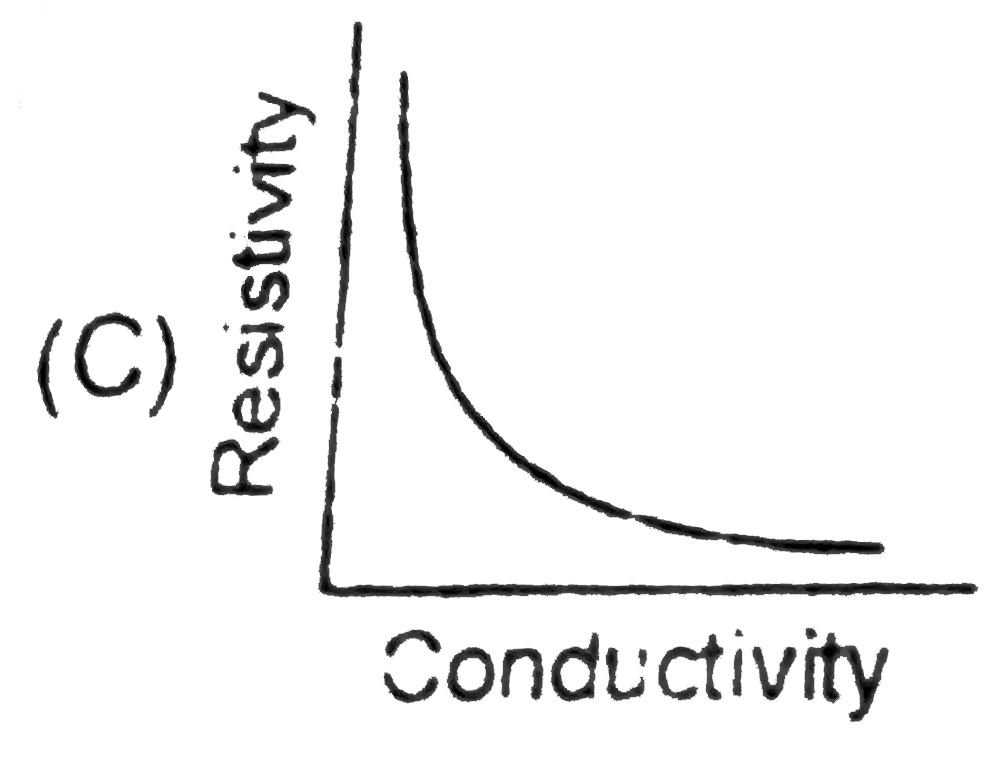
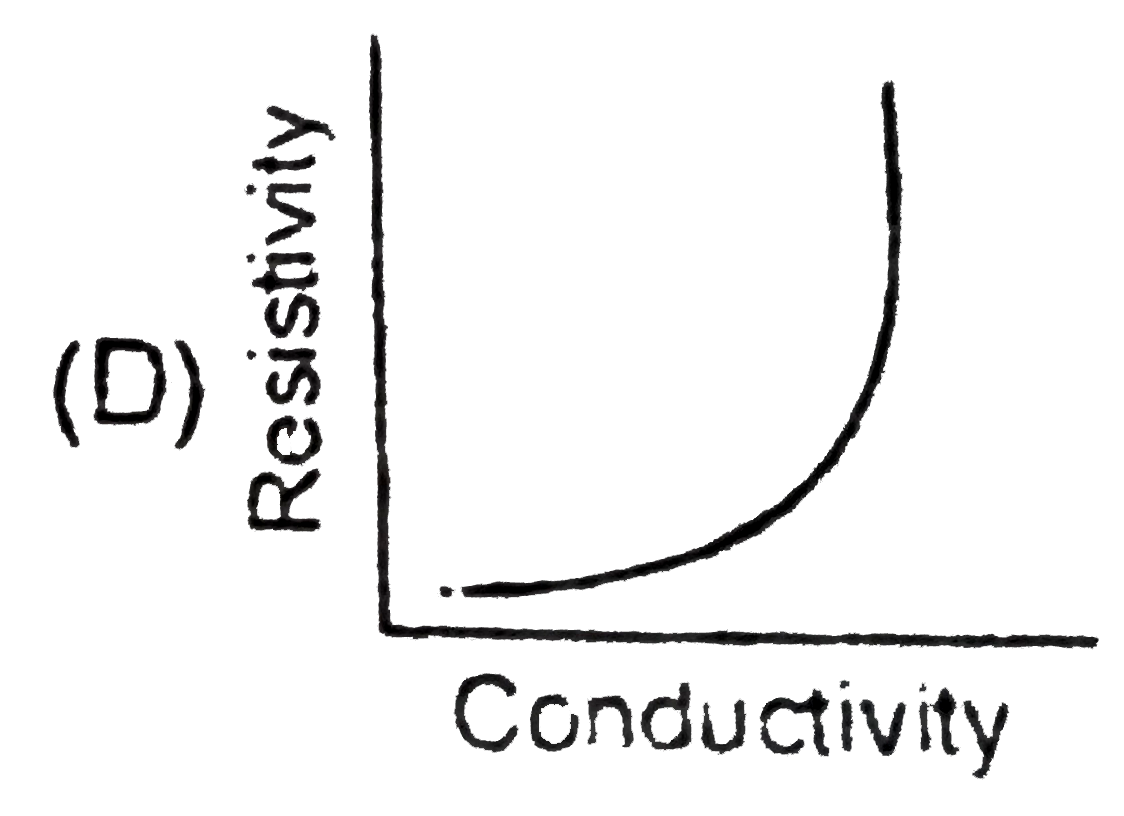
Which graph best represent the relationship between conductivity and resistivity for a solid ?
The correct Answer is:C
To determine the relationship between conductivity and resistivity for a solid, we can follow these steps:
1. Understand the Definitions:
- Conductivity (σ) is a measure of a material's ability to conduct electric current.
- Resistivity (ρ) is a measure of how strongly a material opposes the flow of electric current.
2. Establish the Relationship:
- The relationship between conductivity and resistivity is given by the formula:
σ=1ρ
- This indicates that conductivity is inversely proportional to resistivity.
3. Analyze the Implications:
- If resistivity (ρ) increases, conductivity (σ) decreases, and vice versa.
- This means that as you plot conductivity on the x-axis and resistivity on the y-axis, the graph will show a hyperbolic relationship.
4. Graphical Representation:
- The relationship can be expressed as:
σ⋅ρ=1
- Rearranging this gives us:
ρ=1σ
- This indicates that the graph will be a hyperbola, where as conductivity increases, resistivity decreases.
5. Identify the Correct Graph:
- Given the options A, B, C, and D, we need to find the graph that represents a hyperbolic curve.
- Upon examining the options, option C represents this hyperbolic relationship correctly.
6. Conclusion:
- Therefore, the graph that best represents the relationship between conductivity and resistivity for a solid is option C.
- Conductivity (σ) is a measure of a material's ability to conduct electric current.
- Resistivity (ρ) is a measure of how strongly a material opposes the flow of electric current.
- The relationship between conductivity and resistivity is given by the formula:
σ=1ρ
- This indicates that conductivity is inversely proportional to resistivity.
- If resistivity (ρ) increases, conductivity (σ) decreases, and vice versa.
- This means that as you plot conductivity on the x-axis and resistivity on the y-axis, the graph will show a hyperbolic relationship.
- The relationship can be expressed as:
σ⋅ρ=1
- Rearranging this gives us:
ρ=1σ
- This indicates that the graph will be a hyperbola, where as conductivity increases, resistivity decreases.
- Given the options A, B, C, and D, we need to find the graph that represents a hyperbolic curve.
- Upon examining the options, option C represents this hyperbolic relationship correctly.
- Therefore, the graph that best represents the relationship between conductivity and resistivity for a solid is option C.
Topper's Solved these Questions
- DAILY PRACTICE PROBLEMBOOK - RESONANCE ENGLISHCHAPTER - DAILY PRACTICE PROBLEMEXERCISE - DPP No.36
20 Videos
- DAILY PRACTICE PROBLEMBOOK - RESONANCE ENGLISHCHAPTER - DAILY PRACTICE PROBLEMEXERCISE - DPP No.37
9 Videos
- DAILY PRACTICE PROBLEMBOOK - RESONANCE ENGLISHCHAPTER - DAILY PRACTICE PROBLEMEXERCISE - DPP No.34
9 Videos
- CURRENT ELECTRICITYBOOK - RESONANCE ENGLISHCHAPTER - CURRENT ELECTRICITYEXERCISE - High Level Problems (HIP)
19 Videos
- ELECTRO MAGNETIC WAVESBOOK - RESONANCE ENGLISHCHAPTER - ELECTRO MAGNETIC WAVESEXERCISE - Exercise 3
27 Videos
Similar Questions
Knowledge Check
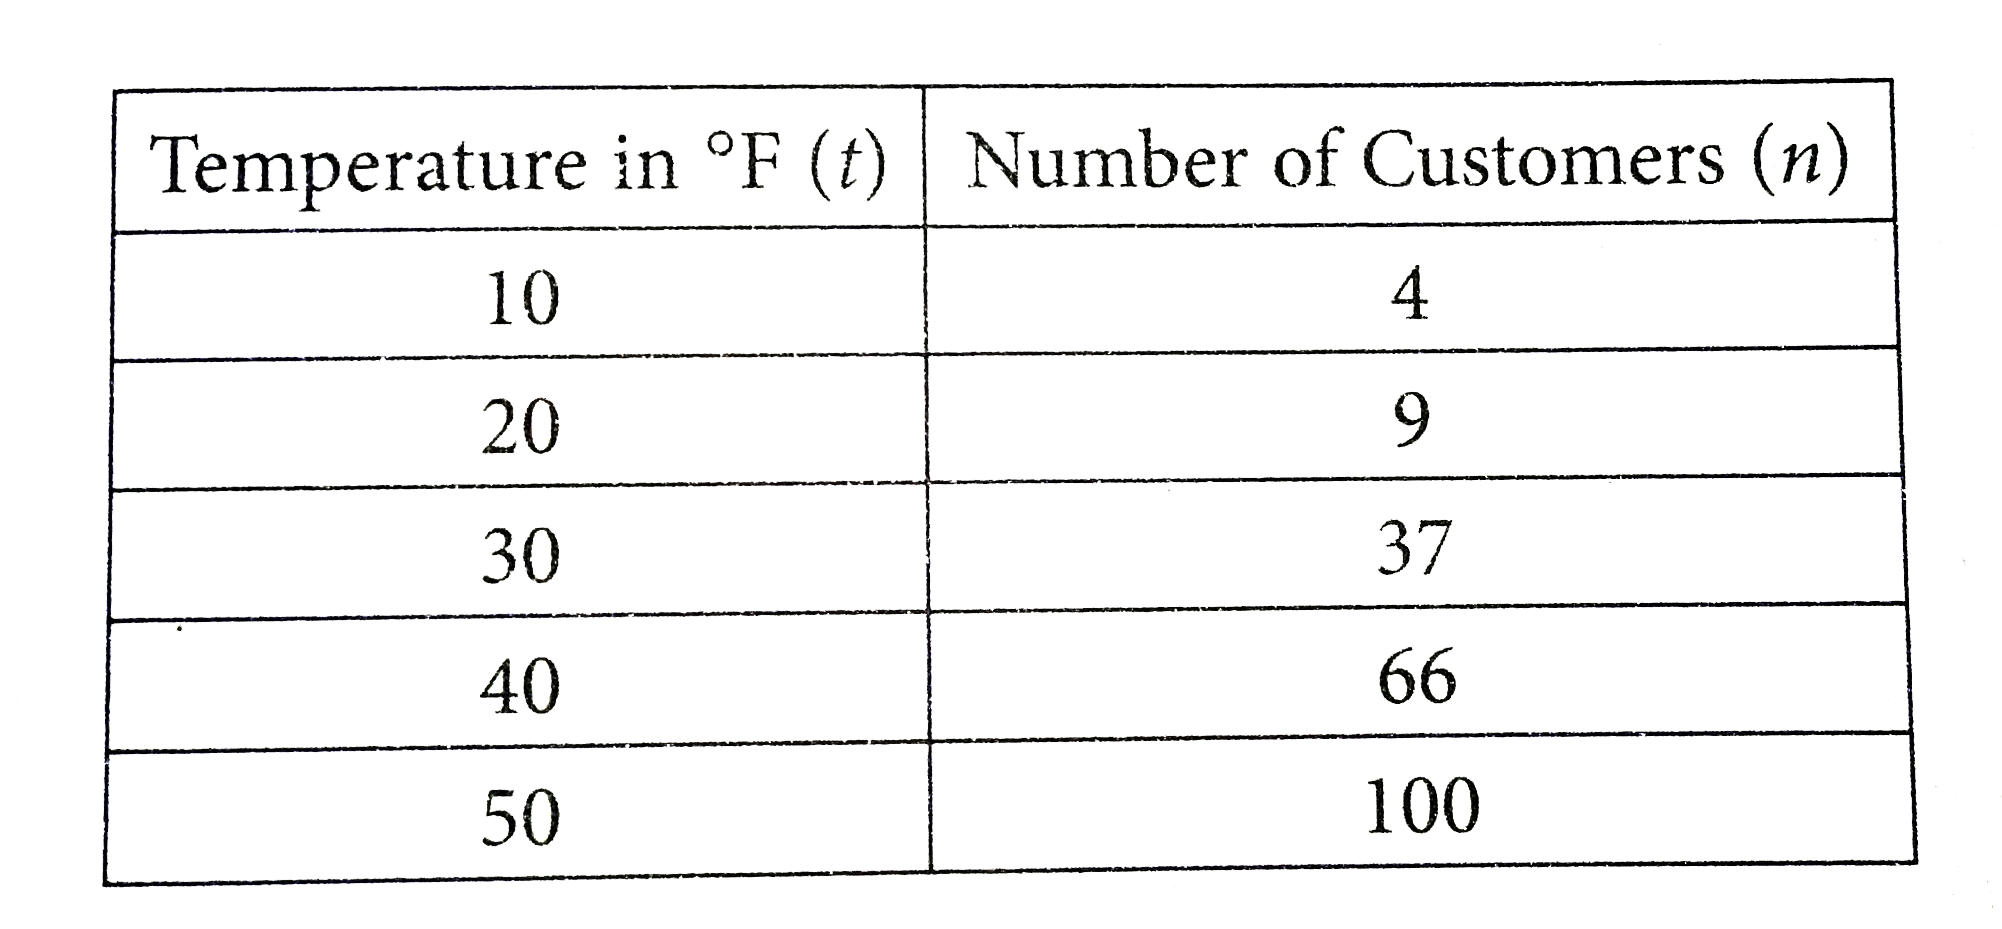
A coffee shop noticed that the outside temperature affected the number of customers who came to the shop that day, as shown in the table above. Which of the following graphs best represents the relationship between the outside temperature t, and the number of customers,n, as indicated by the table?A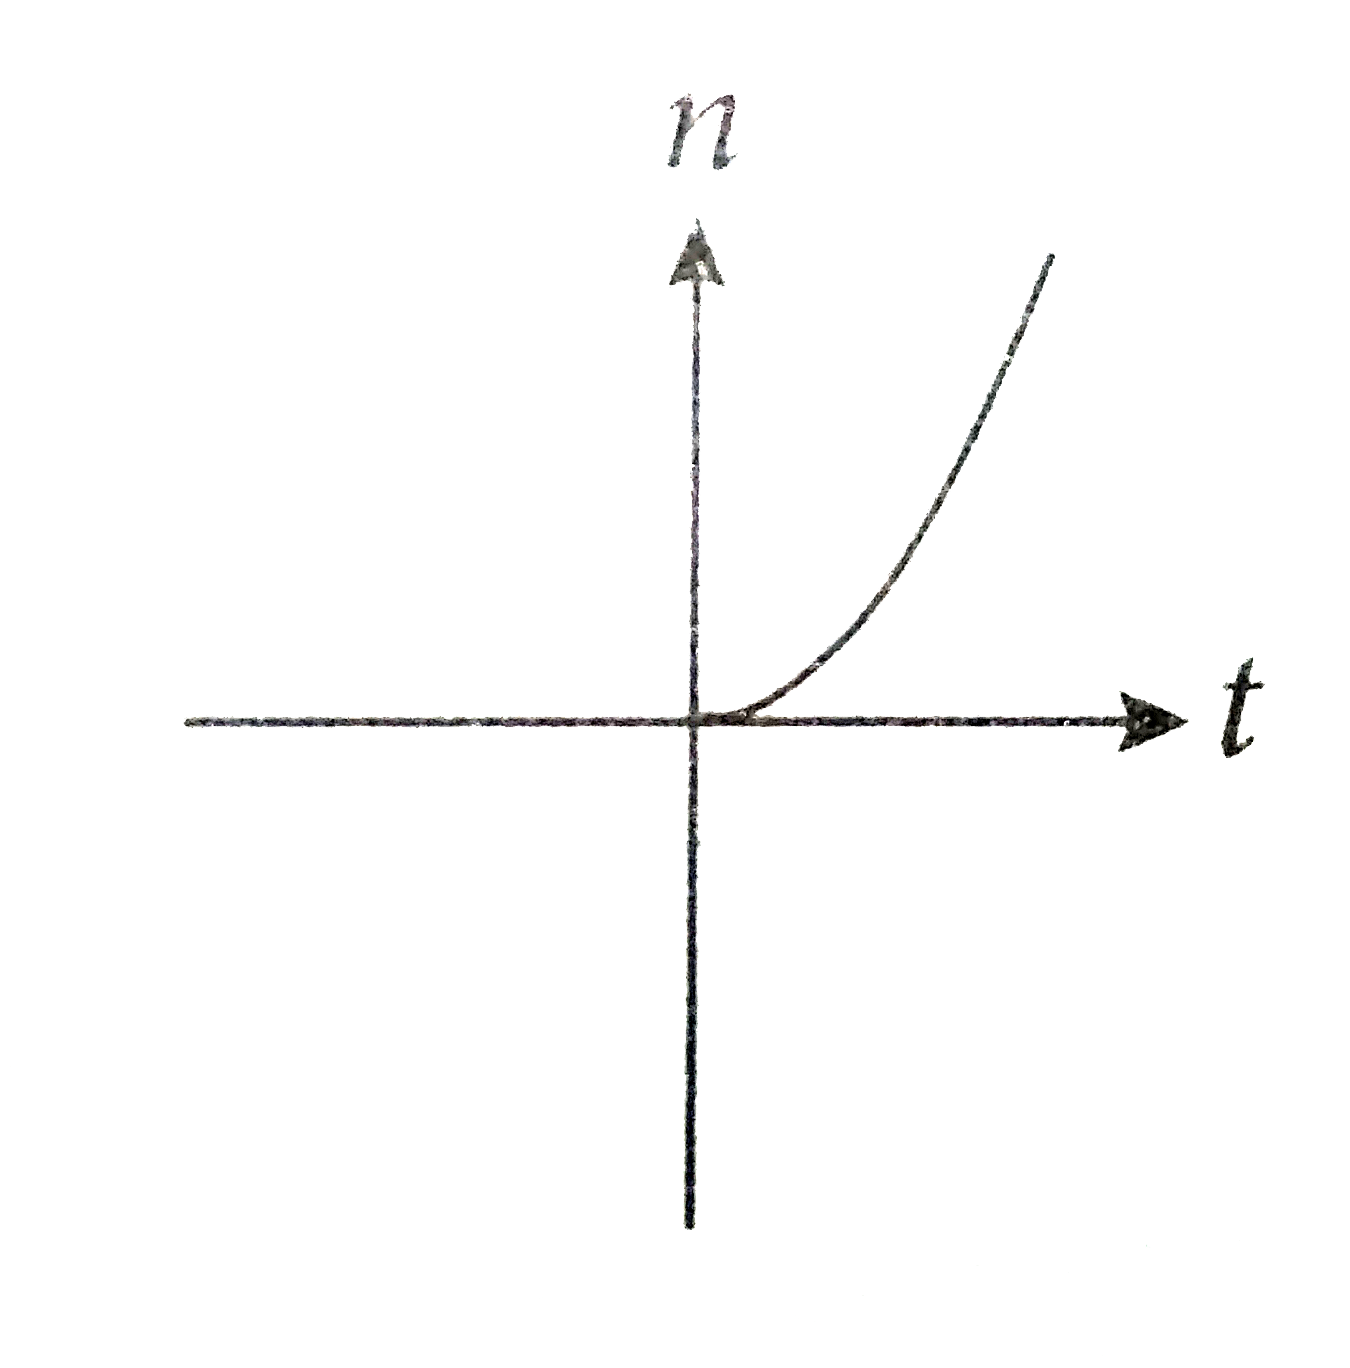 B
B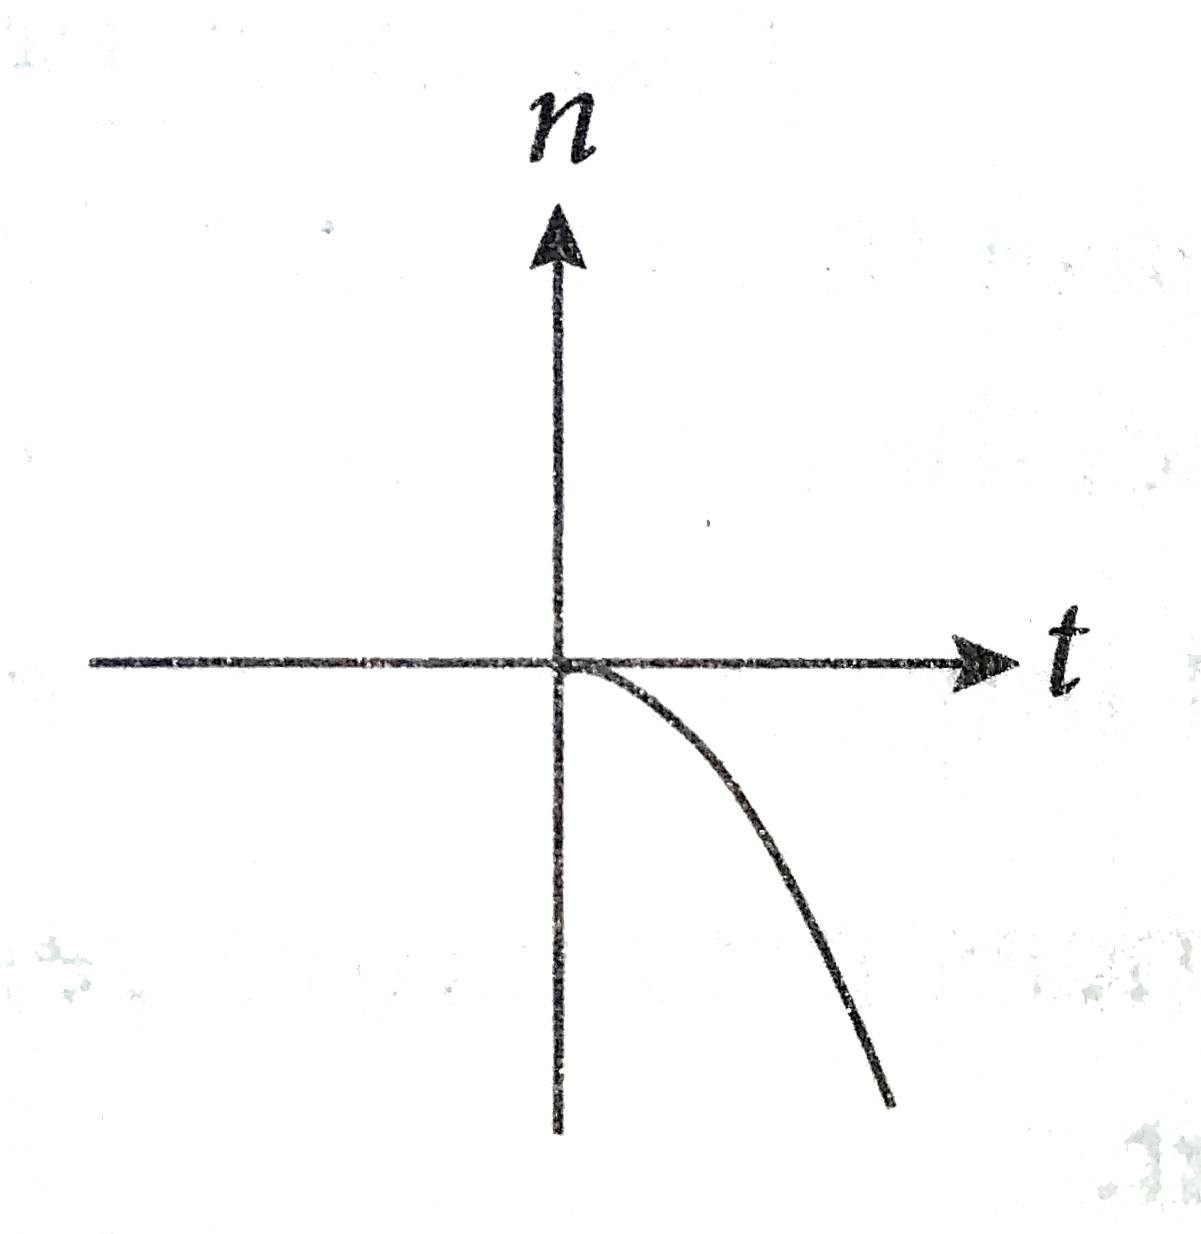 C
C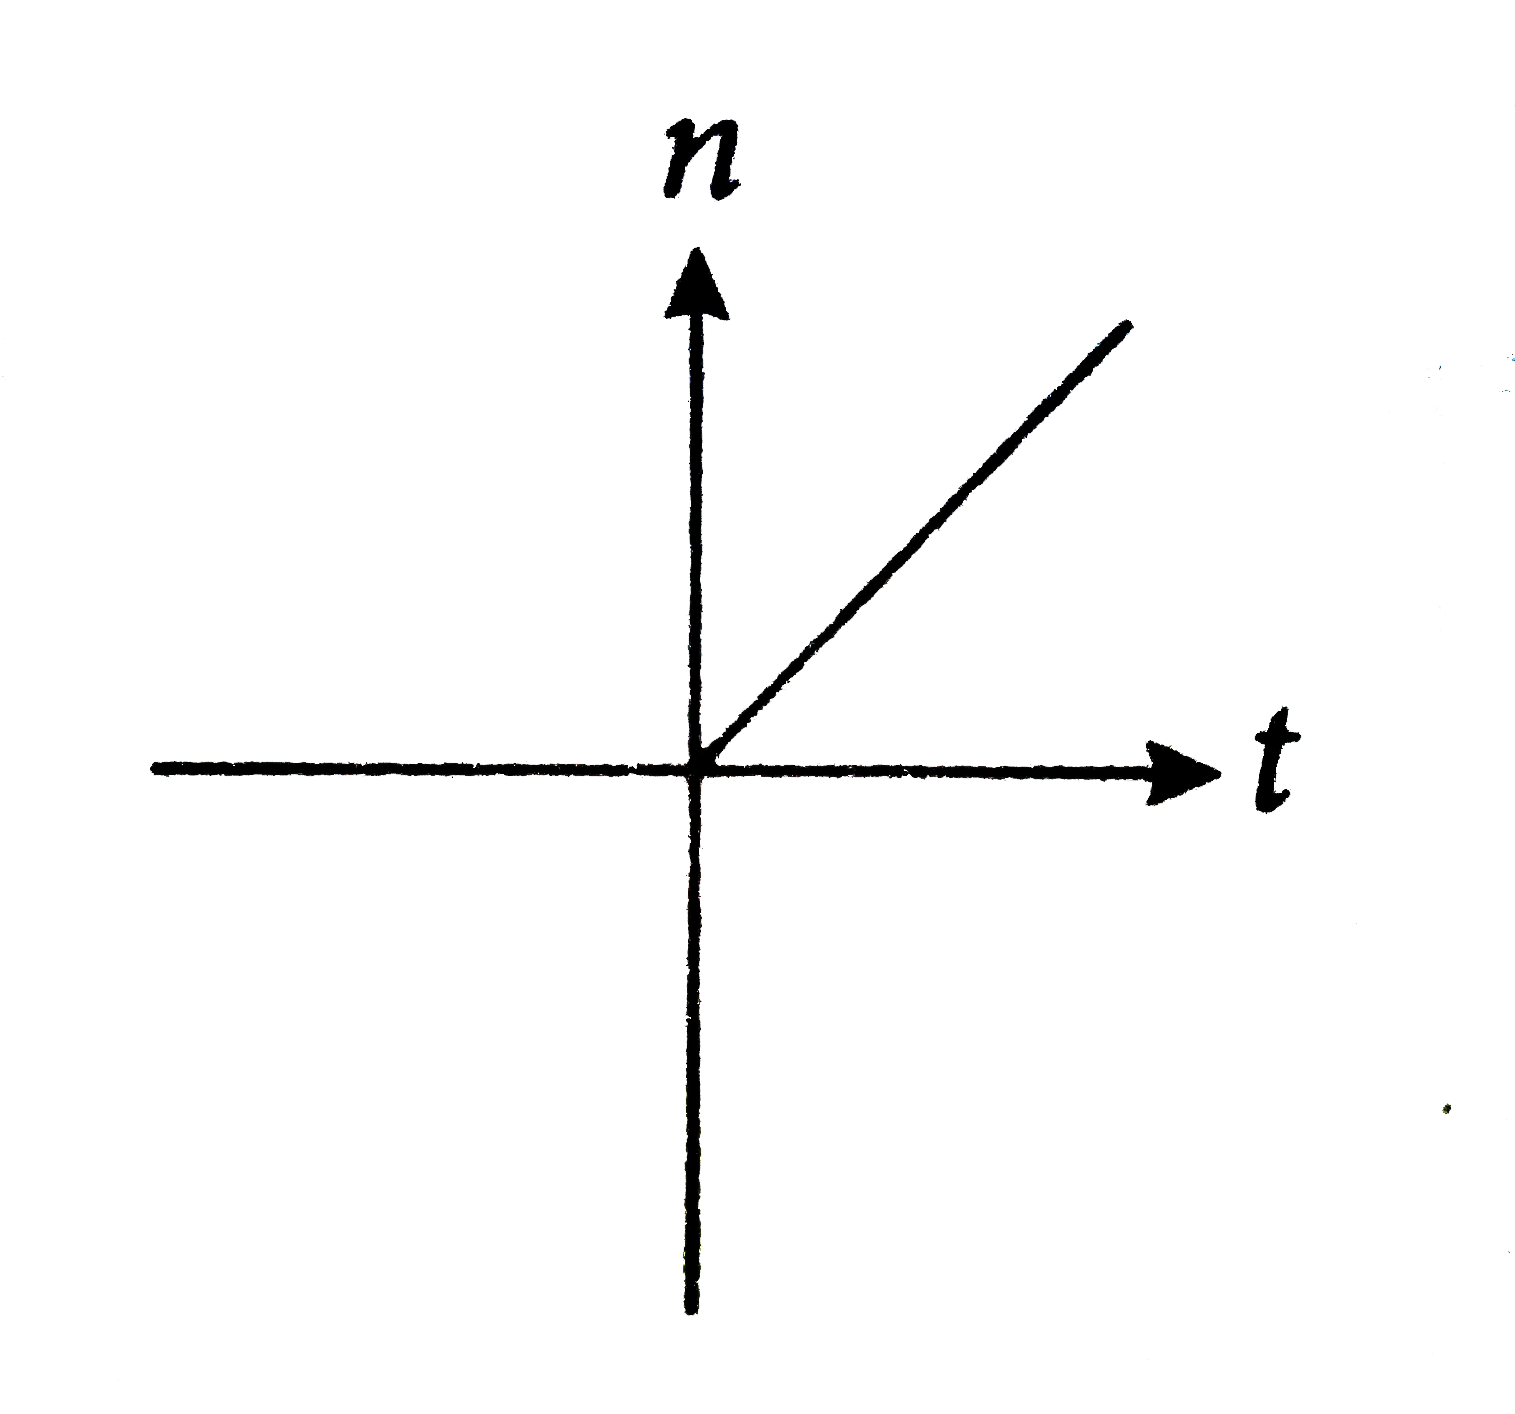 D
D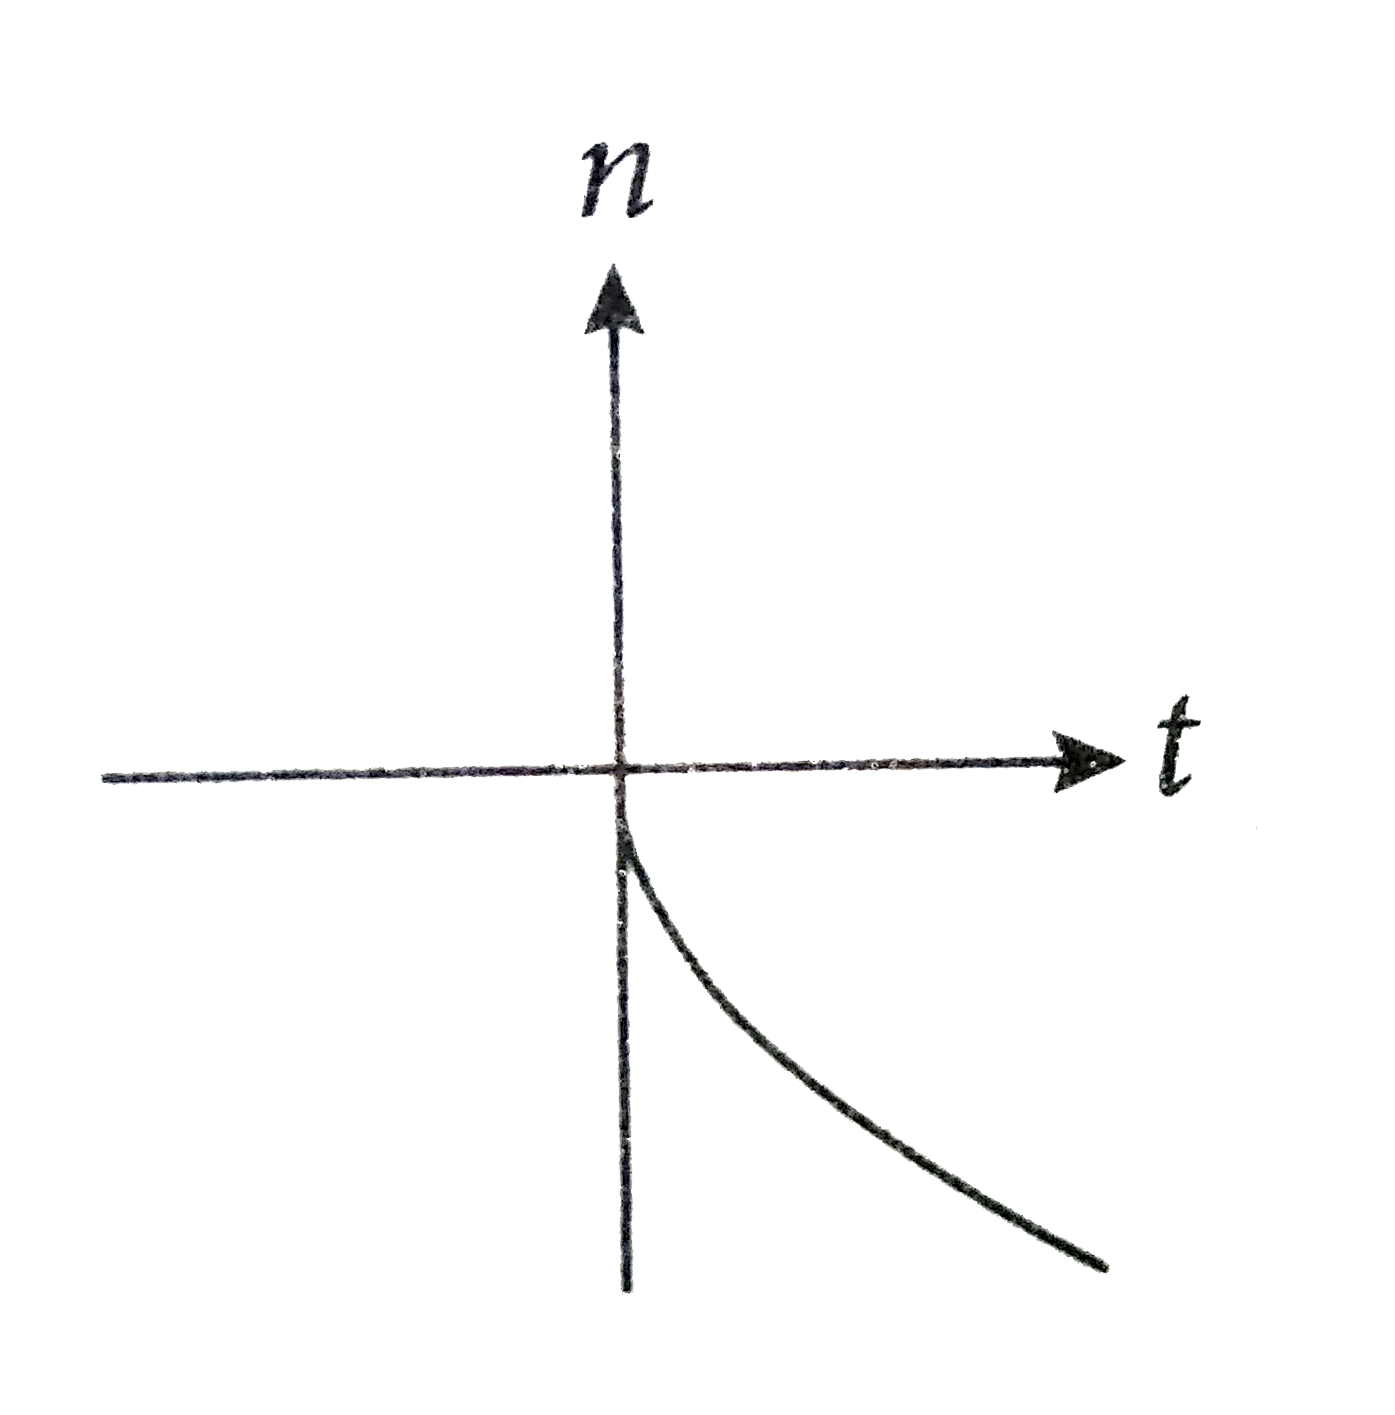
Which energy diagram best represents the given reaction ?
 A
A B
B C
C D
D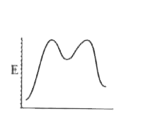
A ferry boat travels from a dock on the mainland toward an island , stops to discharge and load passengers, then returns to the mainland dock . Among the following graphs, which one best represents the relationship between the distance , in kilometers , of the ferry from the island and the time, in minutes, from when the ferry leaves the mainland dock until it returns ?
A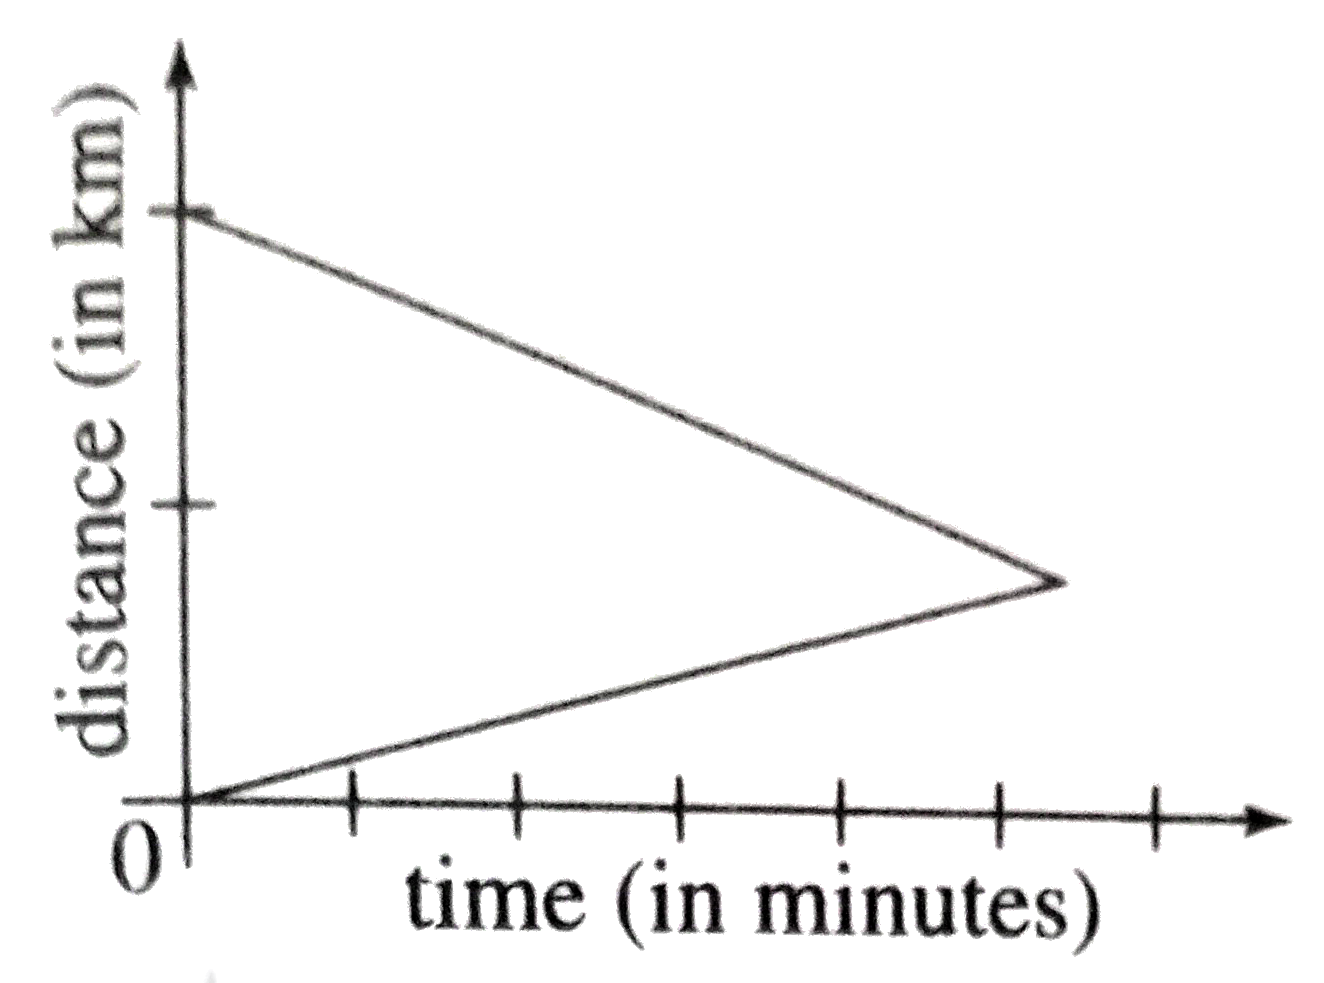 B
B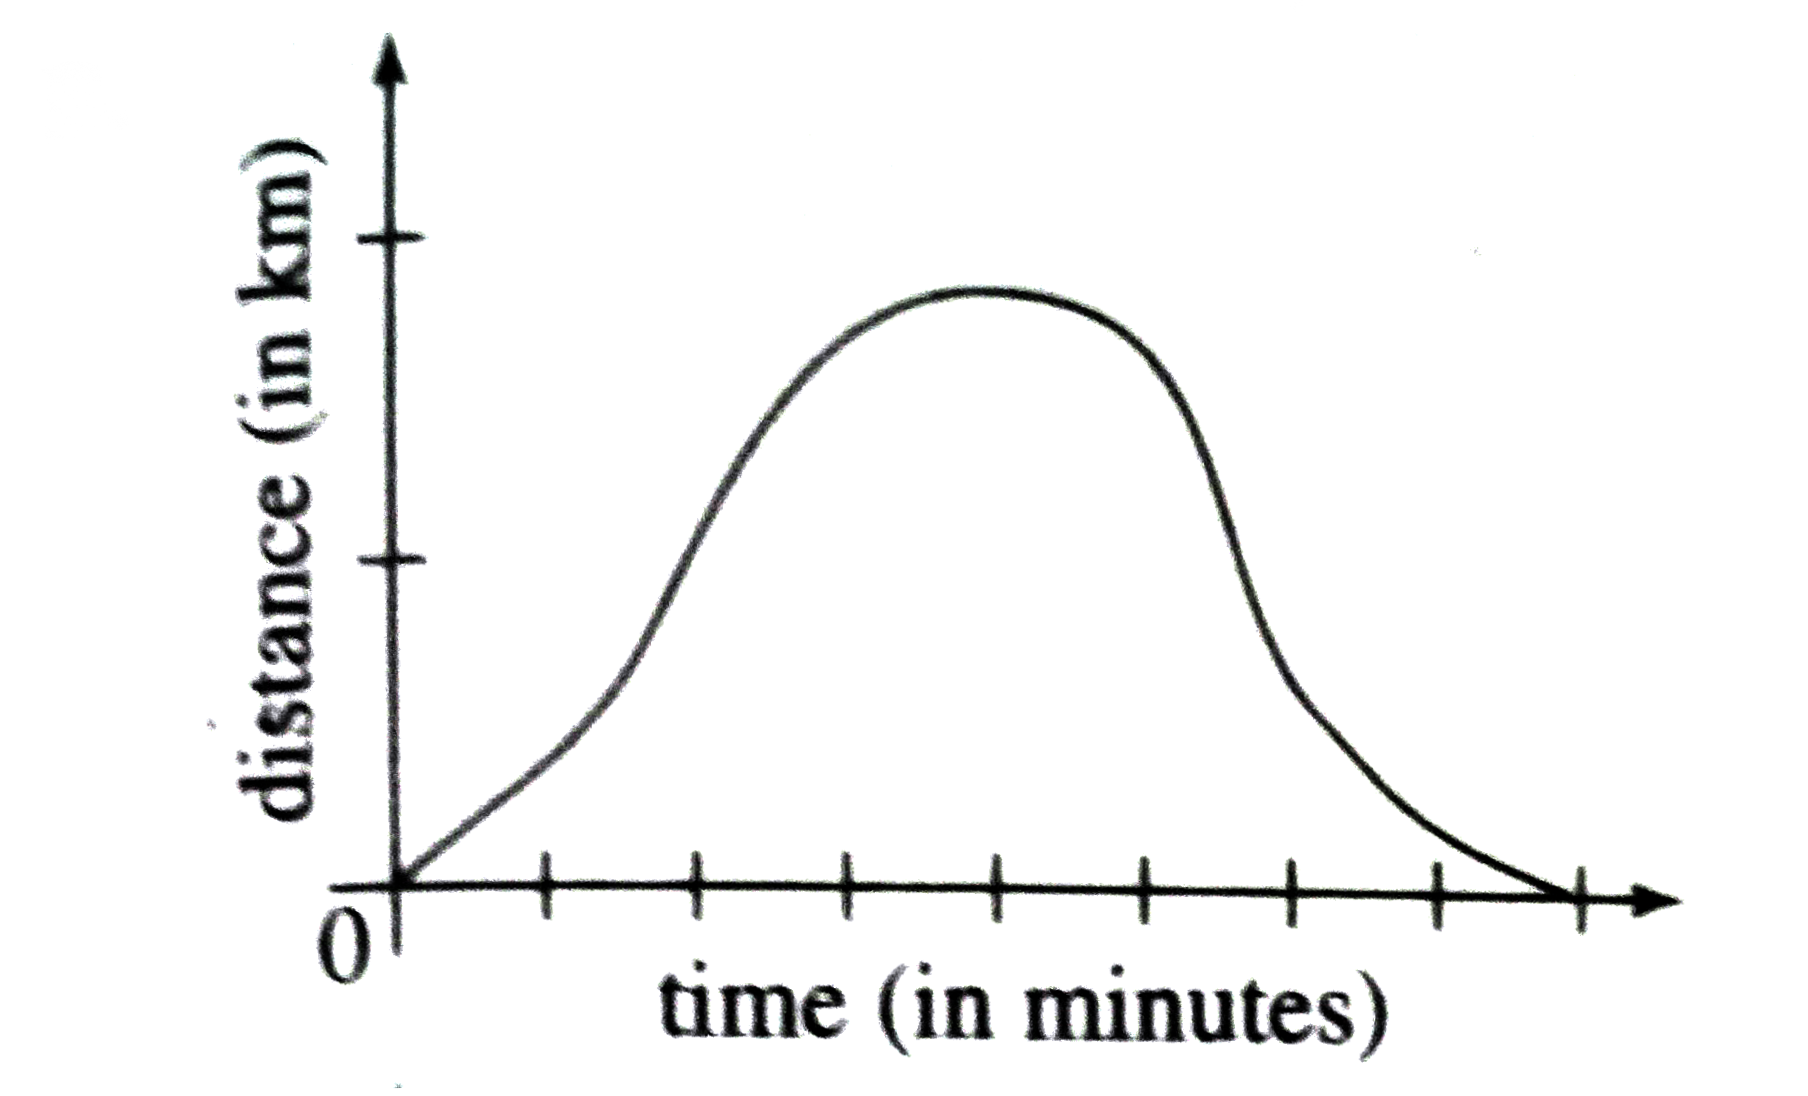 C
C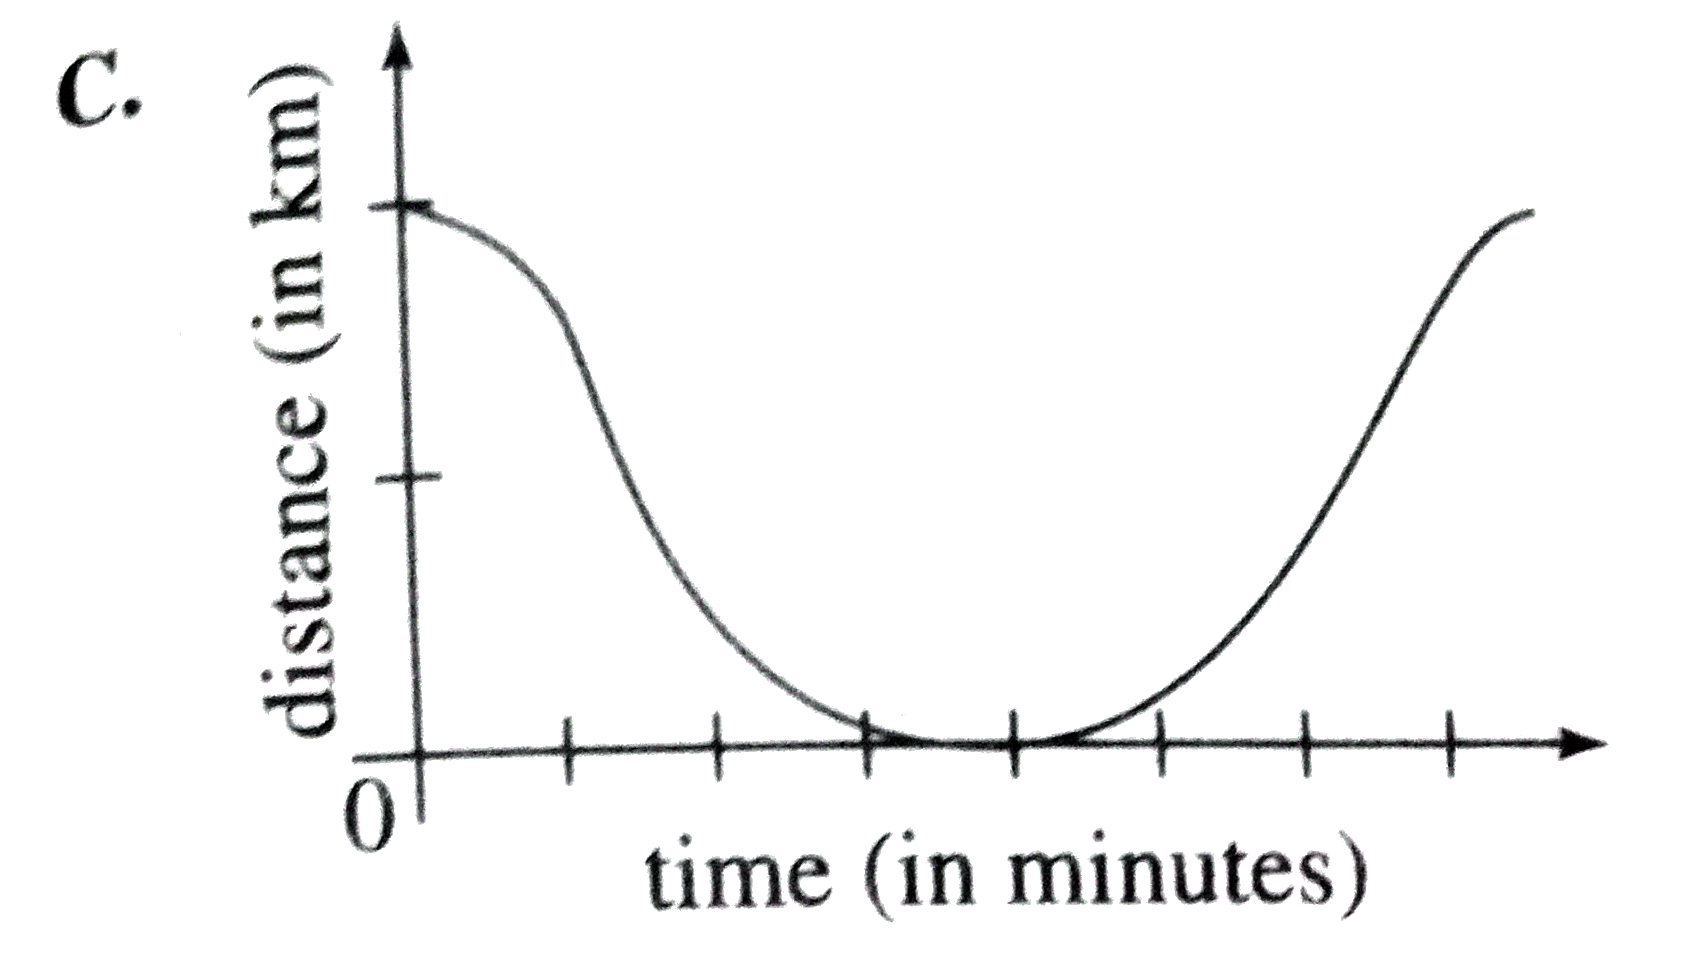 D
D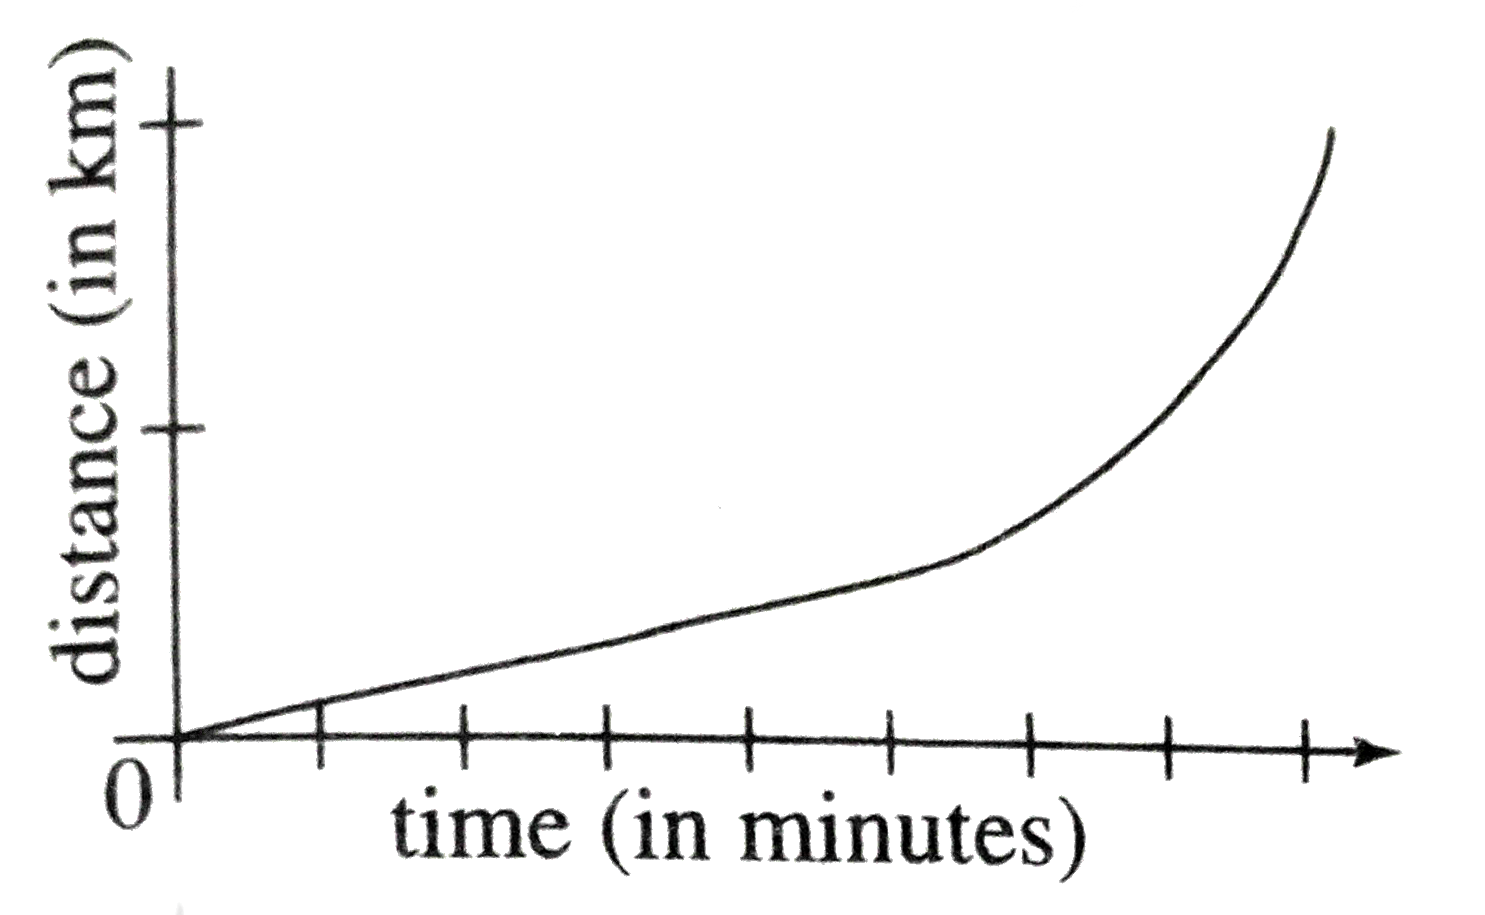
Which of the graphs shown below does not represent the relationship between incident light and the electron ejected from metal surface?
View SolutionWhich of the graphs shown below does not represent the relationship between incident light and the electron ejected from metal surface?
View SolutionA small bar magnet is being slowly inserted with constant velocity inside a solenoid as shown in figure. Which graph best represents the relationship between emf induced with time
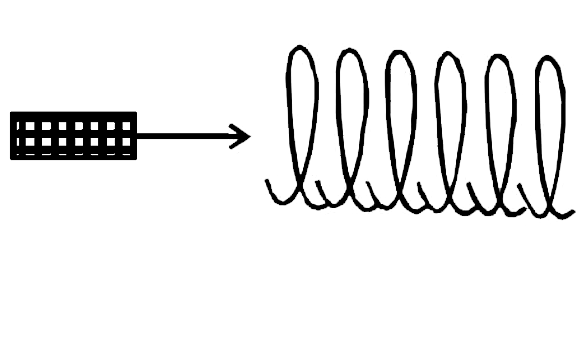
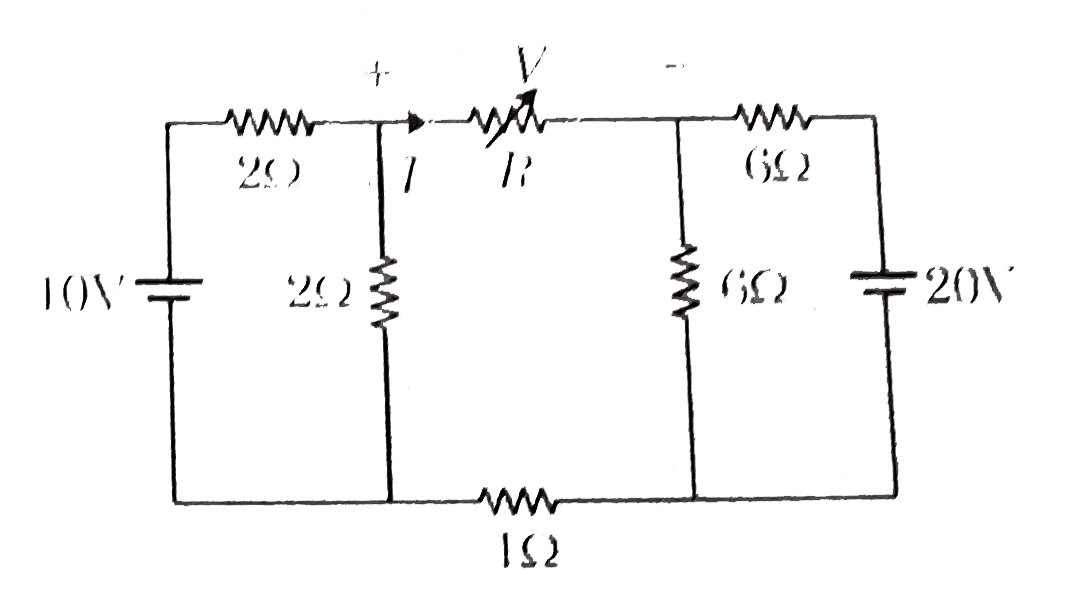
View SolutionConsider circuit as shown . Which of the graph best represent V-l relationship across the variable resistance R.
View SolutionWhich of the following graphs represents the relationship between the force F between two point charges and the distance r between them :
View Solution
