A block is placed on a rough horizontal plane. A time dependent horizontal force F=K t acts on the block K is a postive constant. Accelration-time graph of the block is
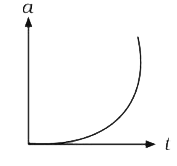
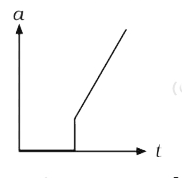
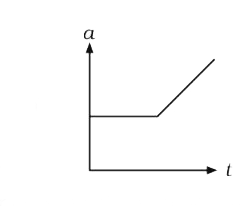

The correct Answer is:B
To solve the problem of determining the acceleration-time graph of a block subjected to a time-dependent horizontal force F=Kt on a rough horizontal plane, we can follow these steps:
Step 1: Understand the Forces Acting on the Block
The block experiences a horizontal force F=Kt and a frictional force opposing the motion. The frictional force can be static or kinetic depending on whether the block is moving or not.
Step 2: Determine the Condition for Static Friction
Initially, at t=0, the force F=Kt=0. The static friction force Fs will act to prevent the block from moving. The maximum static friction force is given by:
Fs=μsmg
where μs is the coefficient of static friction and m is the mass of the block.
Step 3: Find the Time When the Block Starts Moving
The block will start moving when the applied force F exceeds the maximum static friction force. Setting F=Fs:
Kt=μsmg
From this, we can solve for the time t at which the block starts to move:
t=μsmgK
Step 4: Analyze the Motion After the Block Starts Moving
Once the block starts moving, the frictional force becomes kinetic friction, which is given by:
Fk=μkmg
where μk is the coefficient of kinetic friction.
The net force acting on the block after it starts moving is:
Fnet=F−Fk=Kt−μkmg
Using Newton's second law Fnet=ma, we can write:
ma=Kt−μkmg
Dividing by m:
a=Kmt−μkg
Step 5: Determine the Acceleration-Time Relationship
The equation a=Kmt−μkg indicates that the acceleration a is a linear function of time t after the block starts moving. The slope of this line is Km and the y-intercept is −μkg.
Step 6: Construct the Acceleration-Time Graph
1. For t<μsmgK, the acceleration a=0 (the block does not move).
2. For t≥μsmgK, the acceleration increases linearly with time.
Conclusion
The acceleration-time graph will be:
- A horizontal line at a=0 for t<μsmgK.
- A line with a positive slope for t≥μsmgK.
The block experiences a horizontal force F=Kt and a frictional force opposing the motion. The frictional force can be static or kinetic depending on whether the block is moving or not.
Initially, at t=0, the force F=Kt=0. The static friction force Fs will act to prevent the block from moving. The maximum static friction force is given by:
Fs=μsmg
where μs is the coefficient of static friction and m is the mass of the block.
The block will start moving when the applied force F exceeds the maximum static friction force. Setting F=Fs:
Kt=μsmg
From this, we can solve for the time t at which the block starts to move:
t=μsmgK
Once the block starts moving, the frictional force becomes kinetic friction, which is given by:
Fk=μkmg
where μk is the coefficient of kinetic friction.
Fnet=F−Fk=Kt−μkmg
Using Newton's second law Fnet=ma, we can write:
ma=Kt−μkmg
Dividing by m:
a=Kmt−μkg
The equation a=Kmt−μkg indicates that the acceleration a is a linear function of time t after the block starts moving. The slope of this line is Km and the y-intercept is −μkg.
1. For t<μsmgK, the acceleration a=0 (the block does not move).
2. For t≥μsmgK, the acceleration increases linearly with time.
The acceleration-time graph will be:
- A horizontal line at a=0 for t<μsmgK.
- A line with a positive slope for t≥μsmgK.
Topper's Solved these Questions
- DYNAMICS OF A PARTICLEBOOK - VMC MODULES ENGLISHCHAPTER - DYNAMICS OF A PARTICLEEXERCISE - JEE Advance (Archive) Level - II (SINGLE OPTION CORRECT TYPE )
31 Videos
- DYNAMICS OF A PARTICLEBOOK - VMC MODULES ENGLISHCHAPTER - DYNAMICS OF A PARTICLEEXERCISE - LEVEL 2 ( NUMERICAL TYPE FOR JEE MAIN )
16 Videos
- DC CIRCUITBOOK - VMC MODULES ENGLISHCHAPTER - DC CIRCUITEXERCISE - JEE ADVANCED ARCHIVE
68 Videos
- ELECTROMAGNETIC INDUCTION & ALTERNATING CURRENTBOOK - VMC MODULES ENGLISHCHAPTER - ELECTROMAGNETIC INDUCTION & ALTERNATING CURRENTEXERCISE - IN-CHAPTER EXERCISE-G
10 Videos
Similar Questions
A block of mass 4kg is placed on a rough horizontal force plane. A time dependent horizontal force F=kt acts on the block. Here k=2Ns−1. The frictional force between the block and plane at time t=2s is (μ=0.2) a) 4 N b) 8 N c) 12 N d) 10 N
View SolutionA block of mass 4kg is placed on a rough horizontal plane A time dependent force F=kt2 acts on the block where k=2N/s2 Coefficient of friction μ=0.8 force of friction between the block and the plane at t=2s is
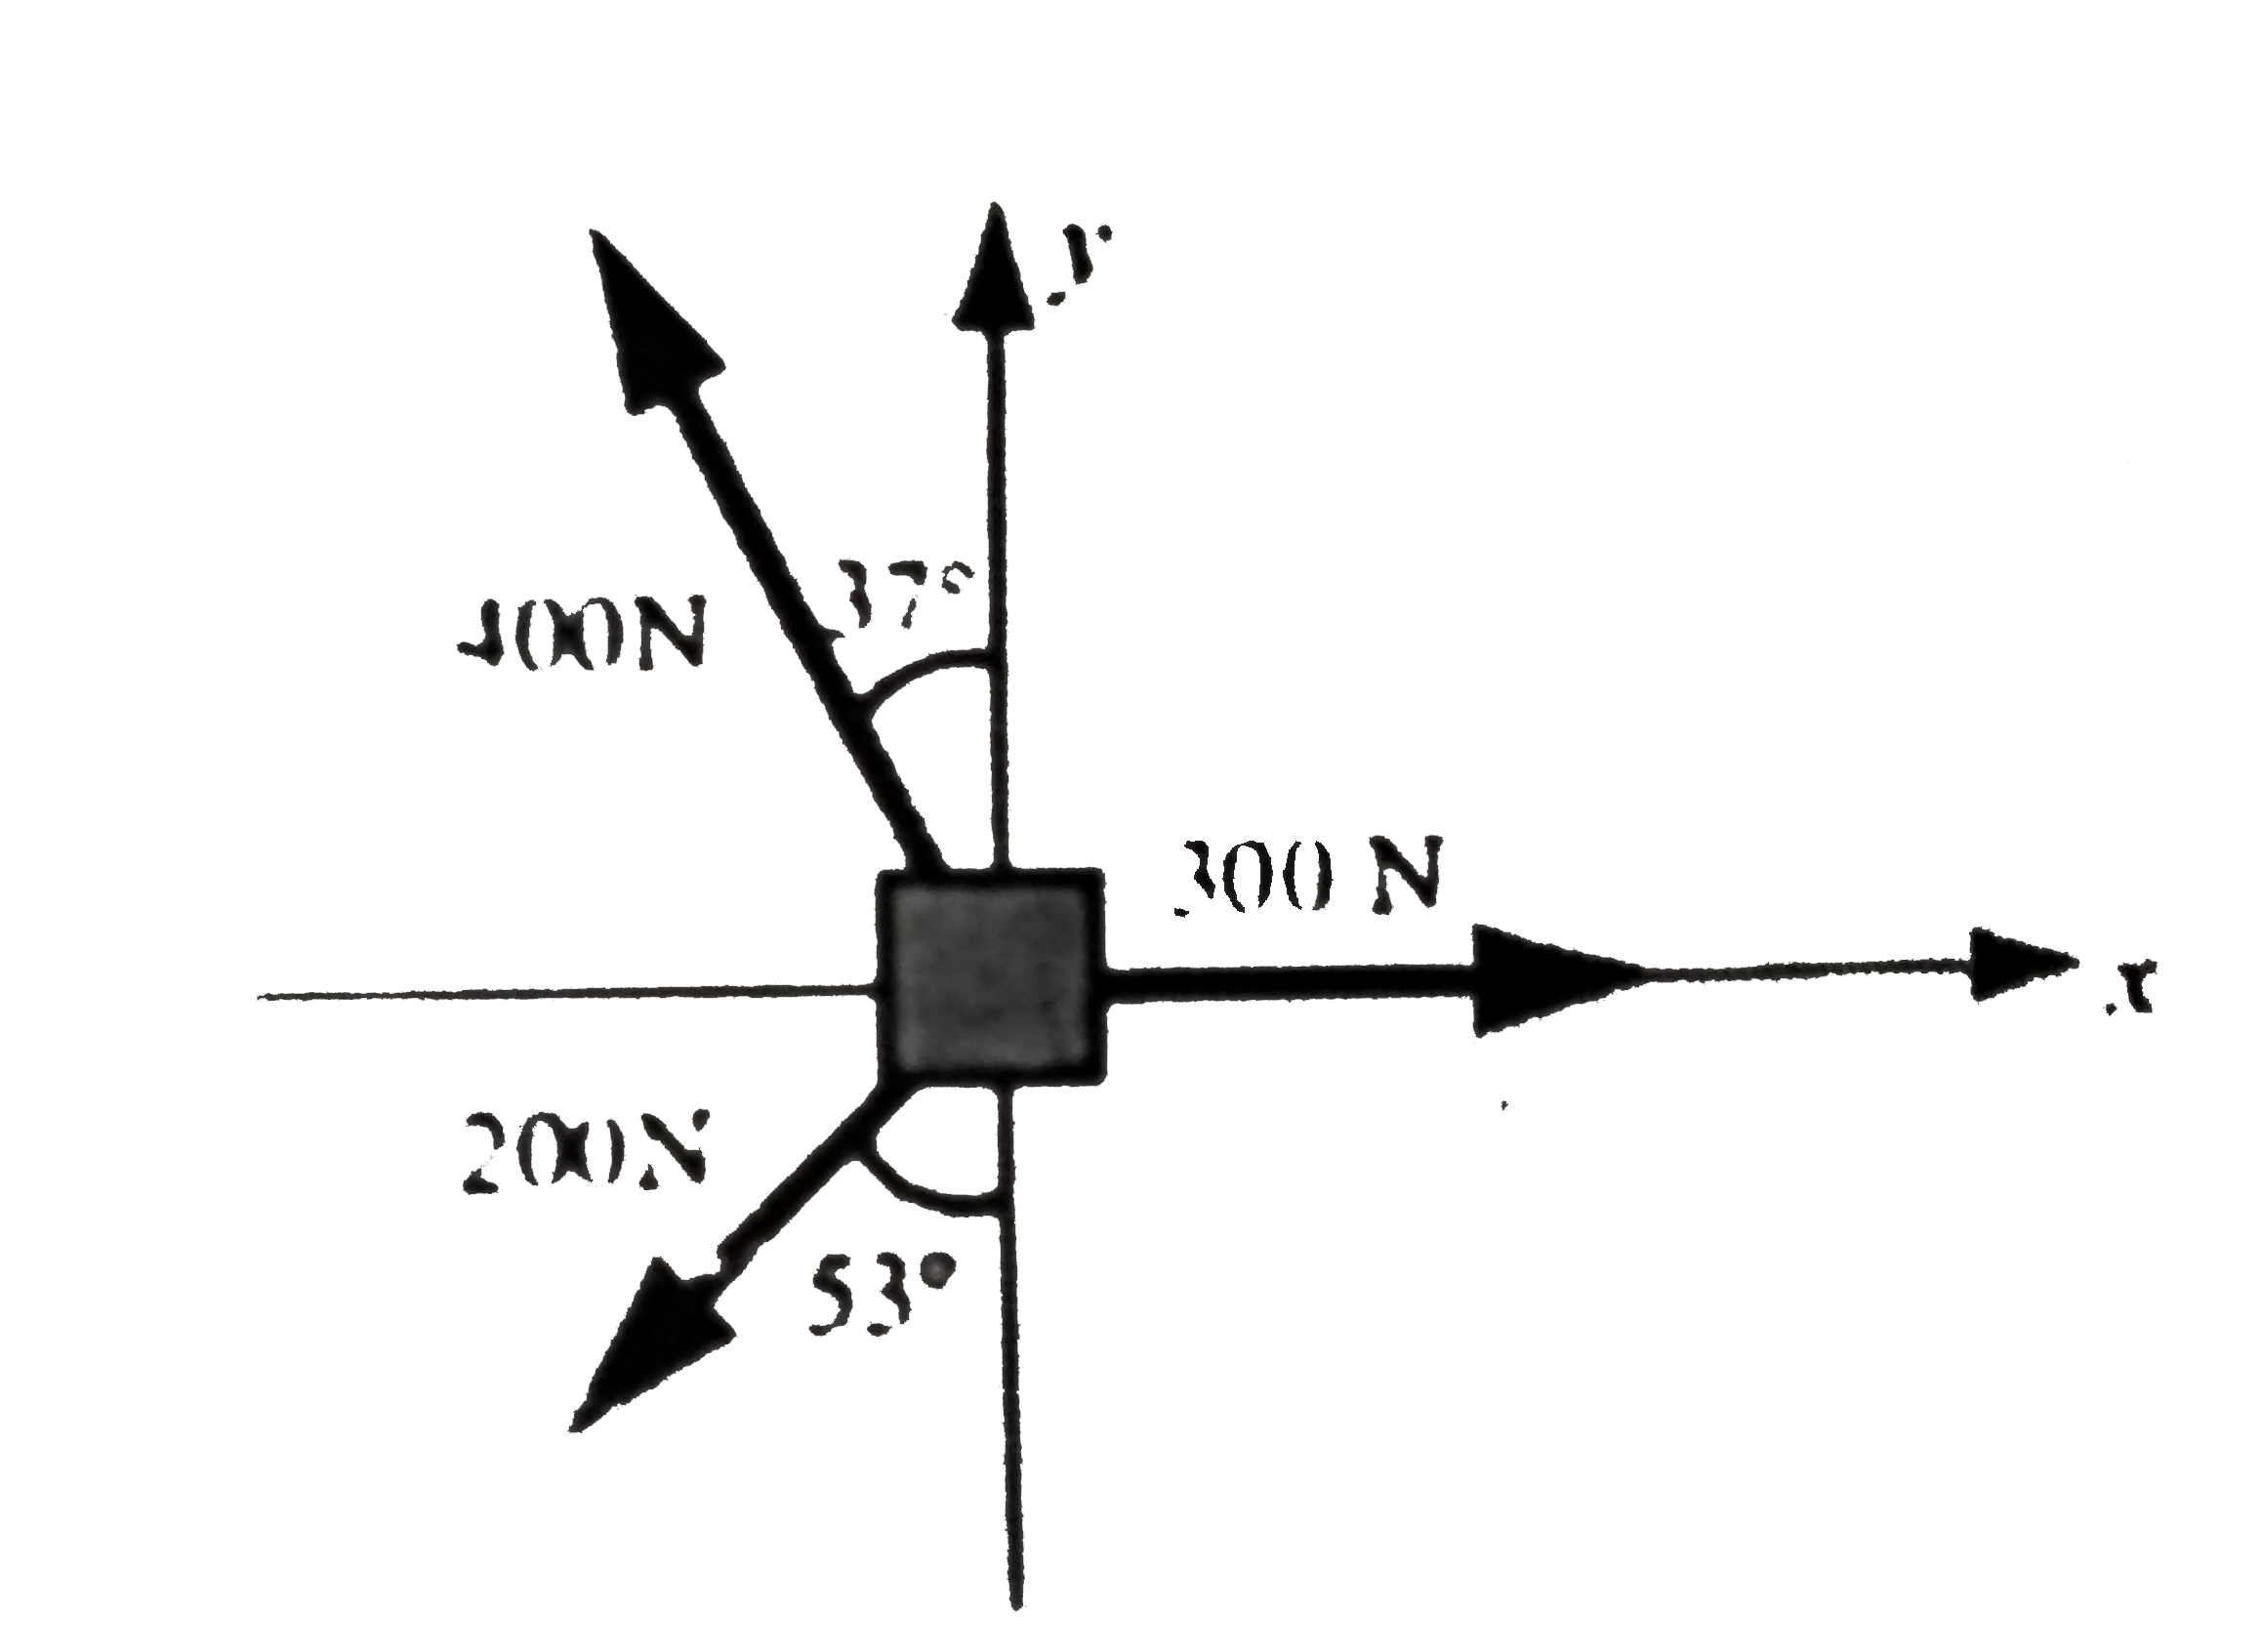
View SolutionA block is placed on a rough horizontal plane. Three horizontalforces are applied on the block as shown in the figure. If the block is in equilibrium, find the friction force acting on the block.
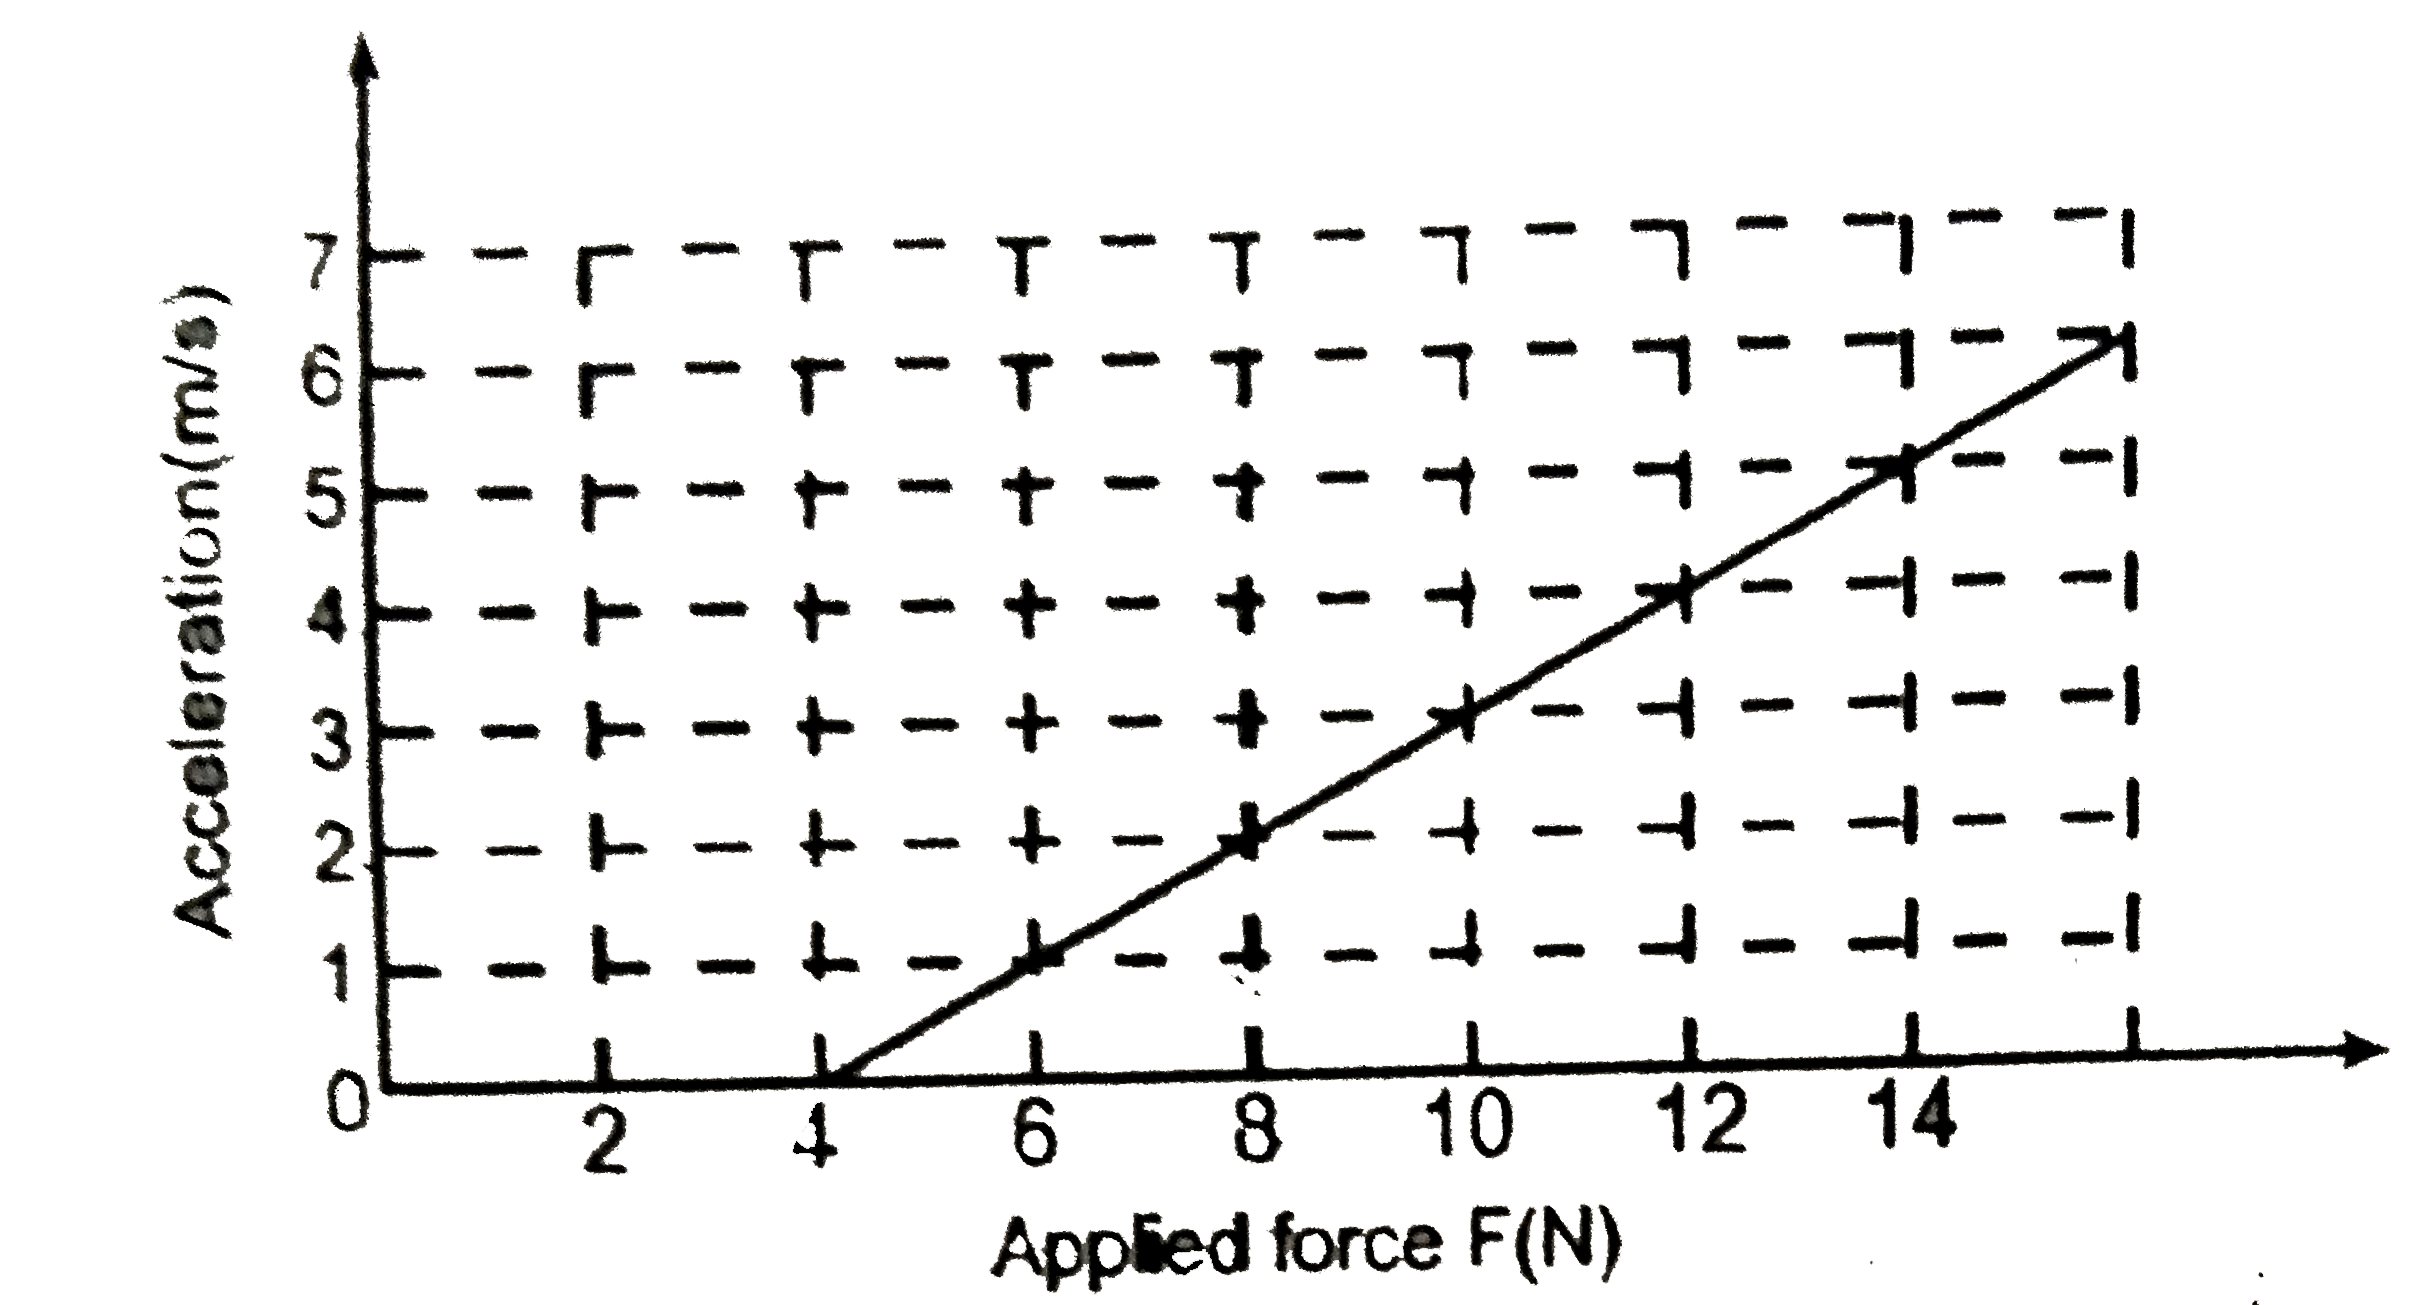
View SolutionA block of unknown mass is at rest on a rough, horizontal surface. A horizontal force F is applied to the block. The graph in the figure shows the acceleration of the block with respect to the applied force. The mass of the block is
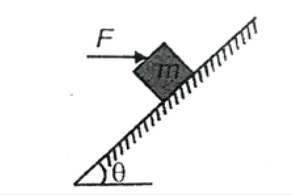
View SolutionA block is placed on a smooth inclined plane as shown . For what value of horizontal force F, the block will remain at rest ?
View SolutionA block placed on a rough horizontal surface is pulled by a horizontal force F Let f be the force applied by the rough surface on the block . Plot a graph of f versus F .
View SolutionA block is kept on a rough horizontal surface. A variable horizontal force is acting on the block as shown in the figure. At t=0, block is at rest. Kinectic energy of block at t=5sec will be (g=10m/s2)

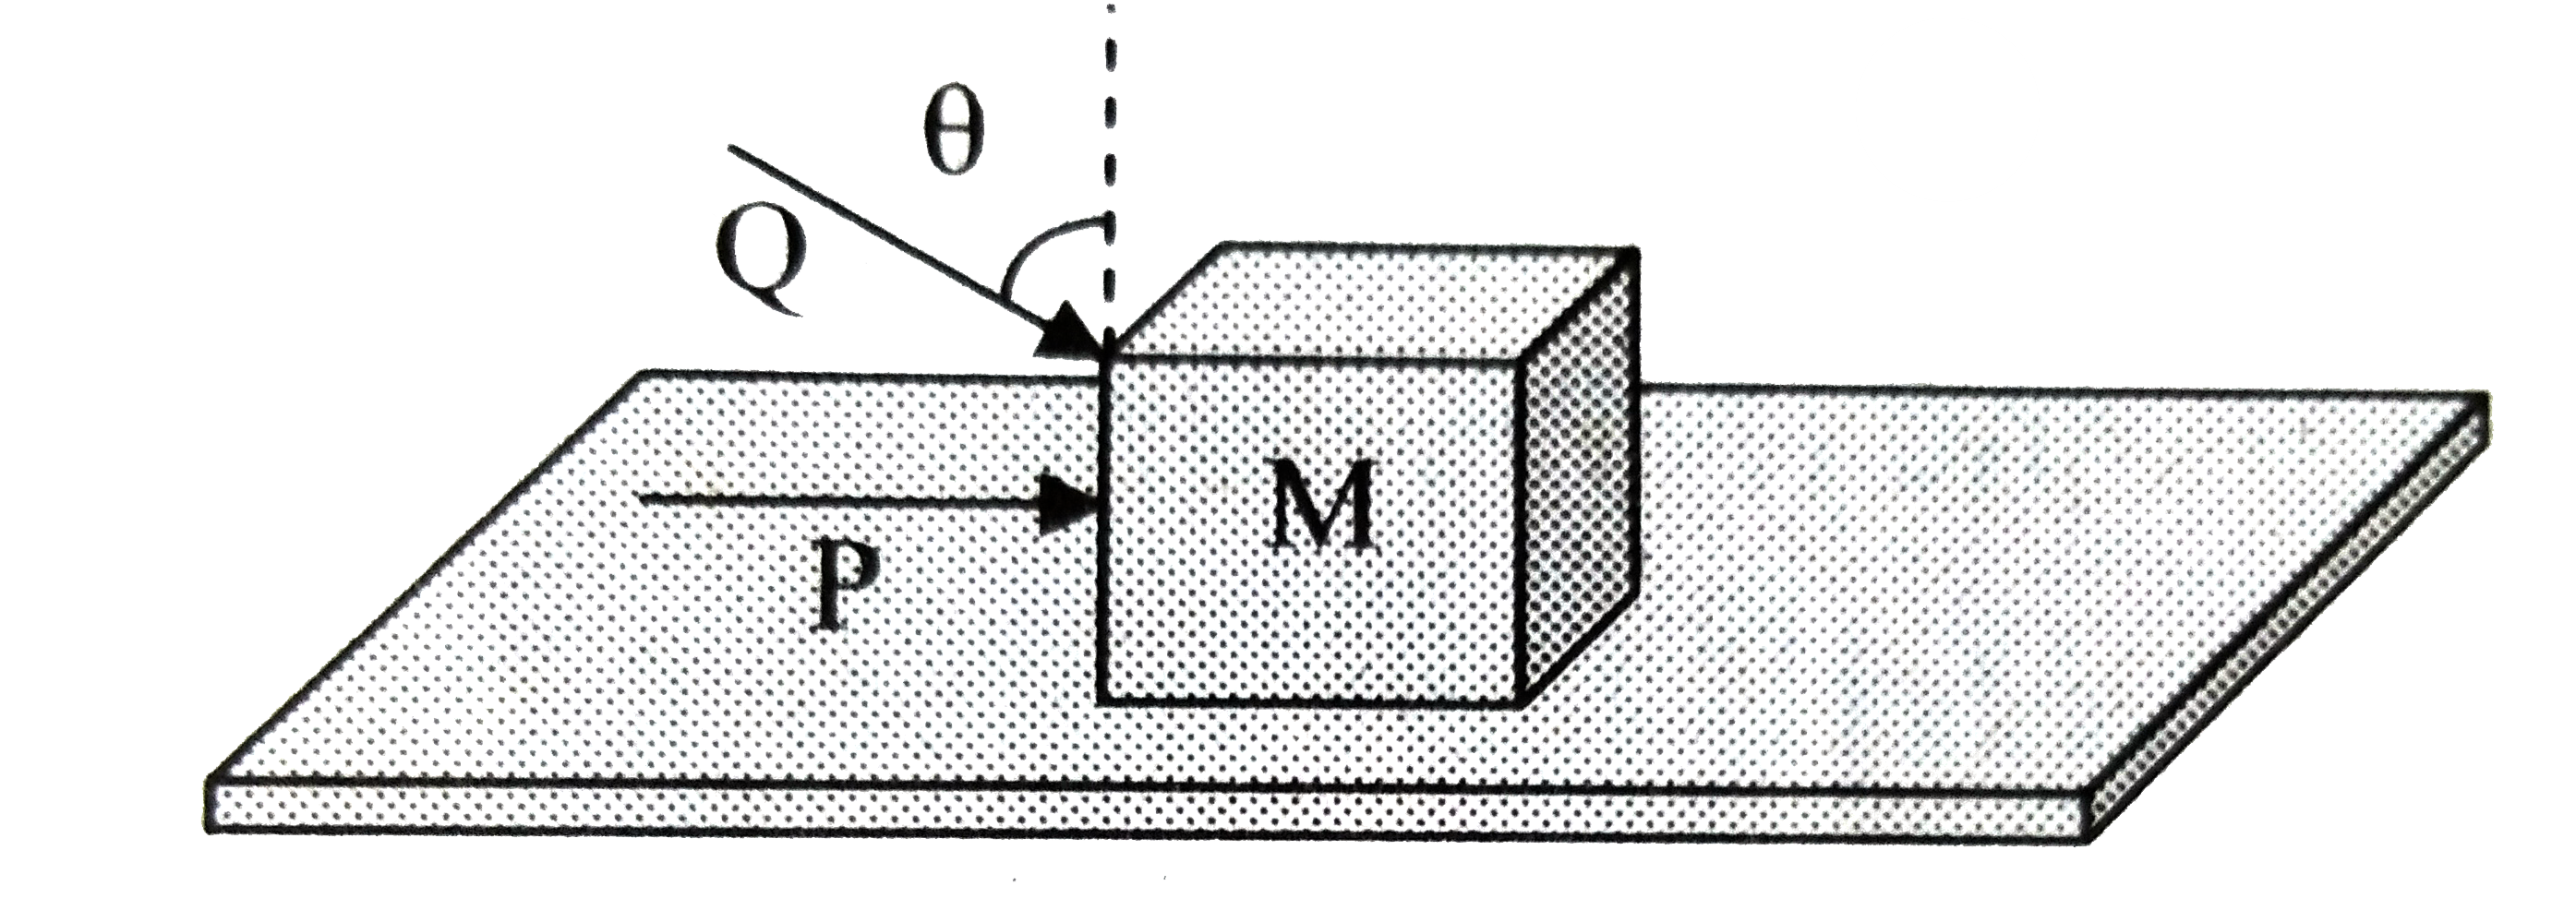
View SolutionA block of mass m lying on a rough horizontal plance is acted upon by a horizontal force P and another force Q inclined at an angle θ to the vertical. The block will remain in equilibrium, if the coefficient of friction between it and the surface is
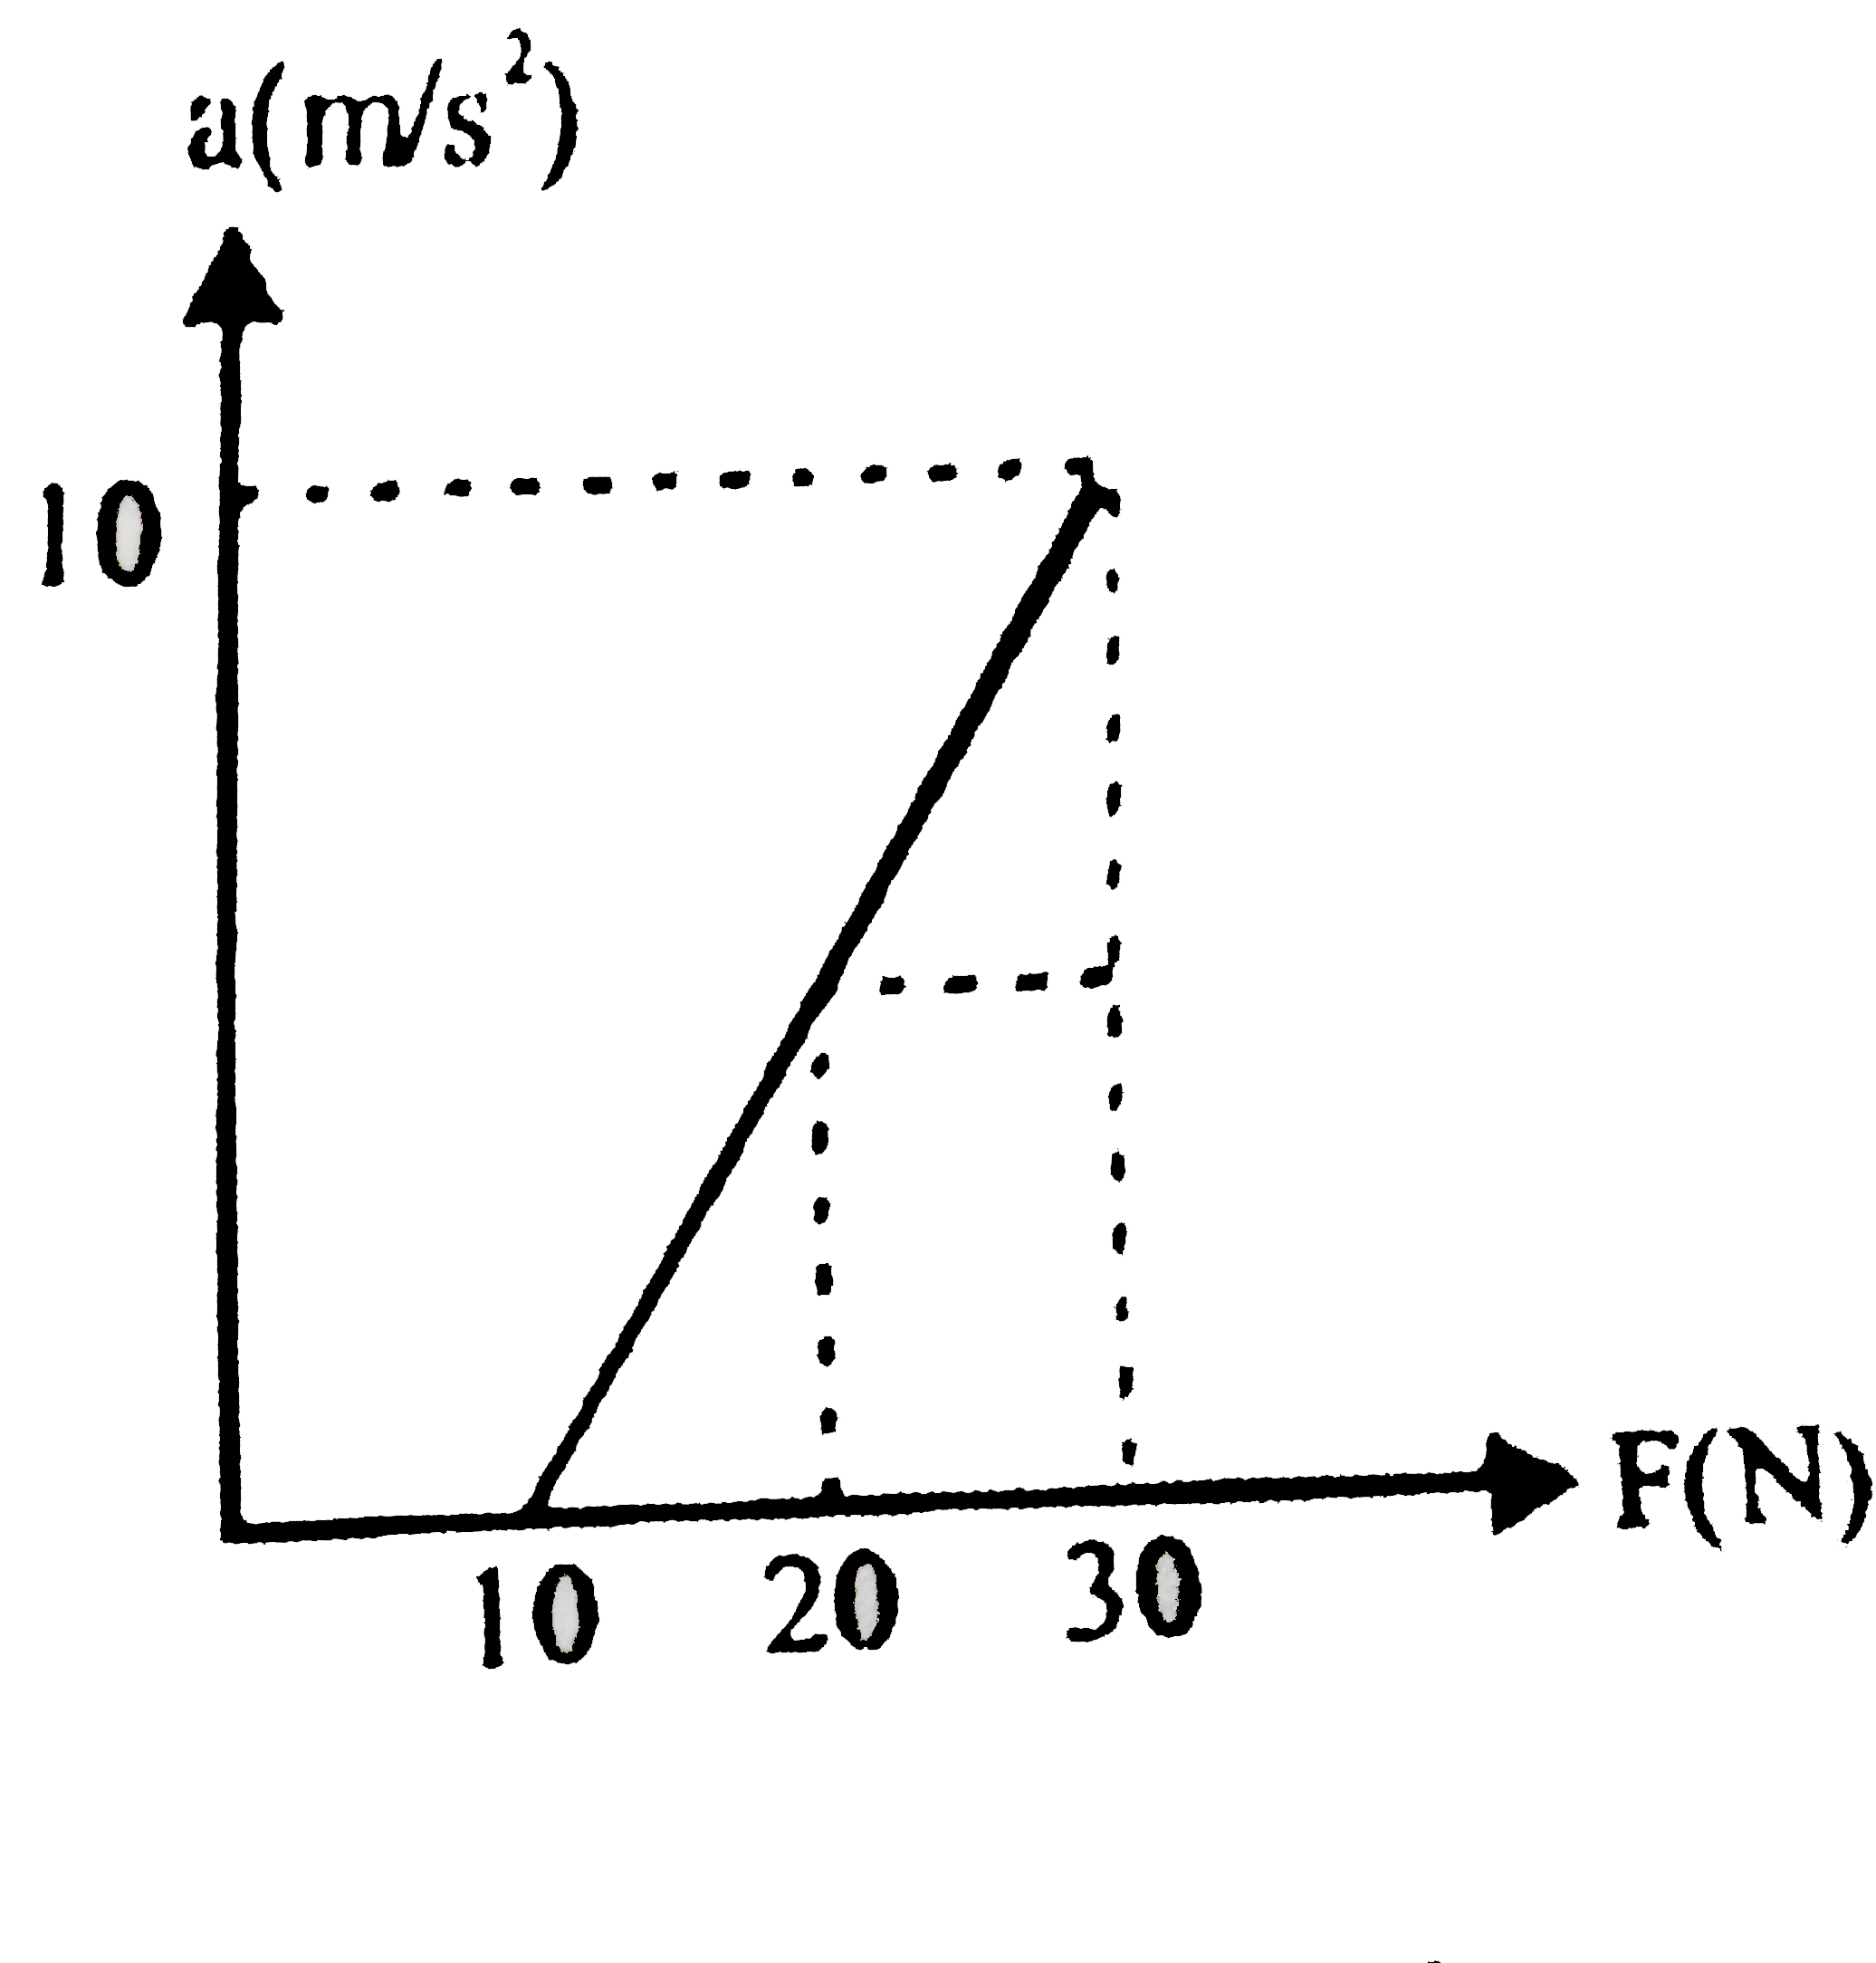
View SolutionA block placed on a rough horizontal surface is pushed with a force F acting horizontally on the block. The magnitude of F is increased and acceleration produced is plotted in the graph shown.
View SolutionTwo blocks of masses m1 and m2 are connected by an ideal sprit, of force constant k. The blocks are placed on smooth horizontal surface. A horizontal force F acts on the block m1. Initially spring is relaxed, both the blocks are at rest.

Which of the following statement is not true tn the watt of above system.
View Solution
