Corresponding to isobaric process match the following two columns.


The correct Answer is:B, D
To match the given graphs with the isobaric process, we need to analyze each graph based on the characteristics of an isobaric process. An isobaric process is defined as a thermodynamic process in which the pressure remains constant.
1. Understanding Isobaric Process:
- An isobaric process is characterized by constant pressure. This means that in a pressure-volume (P-V) graph, the line will be horizontal, indicating that as volume changes, pressure does not.
2. Analyzing Graph A (P-T Graph):
- In the P-T graph, if the line is straight and passes through the origin, it indicates that pressure is proportional to temperature (P ∝ T).
- Since pressure changes with temperature in this graph, it does not represent an isobaric process.
- Conclusion: Graph A is not isobaric.
3. Analyzing Graph B (P-V Graph):
- In this graph, if the pressure remains constant while the volume changes, it represents an isobaric process.
- A horizontal line in a P-V graph indicates constant pressure.
- Conclusion: Graph B is isobaric.
4. Analyzing Graph C (T-V Graph):
- For a constant pressure process, the relationship between temperature and volume can be derived from the ideal gas law (PV = nRT). If pressure is constant, volume is directly proportional to temperature (V ∝ T).
- In a T-V graph, this relationship would appear as a straight line. If the graph is curved or not linear, it does not represent an isobaric process.
- Conclusion: Graph C is not isobaric.
5. Analyzing Graph D (P-T Graph):
- Similar to Graph A, if the pressure remains constant across different temperatures in a P-T graph, it indicates an isobaric process.
- If the graph shows a horizontal line at a certain pressure level, it confirms that pressure is constant for varying temperatures.
- Conclusion: Graph D is isobaric.
Final Matching:
- Isobaric Process: Graphs B and D.
- Not Isobaric Process: Graphs A and C.
- An isobaric process is characterized by constant pressure. This means that in a pressure-volume (P-V) graph, the line will be horizontal, indicating that as volume changes, pressure does not.
- In the P-T graph, if the line is straight and passes through the origin, it indicates that pressure is proportional to temperature (P ∝ T).
- Since pressure changes with temperature in this graph, it does not represent an isobaric process.
- Conclusion: Graph A is not isobaric.
- In this graph, if the pressure remains constant while the volume changes, it represents an isobaric process.
- A horizontal line in a P-V graph indicates constant pressure.
- Conclusion: Graph B is isobaric.
- For a constant pressure process, the relationship between temperature and volume can be derived from the ideal gas law (PV = nRT). If pressure is constant, volume is directly proportional to temperature (V ∝ T).
- In a T-V graph, this relationship would appear as a straight line. If the graph is curved or not linear, it does not represent an isobaric process.
- Conclusion: Graph C is not isobaric.
- Similar to Graph A, if the pressure remains constant across different temperatures in a P-T graph, it indicates an isobaric process.
- If the graph shows a horizontal line at a certain pressure level, it confirms that pressure is constant for varying temperatures.
- Conclusion: Graph D is isobaric.
- Isobaric Process: Graphs B and D.
- Not Isobaric Process: Graphs A and C.
Topper's Solved these Questions
- BOOK - VMC MODULES ENGLISHCHAPTER - GASEOUS STATE & THERMODYNAMICSEXERCISE - JEE MAIN (ARCHIVE )81videos
GASEOUS STATE & THERMODYNAMICS
- BOOK - VMC MODULES ENGLISHCHAPTER - GASEOUS STATE & THERMODYNAMICSEXERCISE - JEE ADVANCED (ARCHIVE )111videos
GASEOUS STATE & THERMODYNAMICS
- BOOK - VMC MODULES ENGLISHCHAPTER - GASEOUS STATE & THERMODYNAMICSEXERCISE - Level - 175videos
GASEOUS STATE & THERMODYNAMICS
- BOOK - VMC MODULES ENGLISHCHAPTER - ENERGY & MOMENTUMEXERCISE - JEE ADVANCE (ARCHIVE) - TRUE/FALSE TYPE1videos
ENERGY & MOMENTUM
- BOOK - VMC MODULES ENGLISHCHAPTER - GRAVITATIONEXERCISE - JEE Advance (Archive) TRUE/FALSE1videos
GRAVITATION
Similar Questions
Match the following columns.
 View Solution
Match the following columns.
 View Solution
Match the following columns.
 View Solution
Match the following columns.
 View Solution
Match the following columns .
 View Solution
Match the following columns.
 View Solution
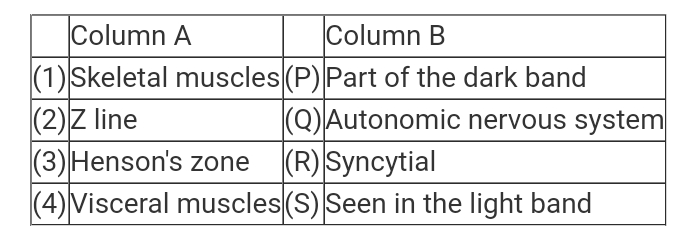
Match the following columns.
 View Solution
Match the following columns.
 View Solution
Match the following columns.
 View Solution
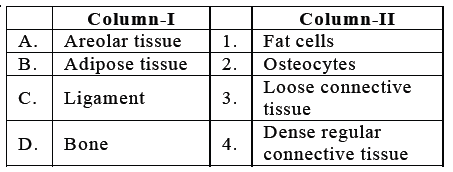
Match the following columns.
 View Solution

