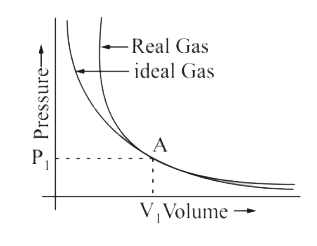
Pressure versus volume graph for real gas and are shown in figure. Answer the following question on the basis of this graph.

(i) Interpret the behaviour of real gas with respect to ideal gas at low pressure.
(ii) Interpret the behaviour of real gas with respect to ideal gas at high pressure.
(iii) Mark the pressure and volume by drawing a line at the point where real gas behaves as an ideal gas.
Video Solution
Text Solution
At high pressure, the real gas show large deviations from ideal behaviour as the curves are far apart.
|
Updated on:21/07/2023
Topper's Solved these Questions
- BOOK - VMC MODULES ENGLISHCHAPTER - STATES OF MATTEREXERCISE - Level-175videos
STATES OF MATTER
- BOOK - VMC MODULES ENGLISHCHAPTER - STATES OF MATTEREXERCISE - Level-250videos
STATES OF MATTER
- BOOK - VMC MODULES ENGLISHCHAPTER - STATES OF MATTEREXERCISE - LEVEL -0 ( Short Answer Type)8videos
STATES OF MATTER
- BOOK - VMC MODULES ENGLISHCHAPTER - STATES OF MATTEREXERCISE - IMPECCABLE50videos
STATES OF MATTER
- BOOK - VMC MODULES ENGLISHCHAPTER - STOICHIOMETRY - IEXERCISE - JEE Advanced (Archive)31videos
STOICHIOMETRY - I
Similar Questions
Knowledge Check
- Question 1 - Select One
Which of the following graphs represent the behaviour of an ideal gas ?
A1.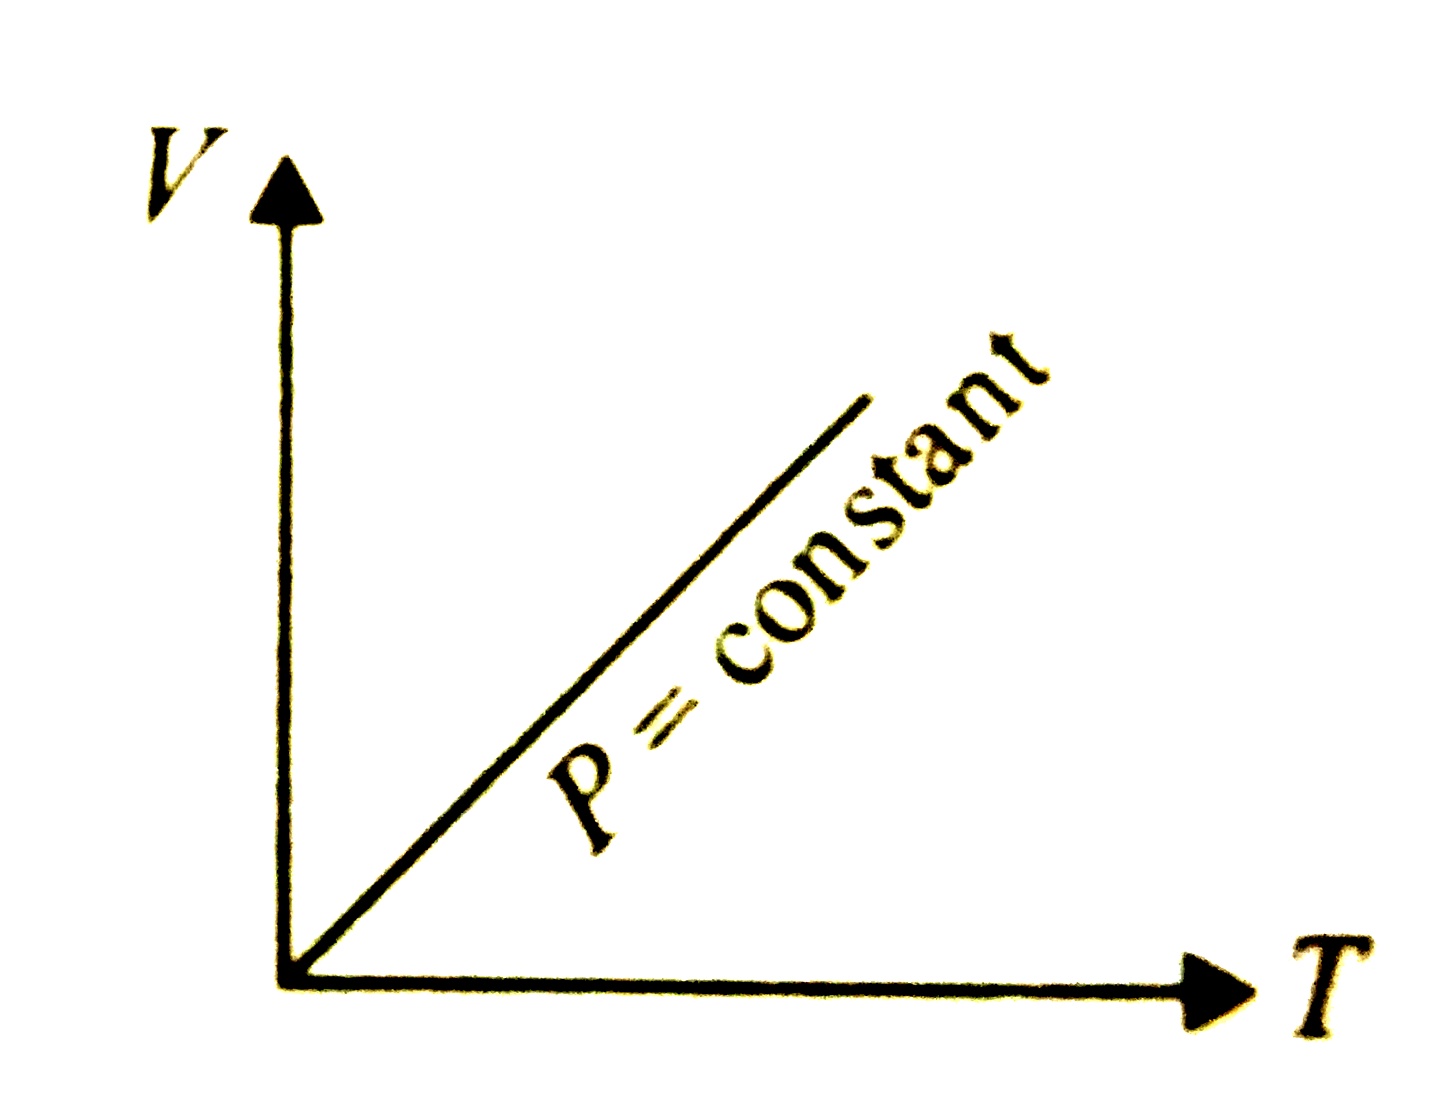 B2.
B2.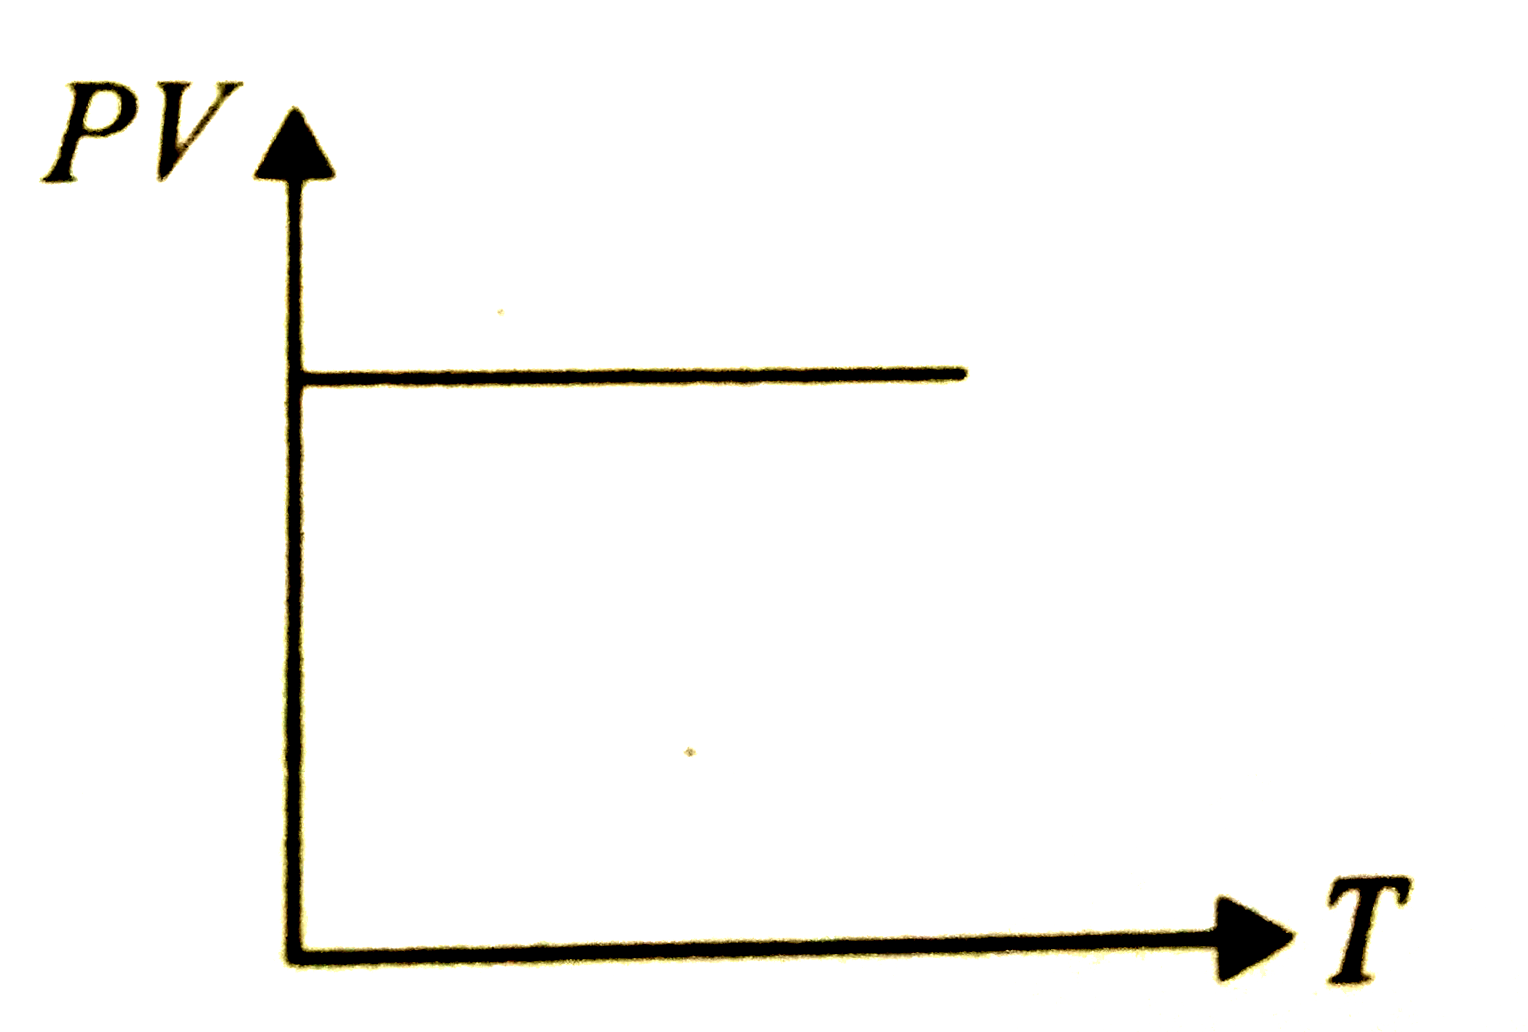 C3.
C3.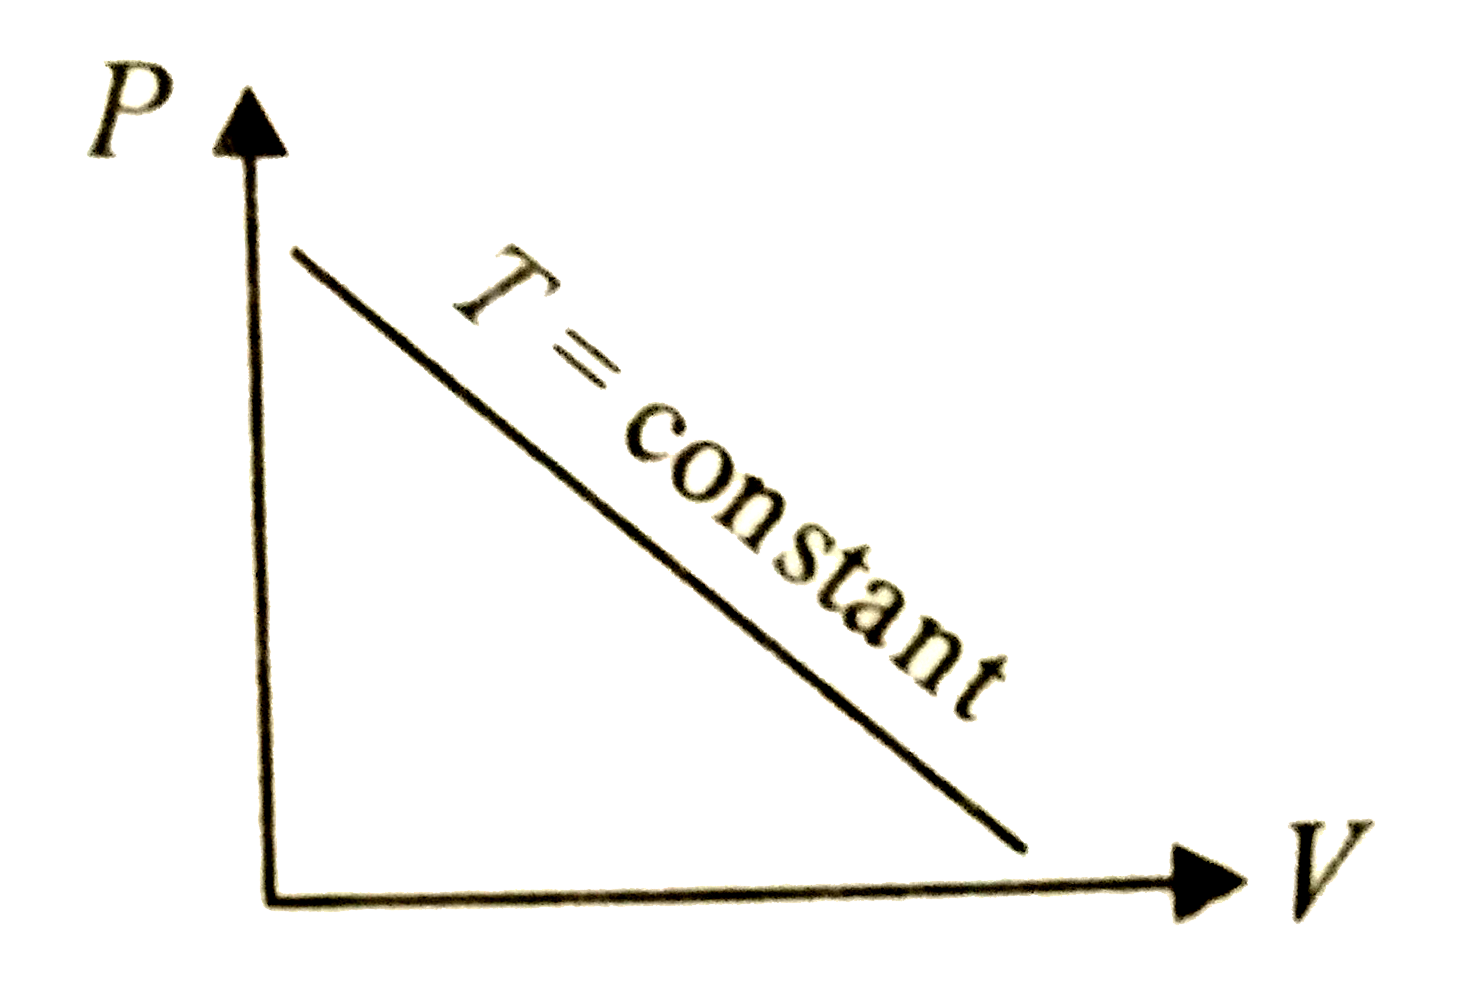 D4.
D4.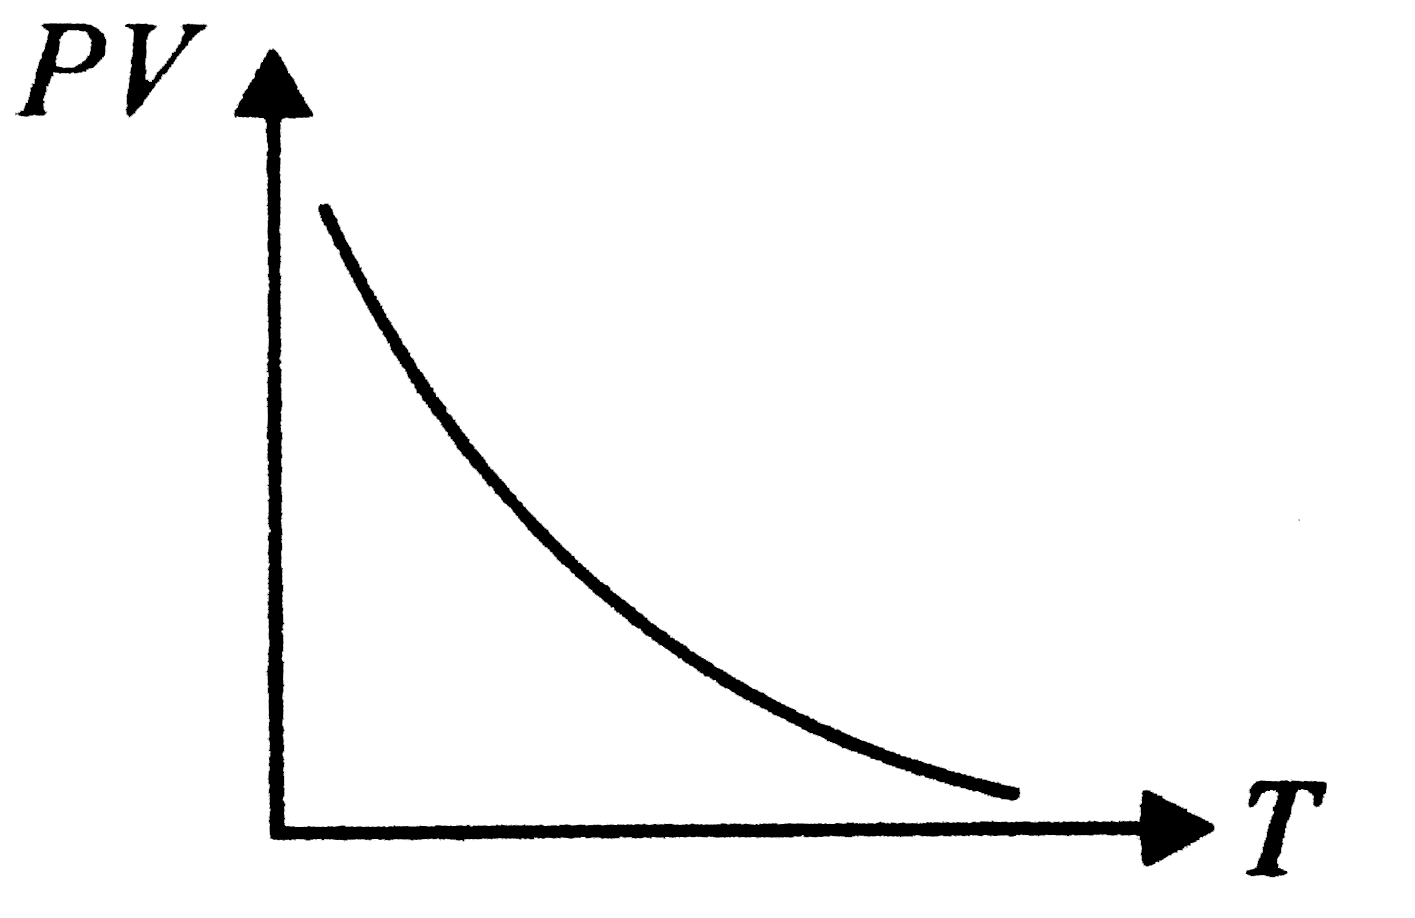
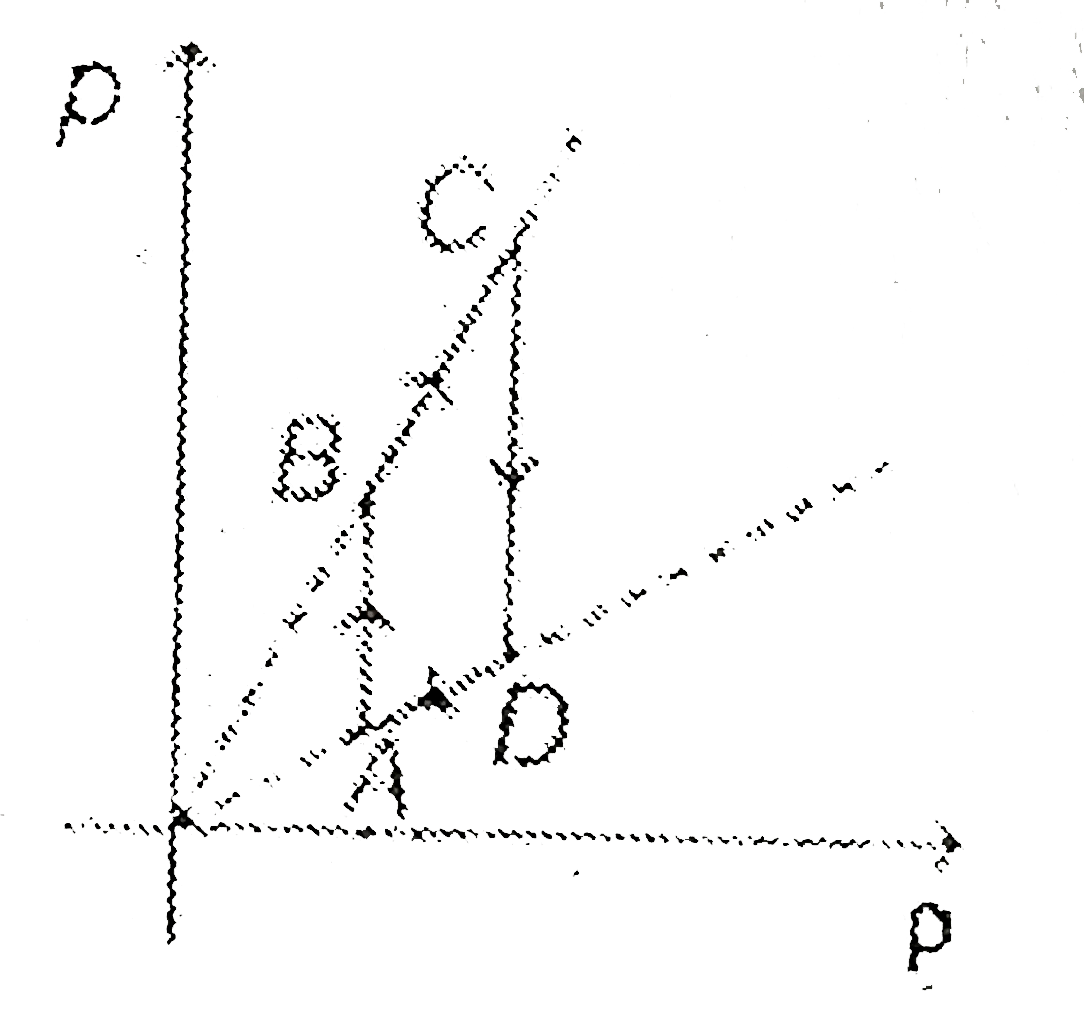
Pressure versus temperature graphs of an ideal gas are as shown in figure. Choose the wrong statement
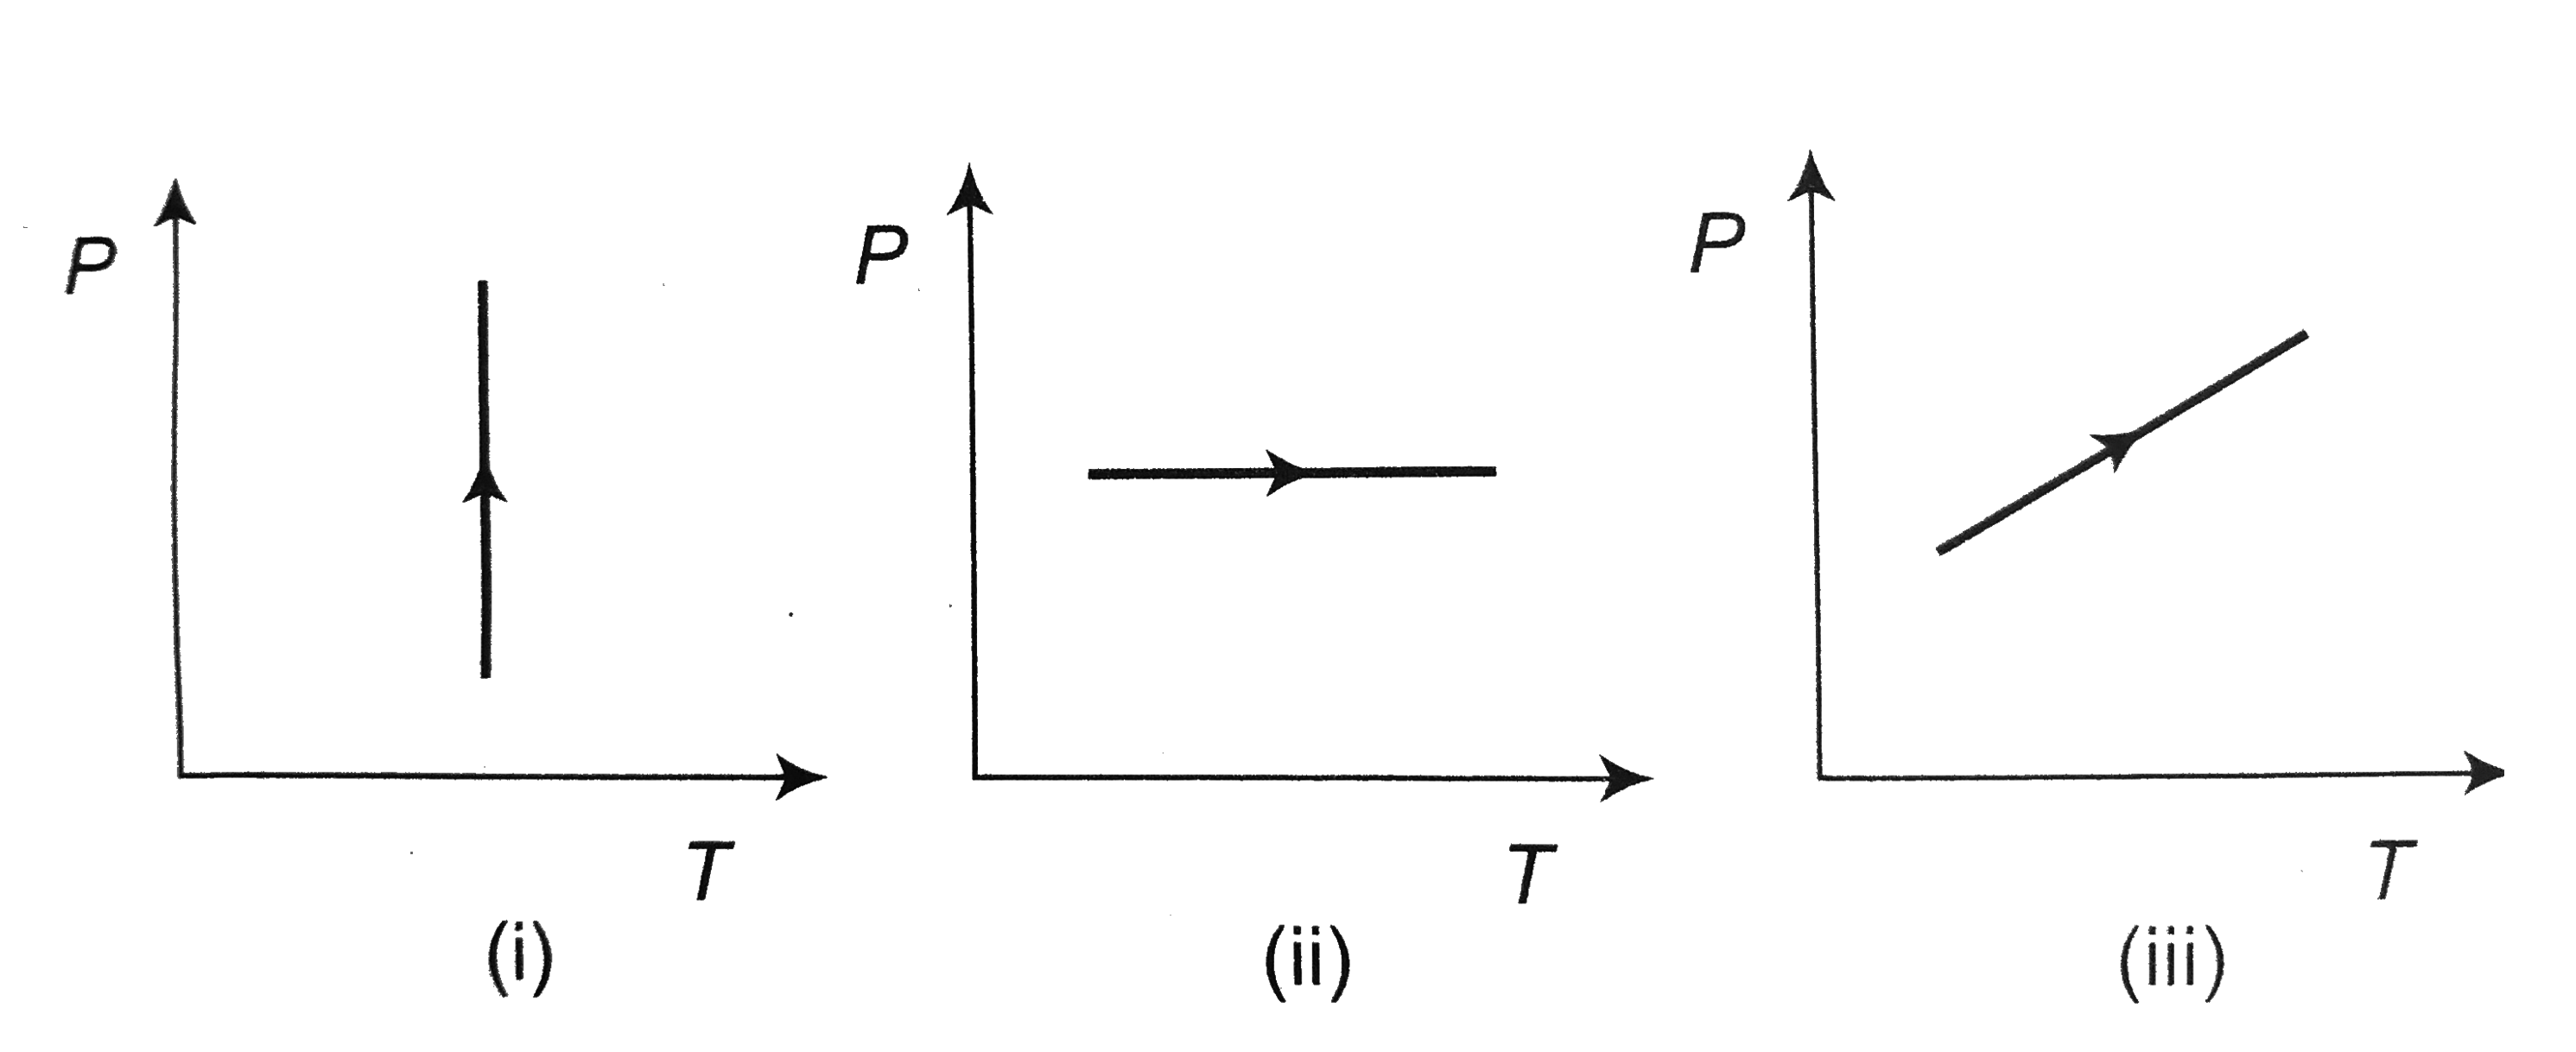 View Solution
The observed pressure of real gas is more than the ideal pressure.
View SolutionThe compressibility factor for a real gas at high pressure is .
View SolutionThe compressibility factor for a real gas at high pressure is .
View SolutionThe compressibility factor for a real gas at high pressure is .
View SolutionPressure versus temperature graph of an ideal gas as shown in Fig.
Corresponding density (ρ) versus volume (V) graph will be
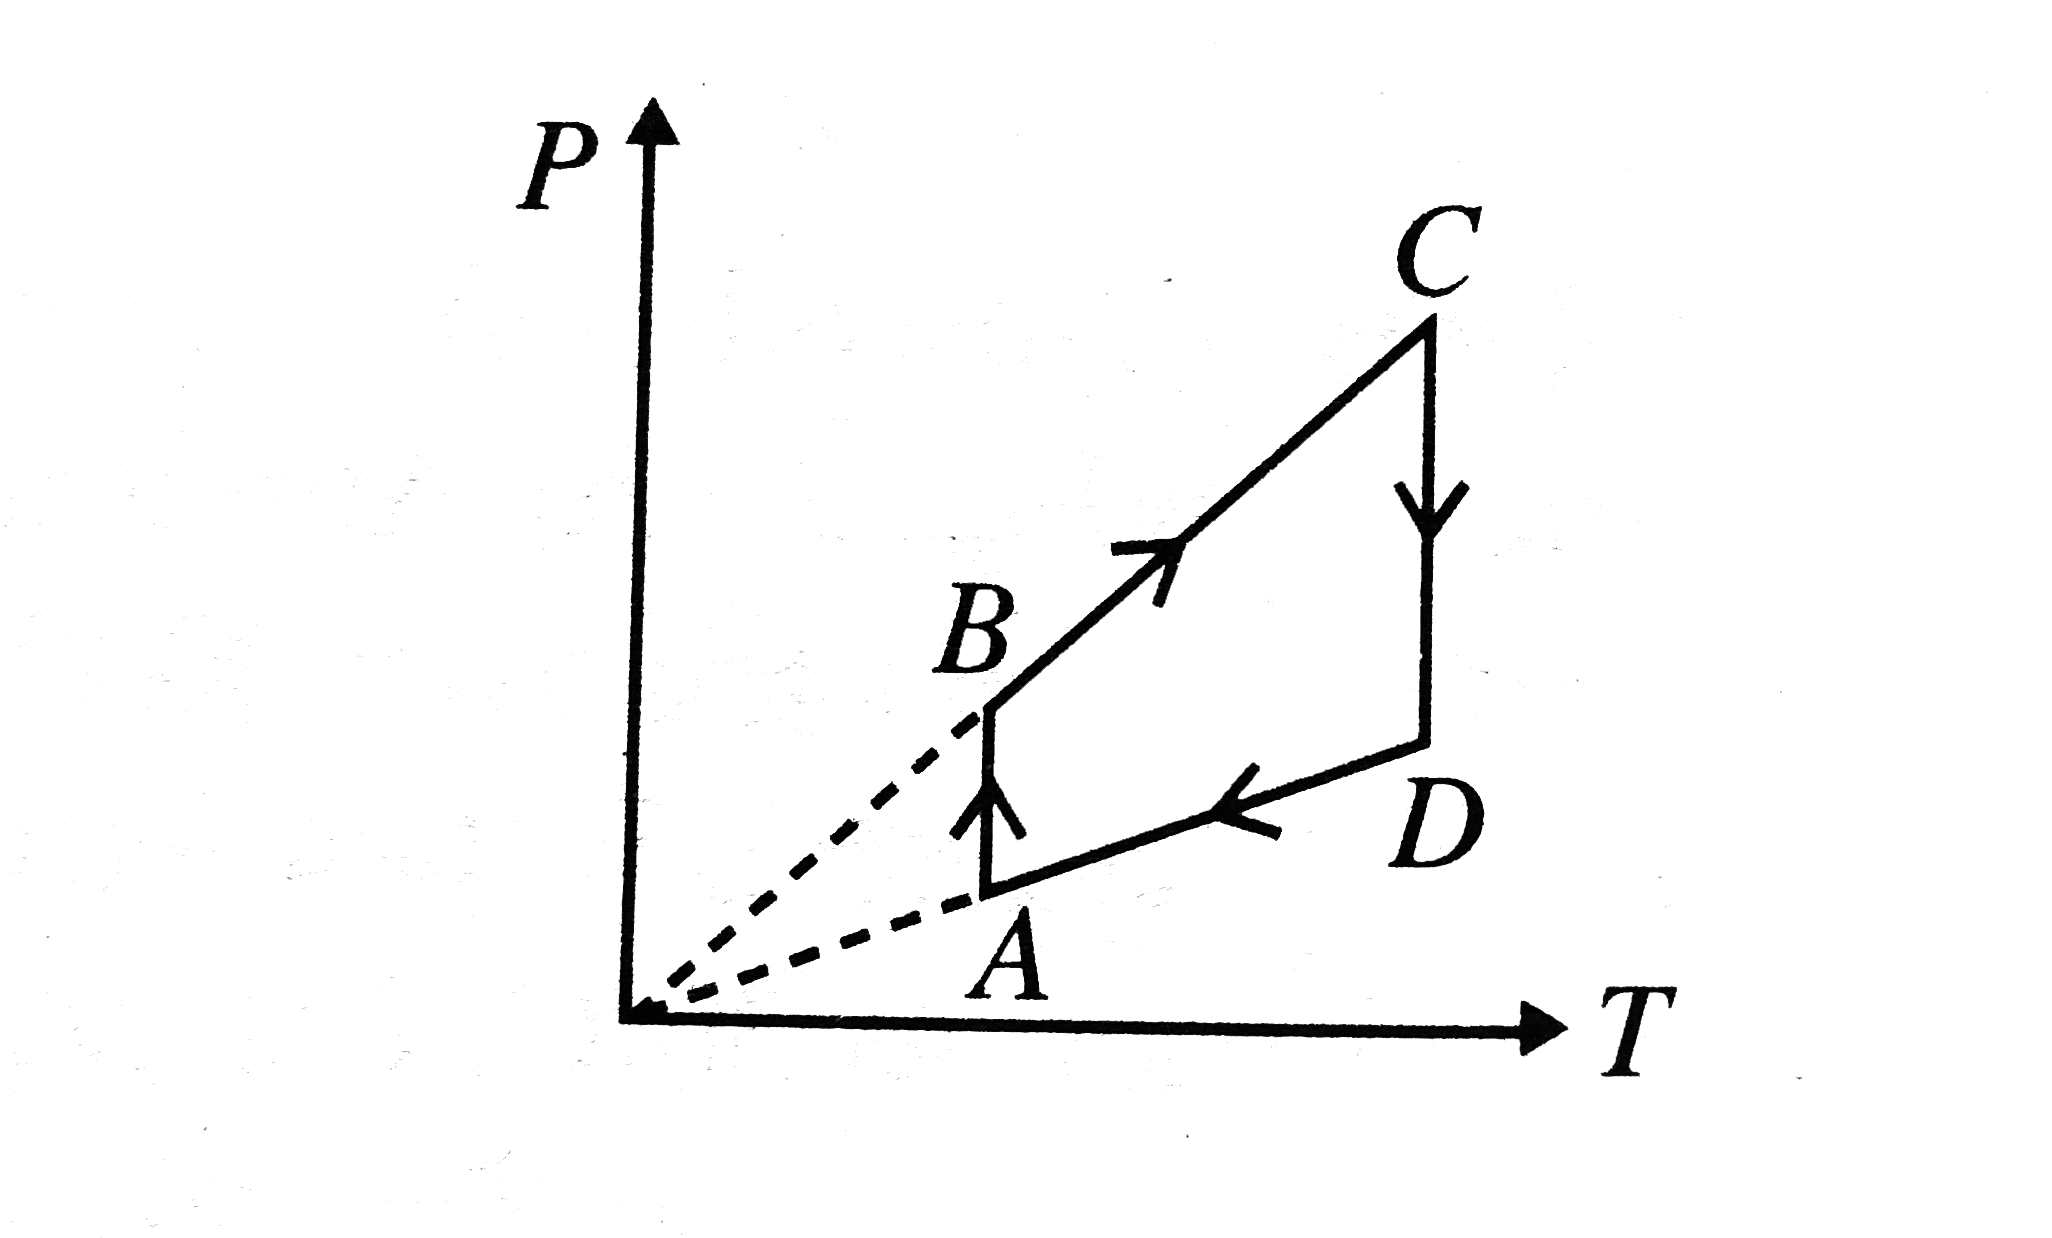 View Solution
Pressure versus temperature graph of an ideal gas as shown in Fig.
Corresponding density (ρ) versus volume (V) graph will be
 View Solution


