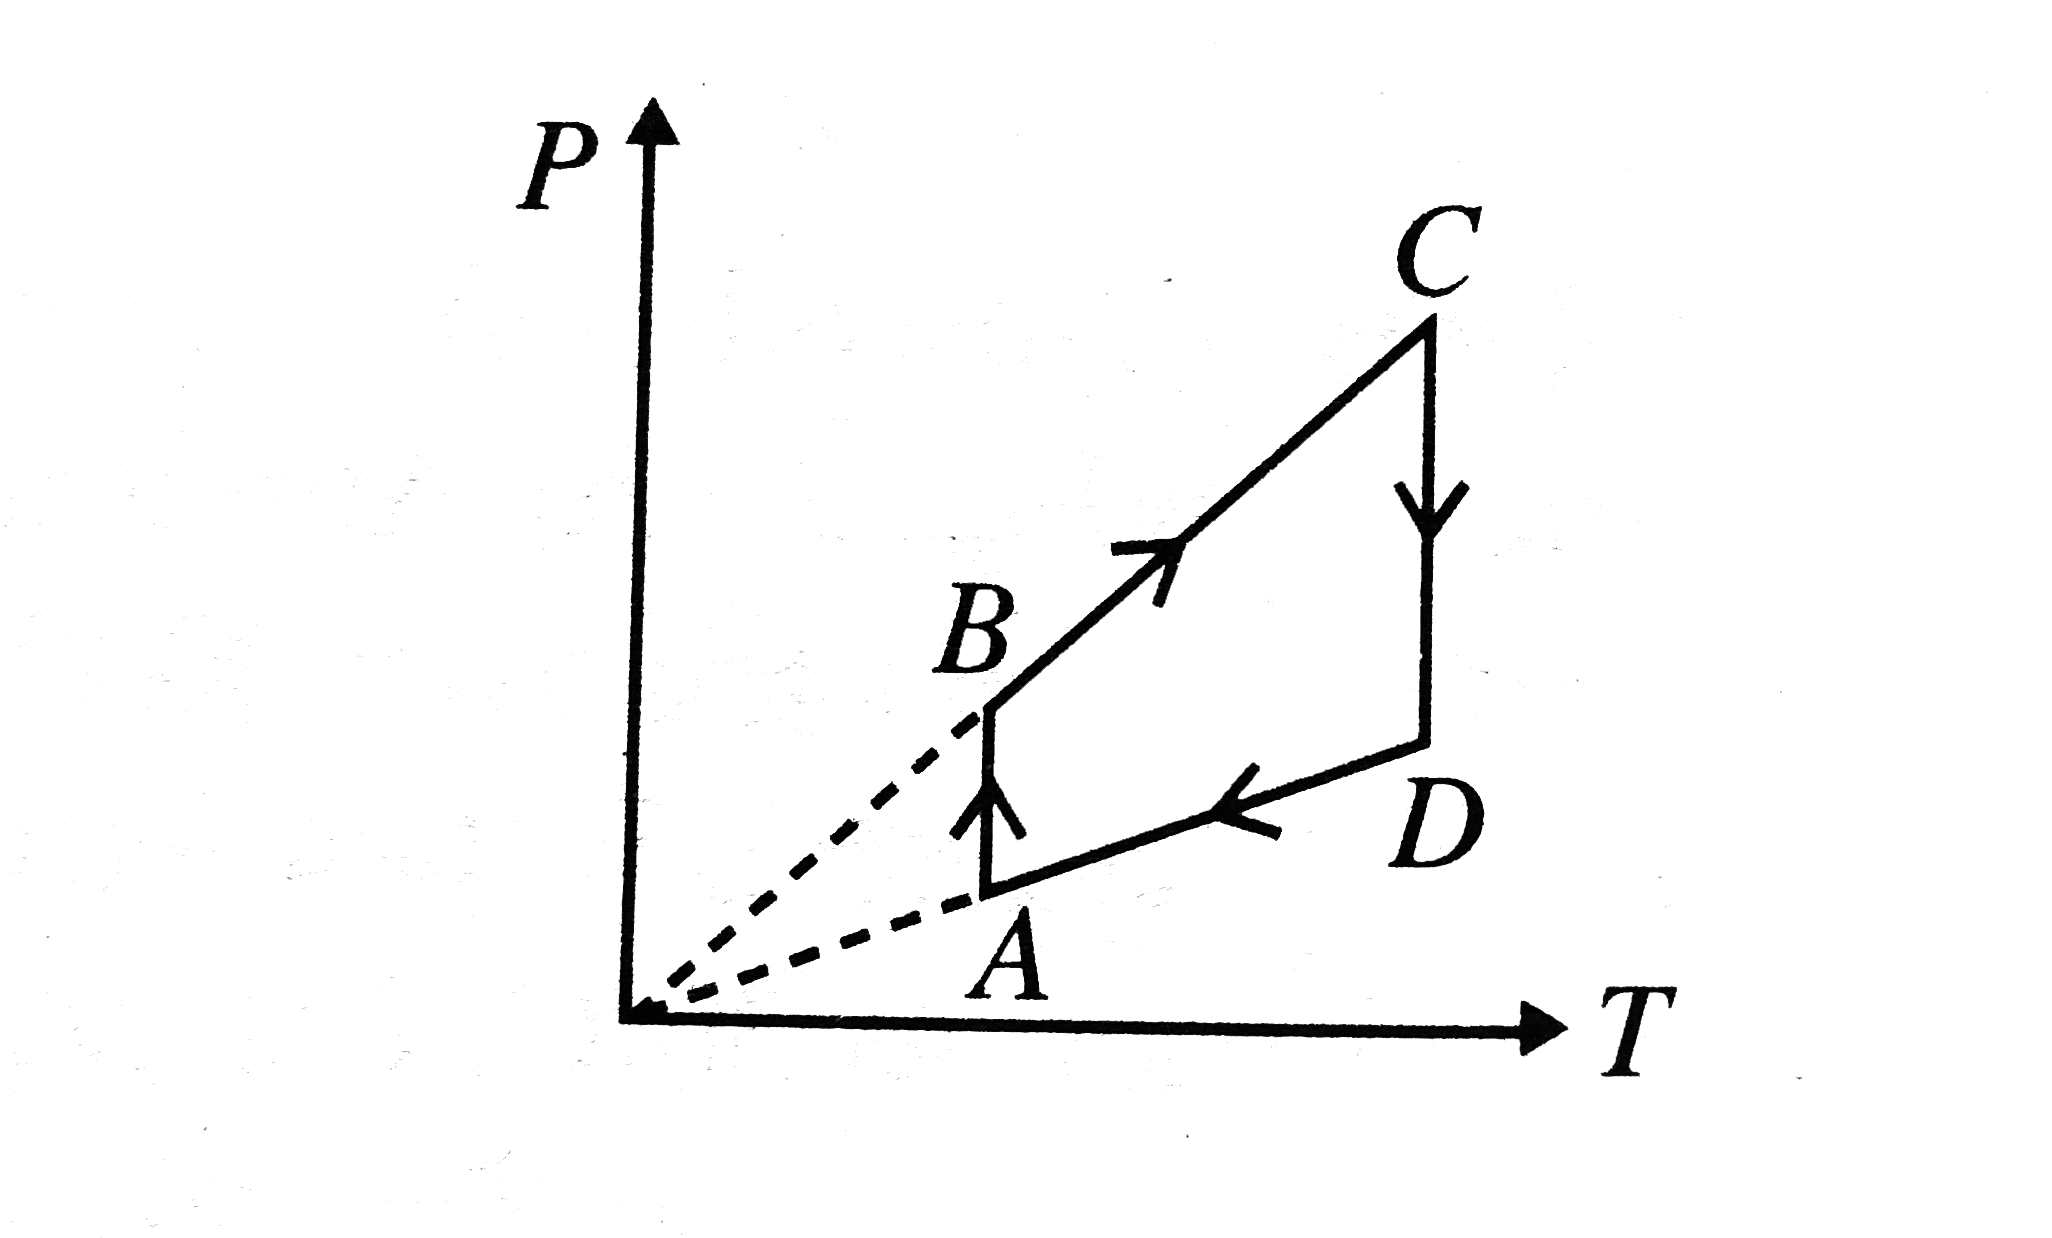
Pressure versus temperature graphs of an ideal gas are as shown in figure. Choose the wrong statement
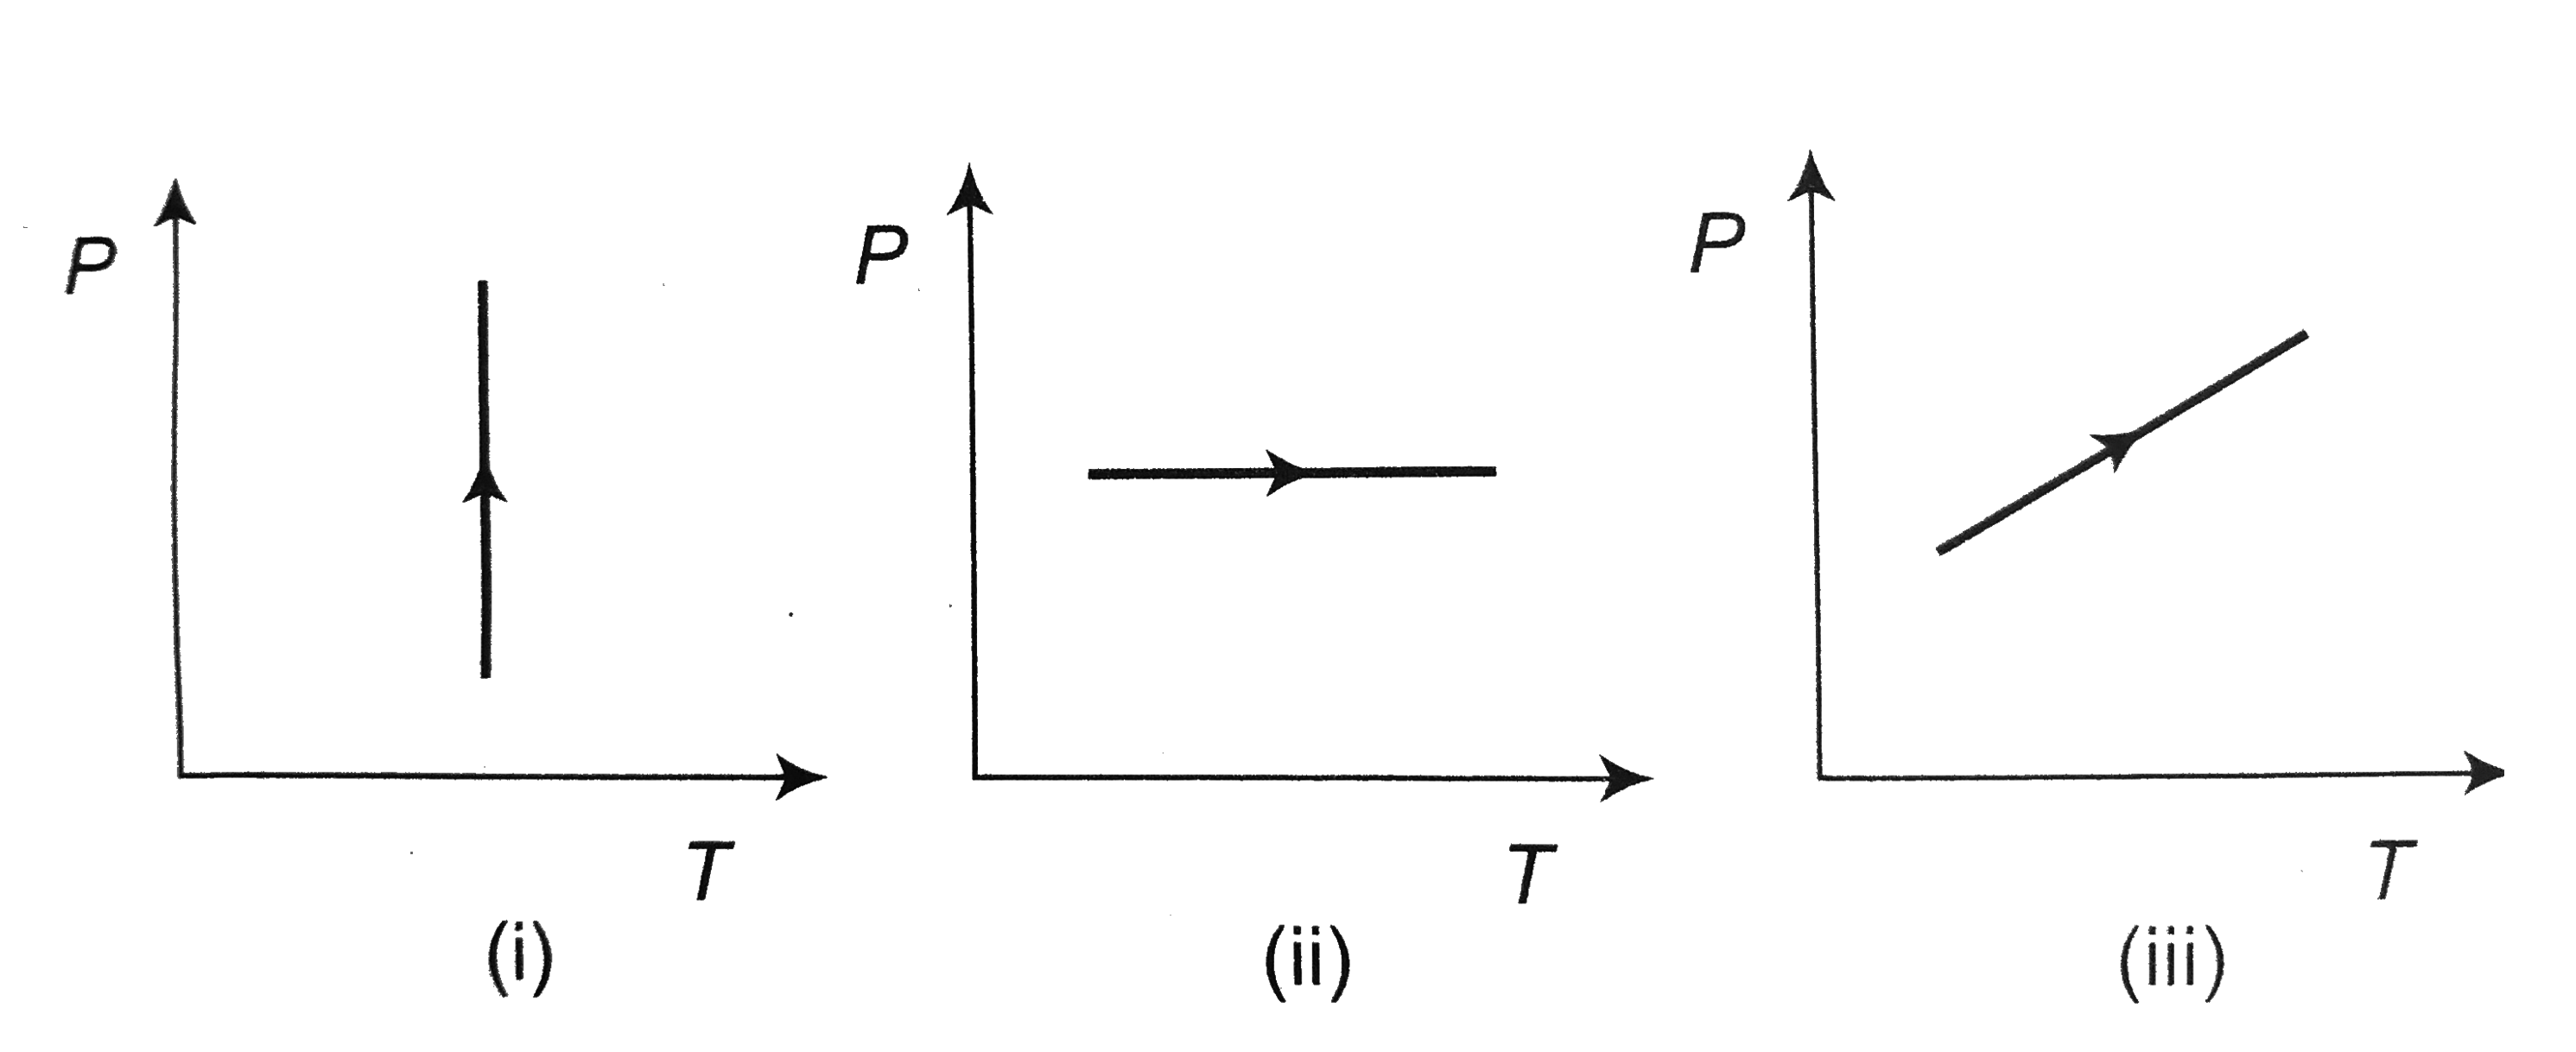
density of gas increasing in graph (i)
density of gas is decreasing in graph (ii)
density of gas is constant in graph (iii)
none of these
The correct Answer is:D
Step by step video & image solution for Pressure versus temperature graphs of an ideal gas are as shown in figure. Choose the wrong statement by Physics experts to help you in doubts & scoring excellent marks in Class 12 exams.
Updated on:21/07/2023Similar Questions
Knowledge Check
Volume versus temperature graphs for a given mass of an ideal gas are shown in figure. At two different values of constant pressure. What can be inferred about relation between P1 and P2 ?
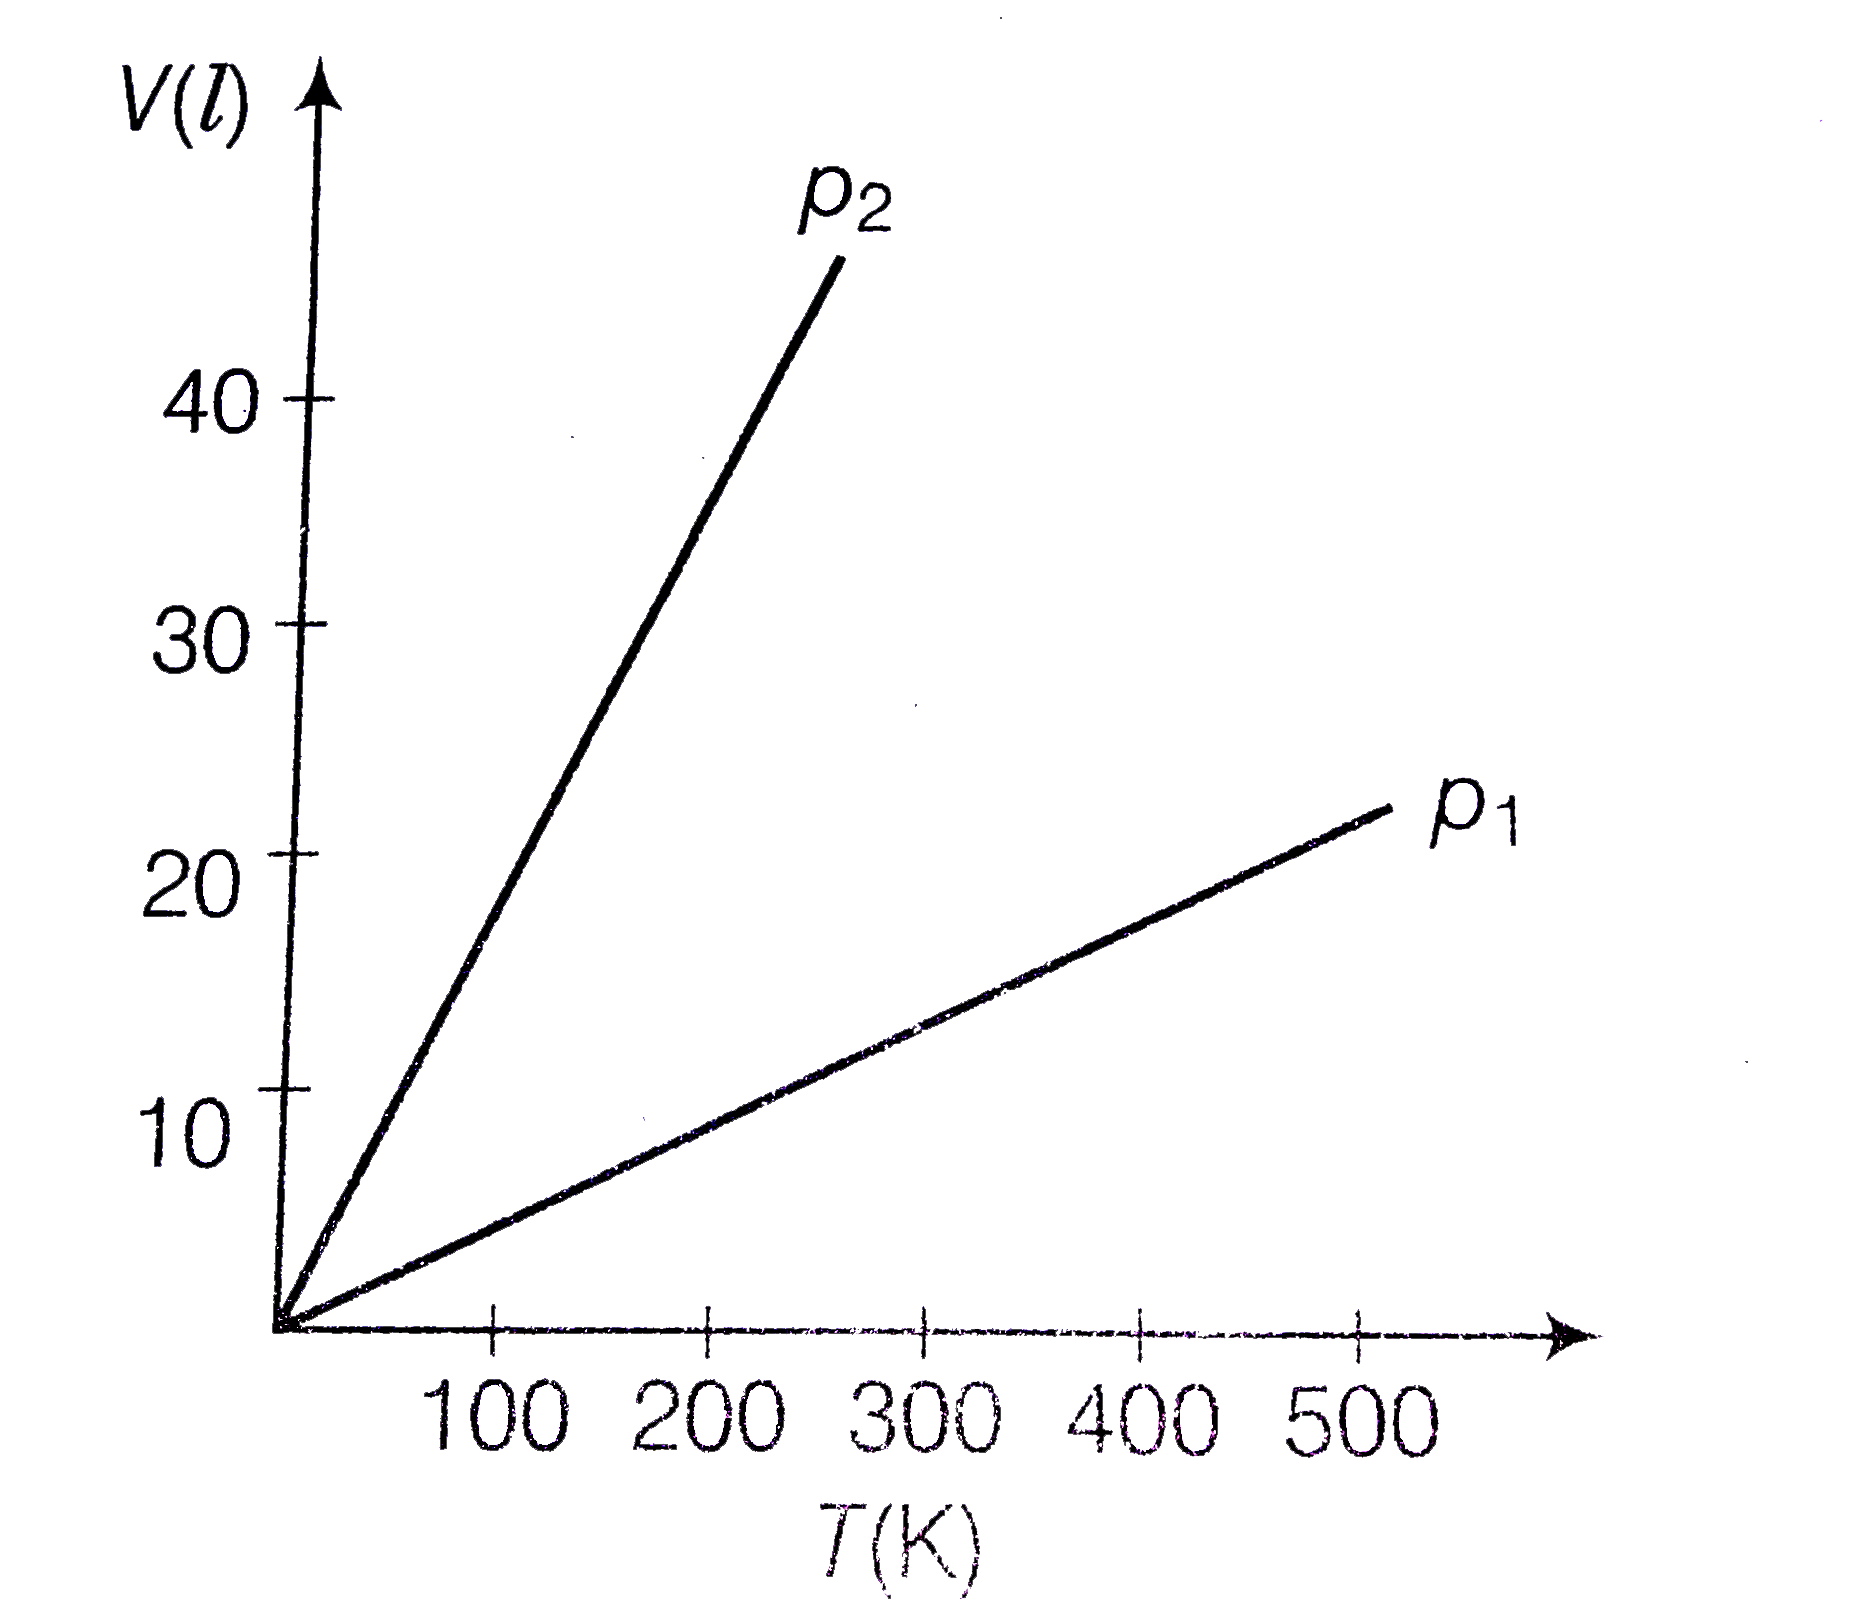 AP1>P2BP1=P2CP1<P2Ddata is insufficient
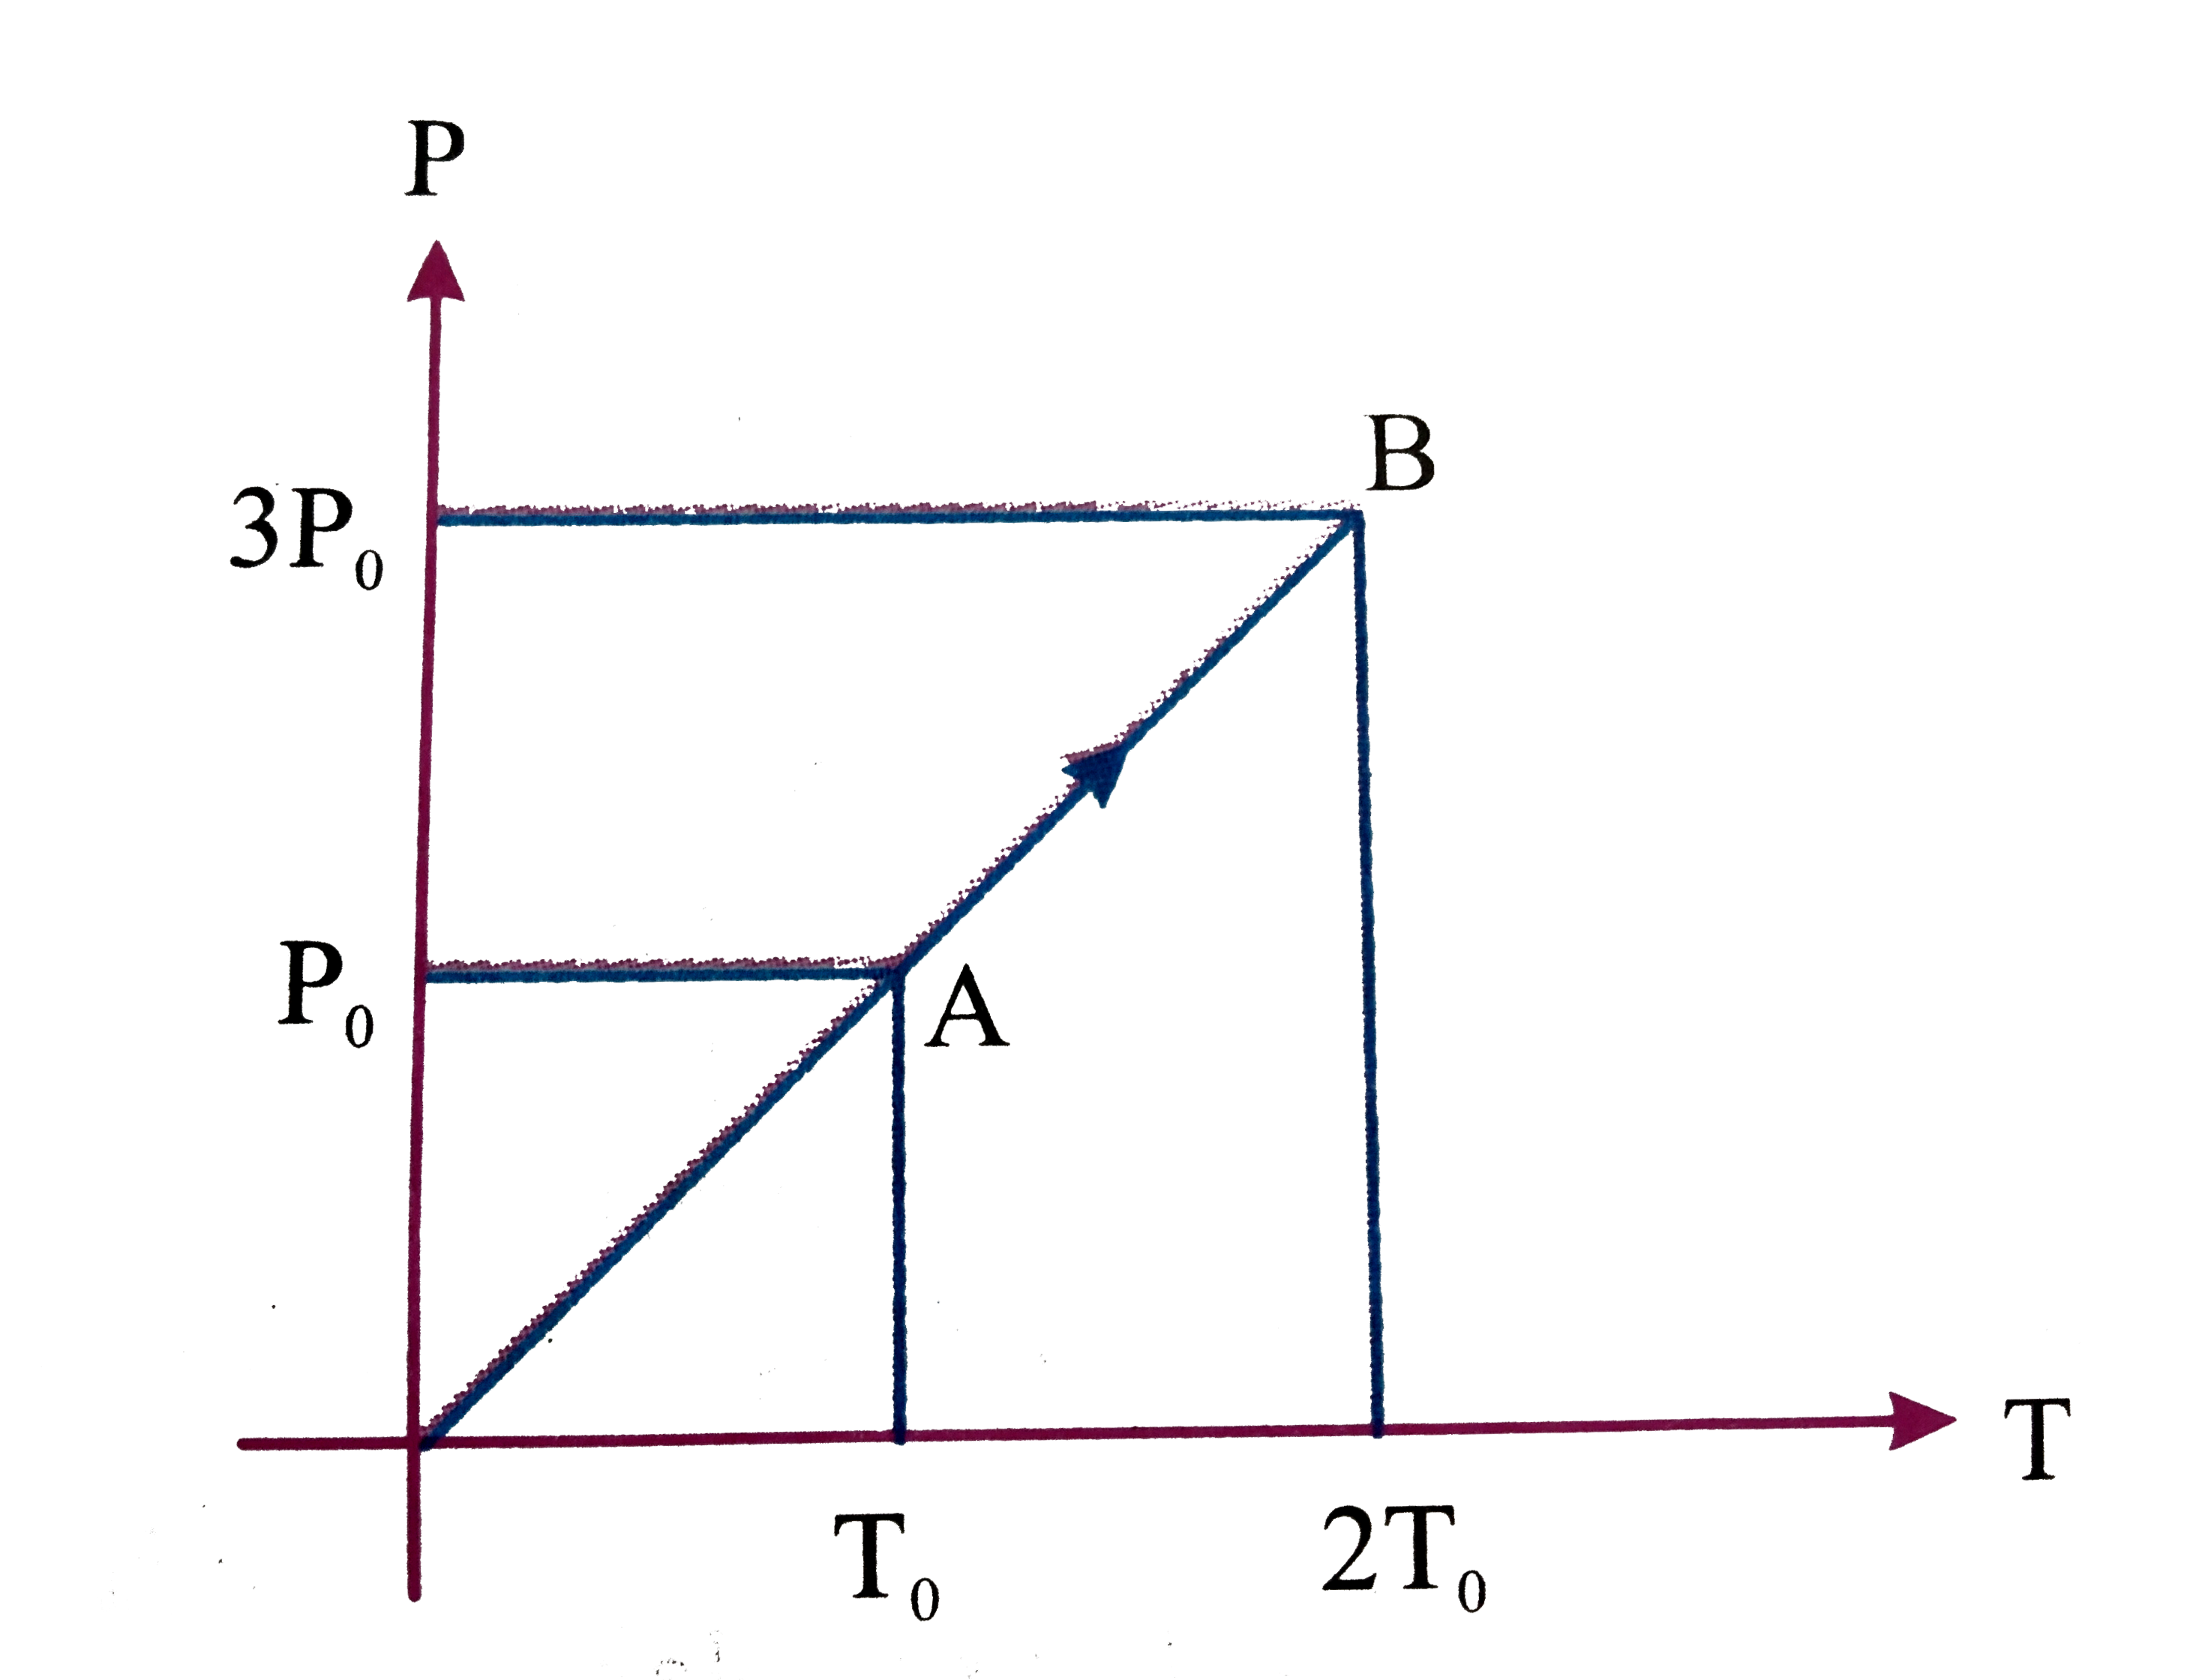
Pressure versus temperature graph of an ideal gas as shown in Fig.
Corresponding density (ρ) versus volume (V) graph will be
View SolutionPressure versus temperature graph of an ideal gas as shown in Fig.
Corresponding density (ρ) versus volume (V) graph will be

View SolutionVolume versus temperature graphs for a given mass of an ideal gas are shown in figure. At two different values of constant pressure. What can be inferred about relation between P1 and P2 ?

View SolutionVolume versus temperature graphs for a given mass of an ideal gas are shown in figure. At two different values of constant pressure. What can be inferred about relation between P1 and P2 ?

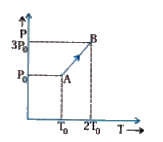
View SolutionIn figure shown,Pressure versus temperature graph of an ideal gas is as . Density of the gas at point A is ρ0 . Density at point B will be ____
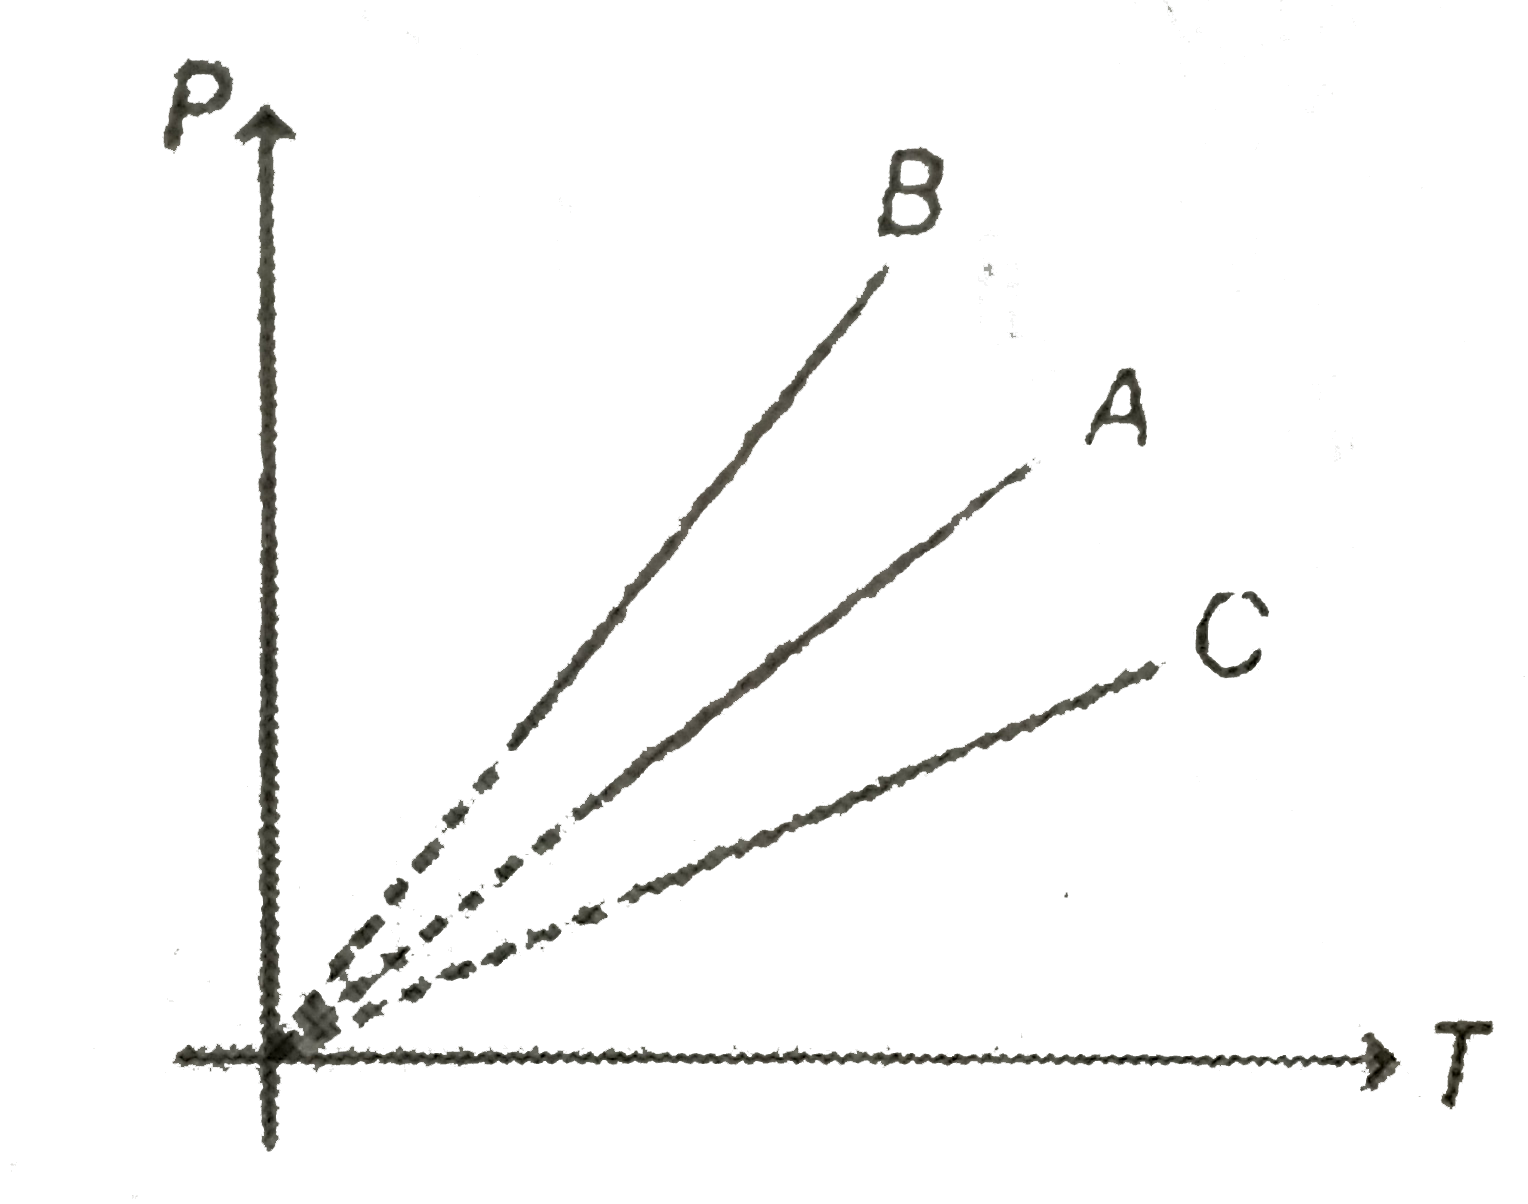
View SolutionPressure versus temperature graph of an ideal gas at constant volume V is shown by the straight line A. Now mass of the gas is doubled and the volume is halved, then the corresponding pressure versus temperature graph will be shown by the line
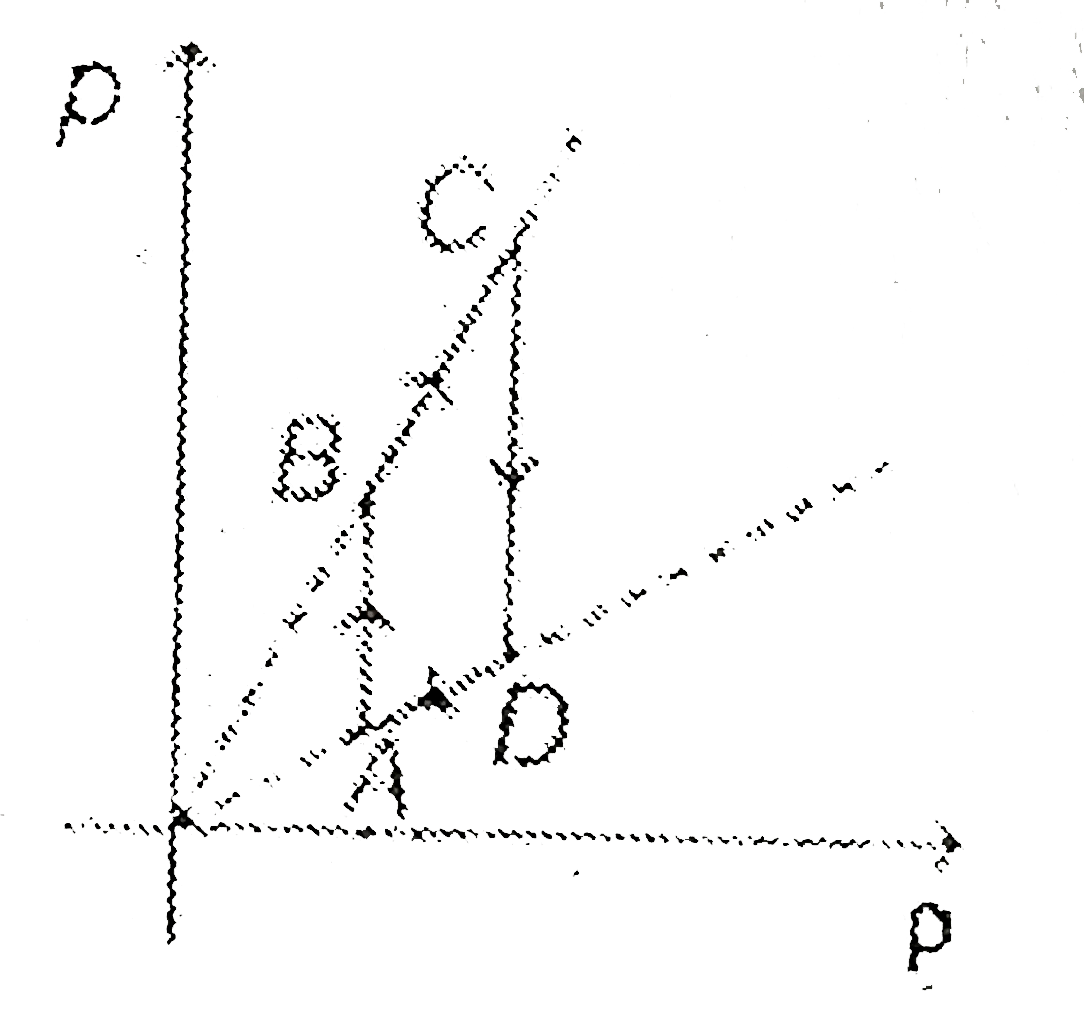
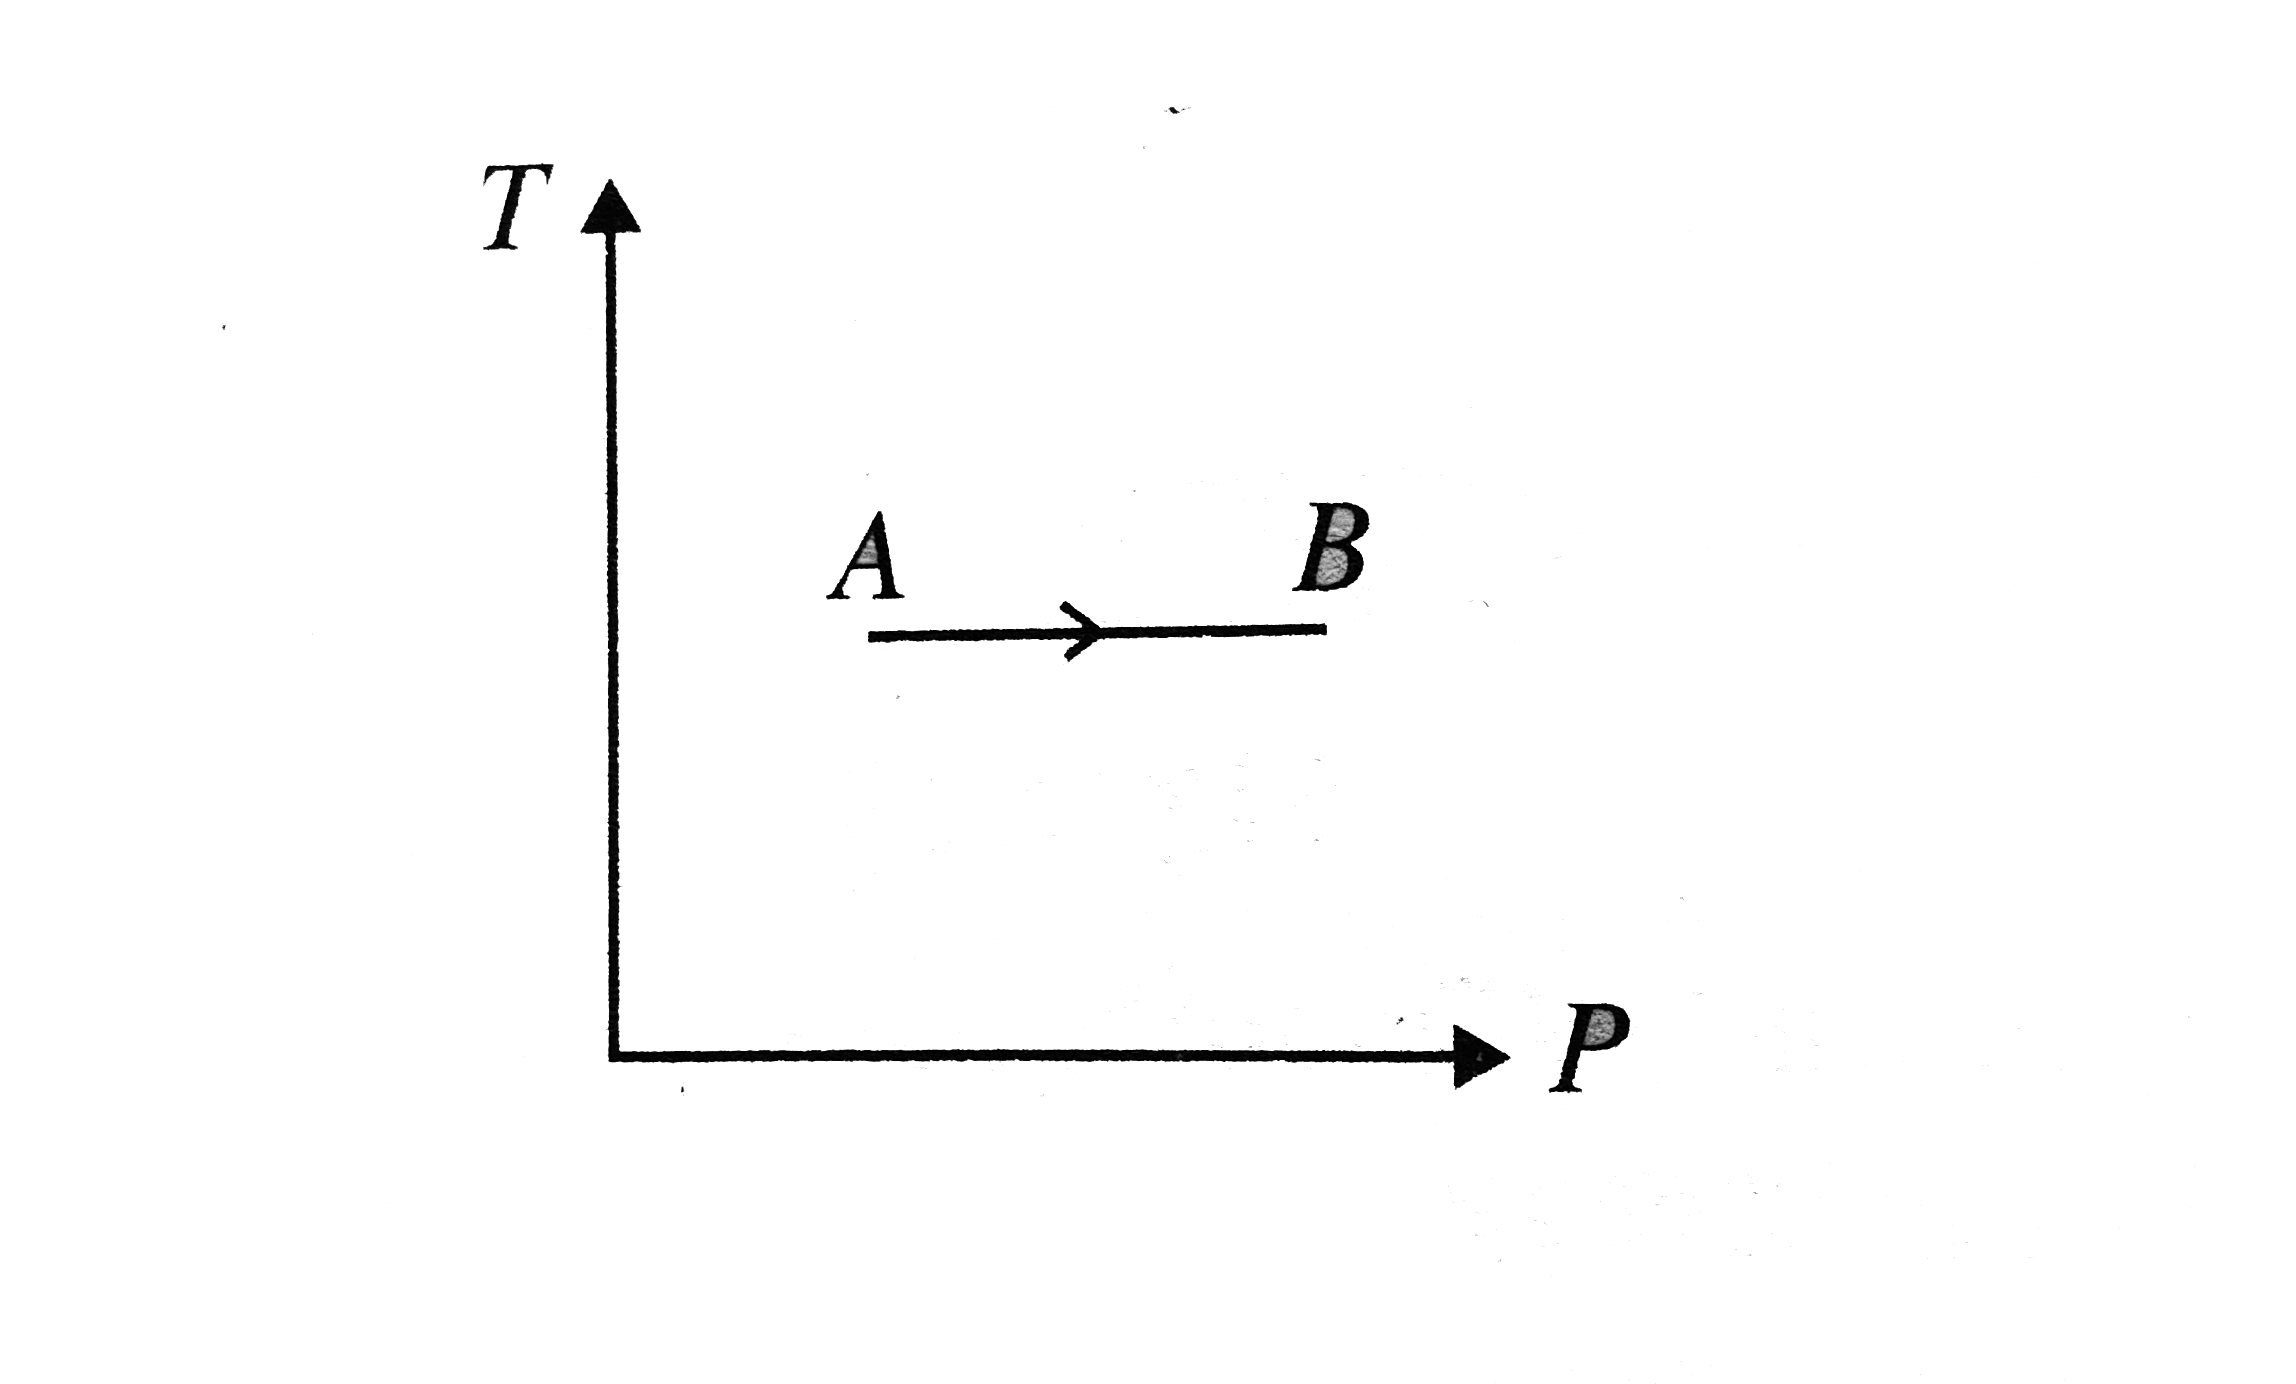
View SolutionTemperature versus pressure graph of an ideal gas is shown in Fig. During the process AB
View Solution
