What conclusion would you draw from the following graphs for an ideal gas?
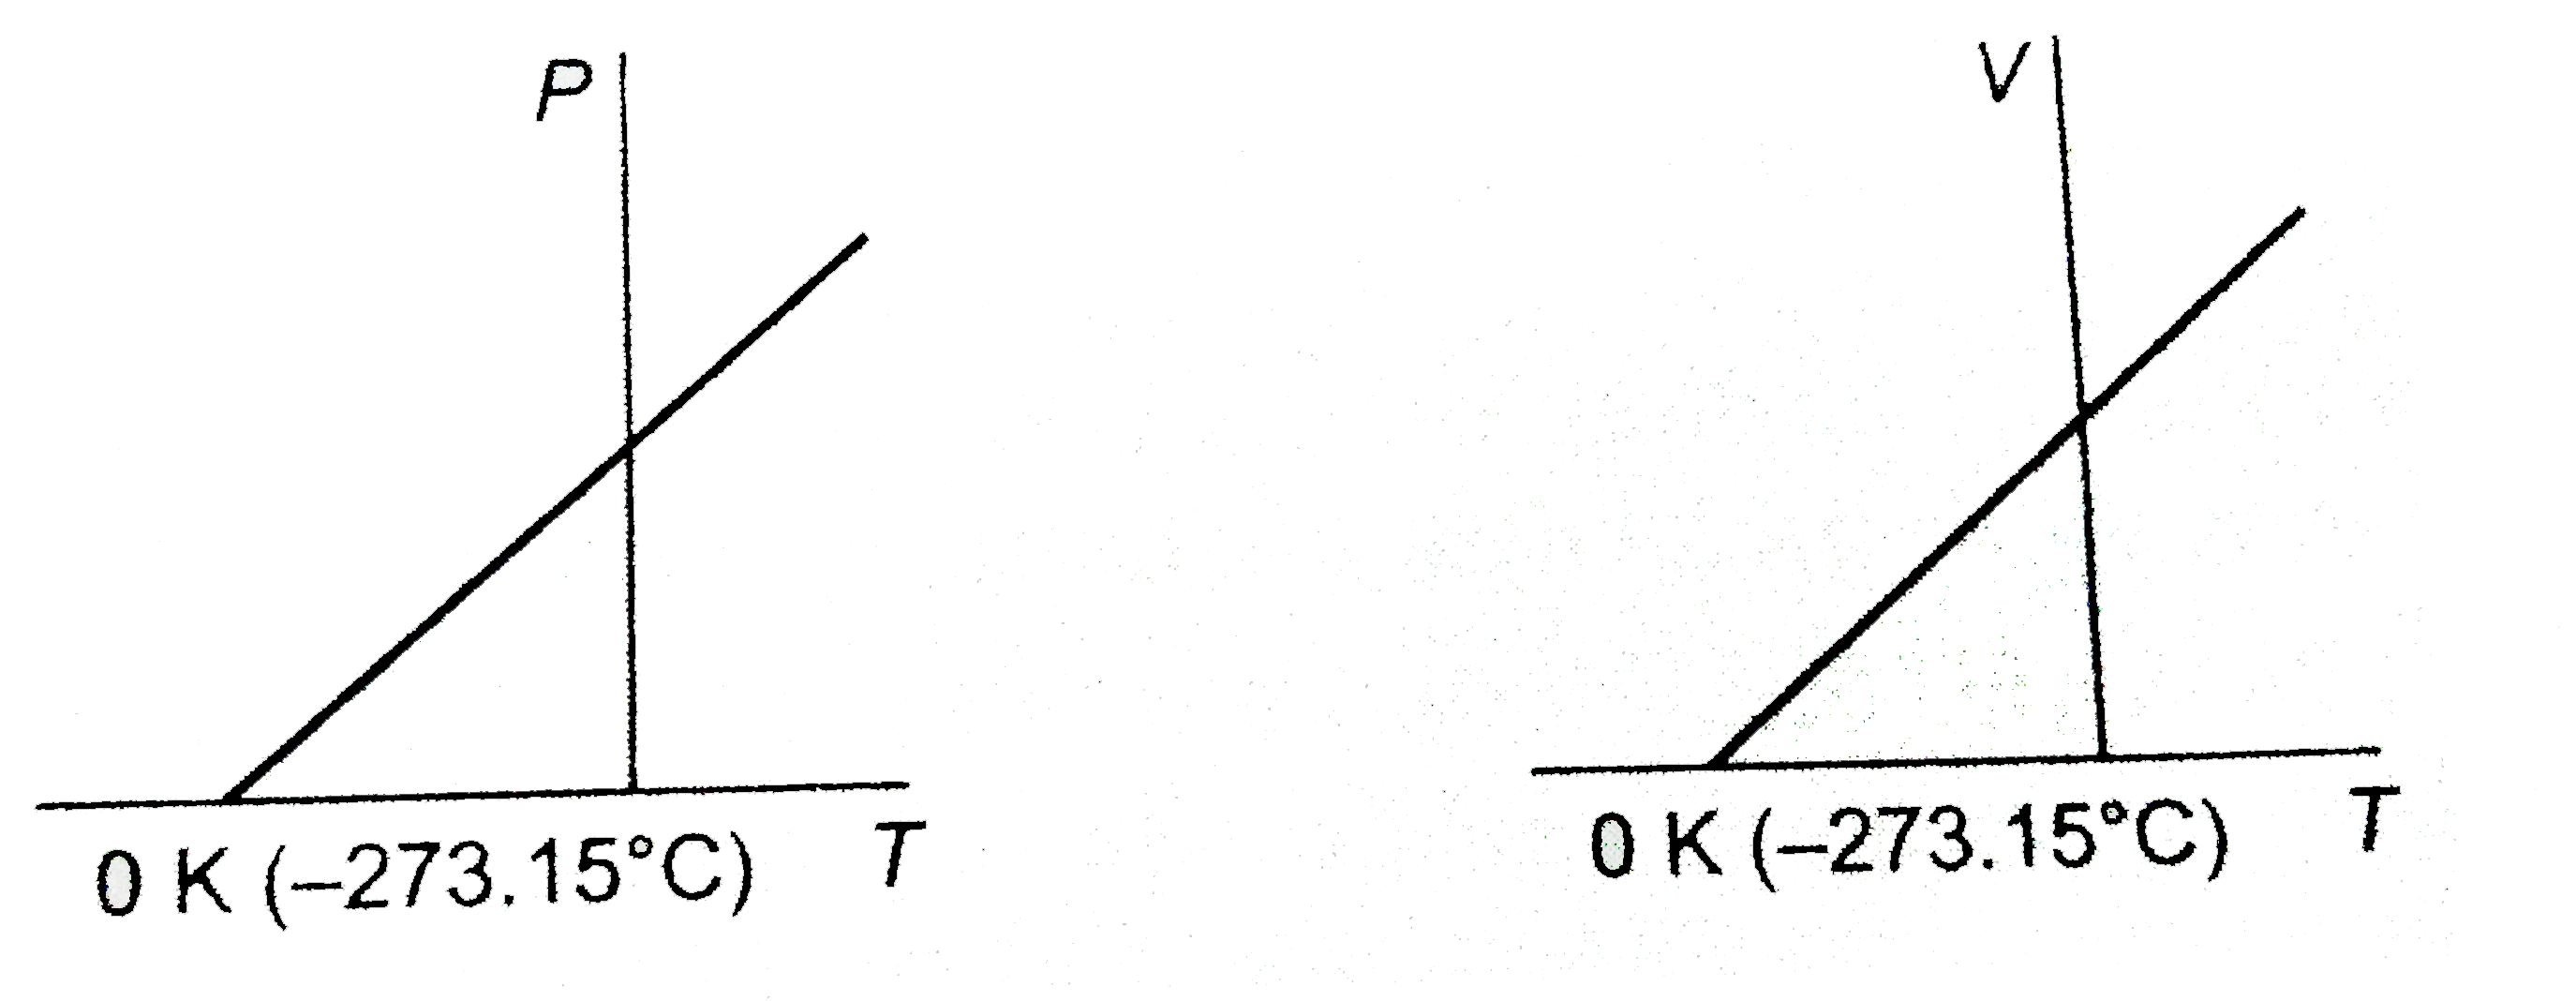
As the temperature is reduced, the volume as well as the pressure increases
As the temperature is reduced, the volume becomes zero and the pressure reaches infinity
As the temperature is reduced, the pressure decreases
A point is reached where, theoretically, the volume becomes zero
The correct Answer is:C, D
at constant volume at constant PP∝TV∝TP=KTV=KTP=K(t∘C+273.15)V=K(t∘C+273.15)
Topper's Solved these Questions
- STATES OF MATTERBOOK - VMC MODULES ENGLISHCHAPTER - STATES OF MATTEREXERCISE - Level-2
50 Videos
- STATES OF MATTERBOOK - VMC MODULES ENGLISHCHAPTER - STATES OF MATTEREXERCISE - Level-2 (NUMBERICAL VALUE TYPE FOR JEE MAIN
15 Videos
- STATES OF MATTERBOOK - VMC MODULES ENGLISHCHAPTER - STATES OF MATTEREXERCISE - LEVEL -0 (Short Answer Type-II)
27 Videos
- STATES OF MATTERBOOK - VMC MODULES ENGLISHCHAPTER - STATES OF MATTEREXERCISE - IMPECCABLE
50 Videos
- STOICHIOMETRY - IBOOK - VMC MODULES ENGLISHCHAPTER - STOICHIOMETRY - IEXERCISE - JEE Advanced (Archive)
31 Videos
Similar Questions
Knowledge Check
Which of the following graphs represent the behaviour of an ideal gas ?
A1.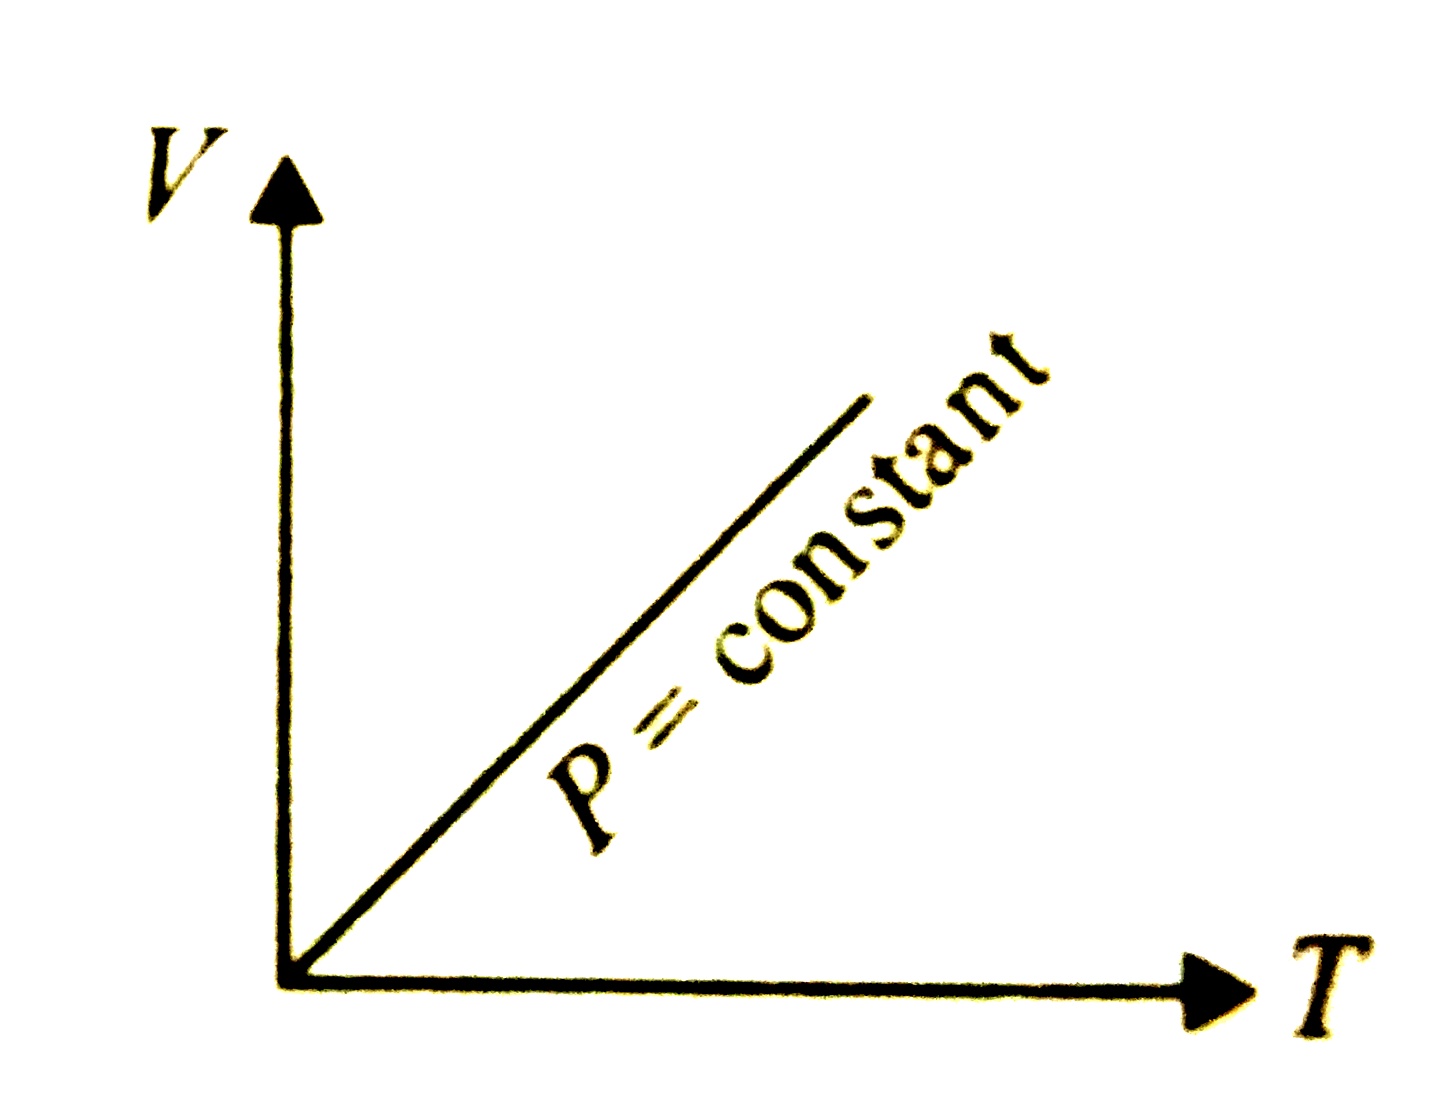 B2.
B2.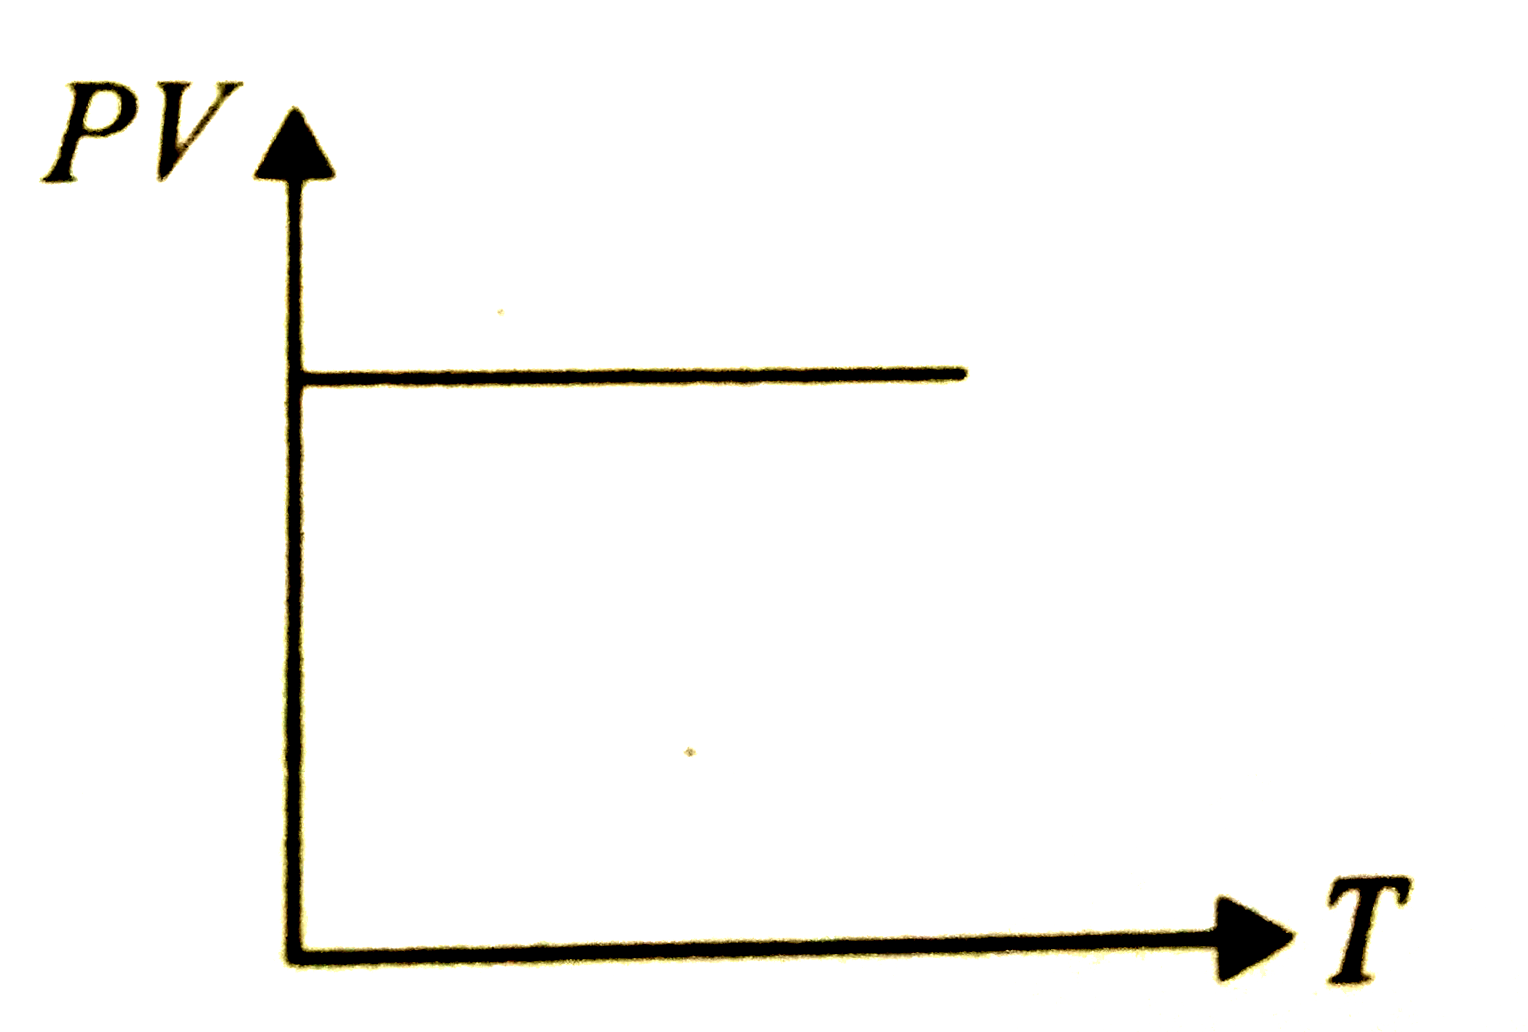 C3.
C3.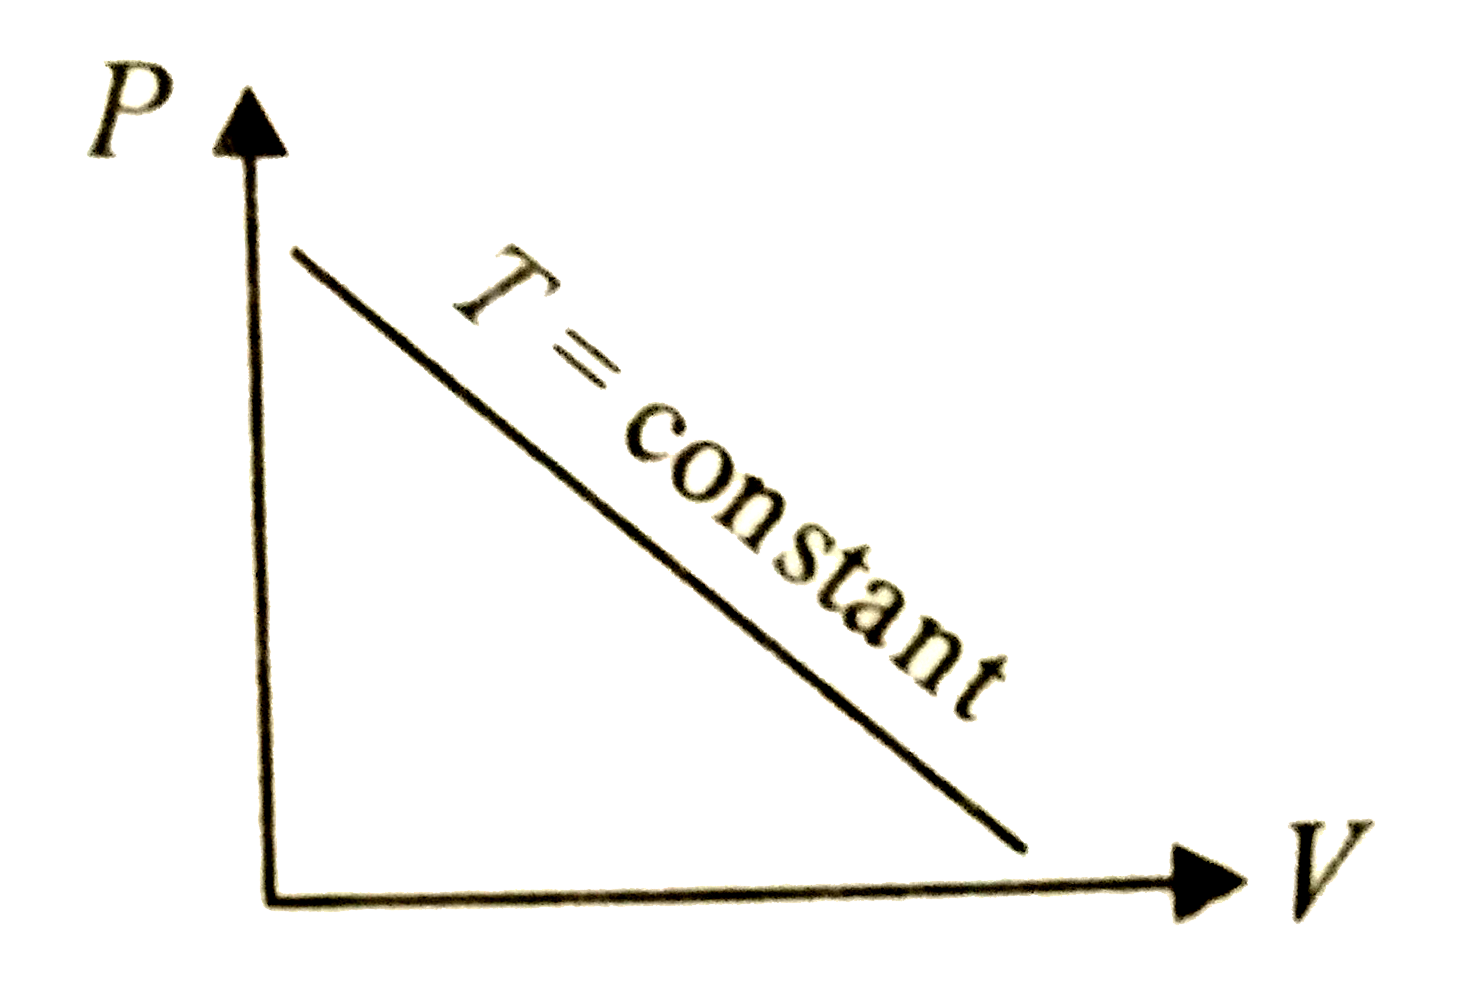 D4.
D4.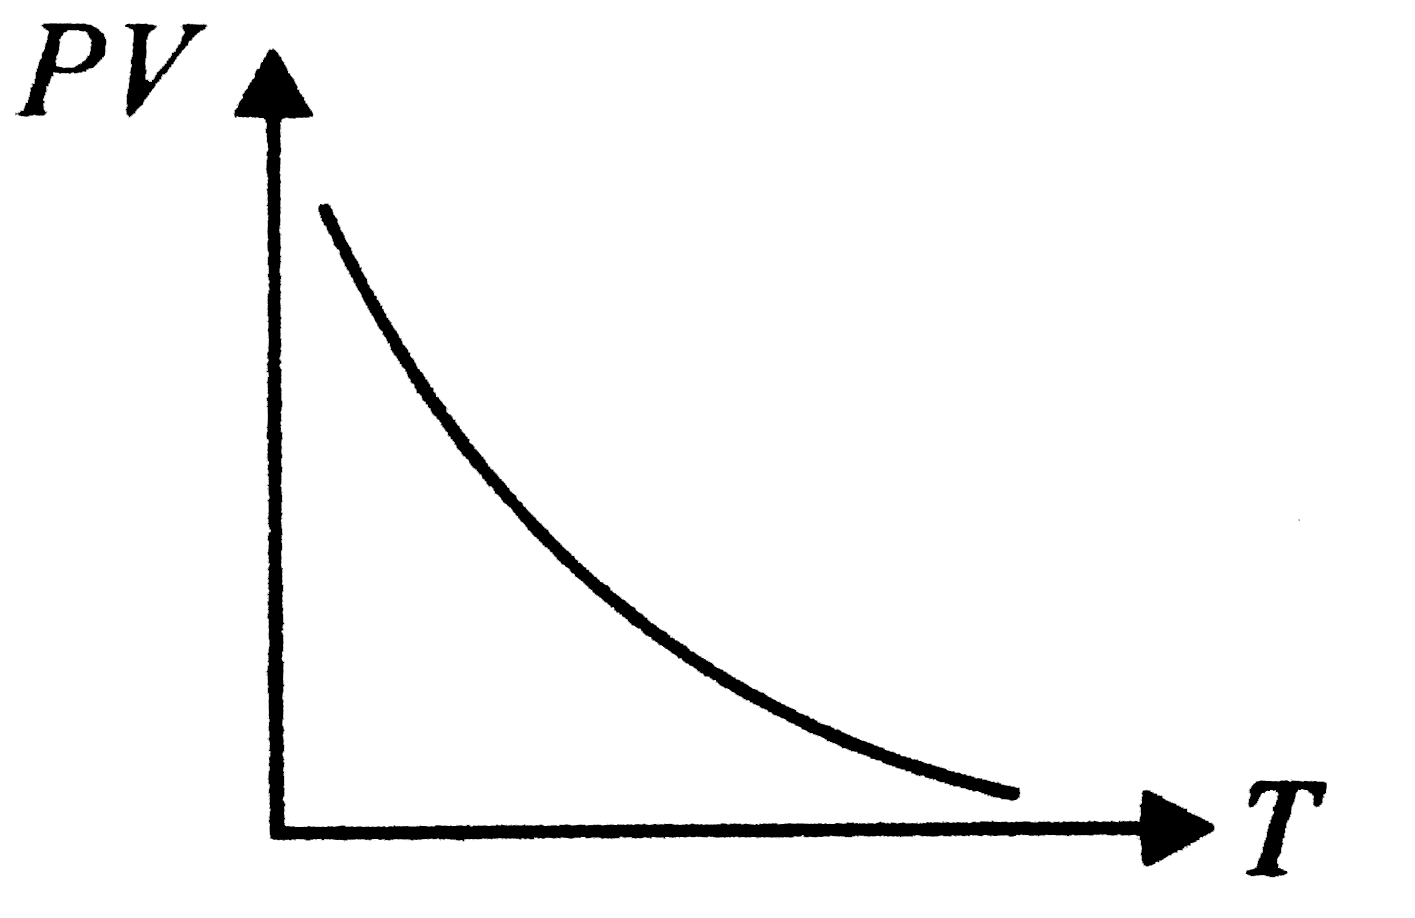
Draw a V-I graph for a conductor at two different temperatures. What conclusion do you draw from your graph for the variation of resistance of the conductor with temperature ?
View SolutionWhat inferences would you derive from the following observations?
dipole moment of H2O is 1.85 D.
View SolutionWhat inferences would you derive from the following observations?
dipole moment of BF3 is zero.
View SolutionWhich of the following graphs is consistent with ideal gas behaviour?
View SolutionDraw a bar graph from the following data:

View SolutionFor the following table, draw a bar-graph

View Solutionwhich one of the following graph is not correct for ideal gas ?
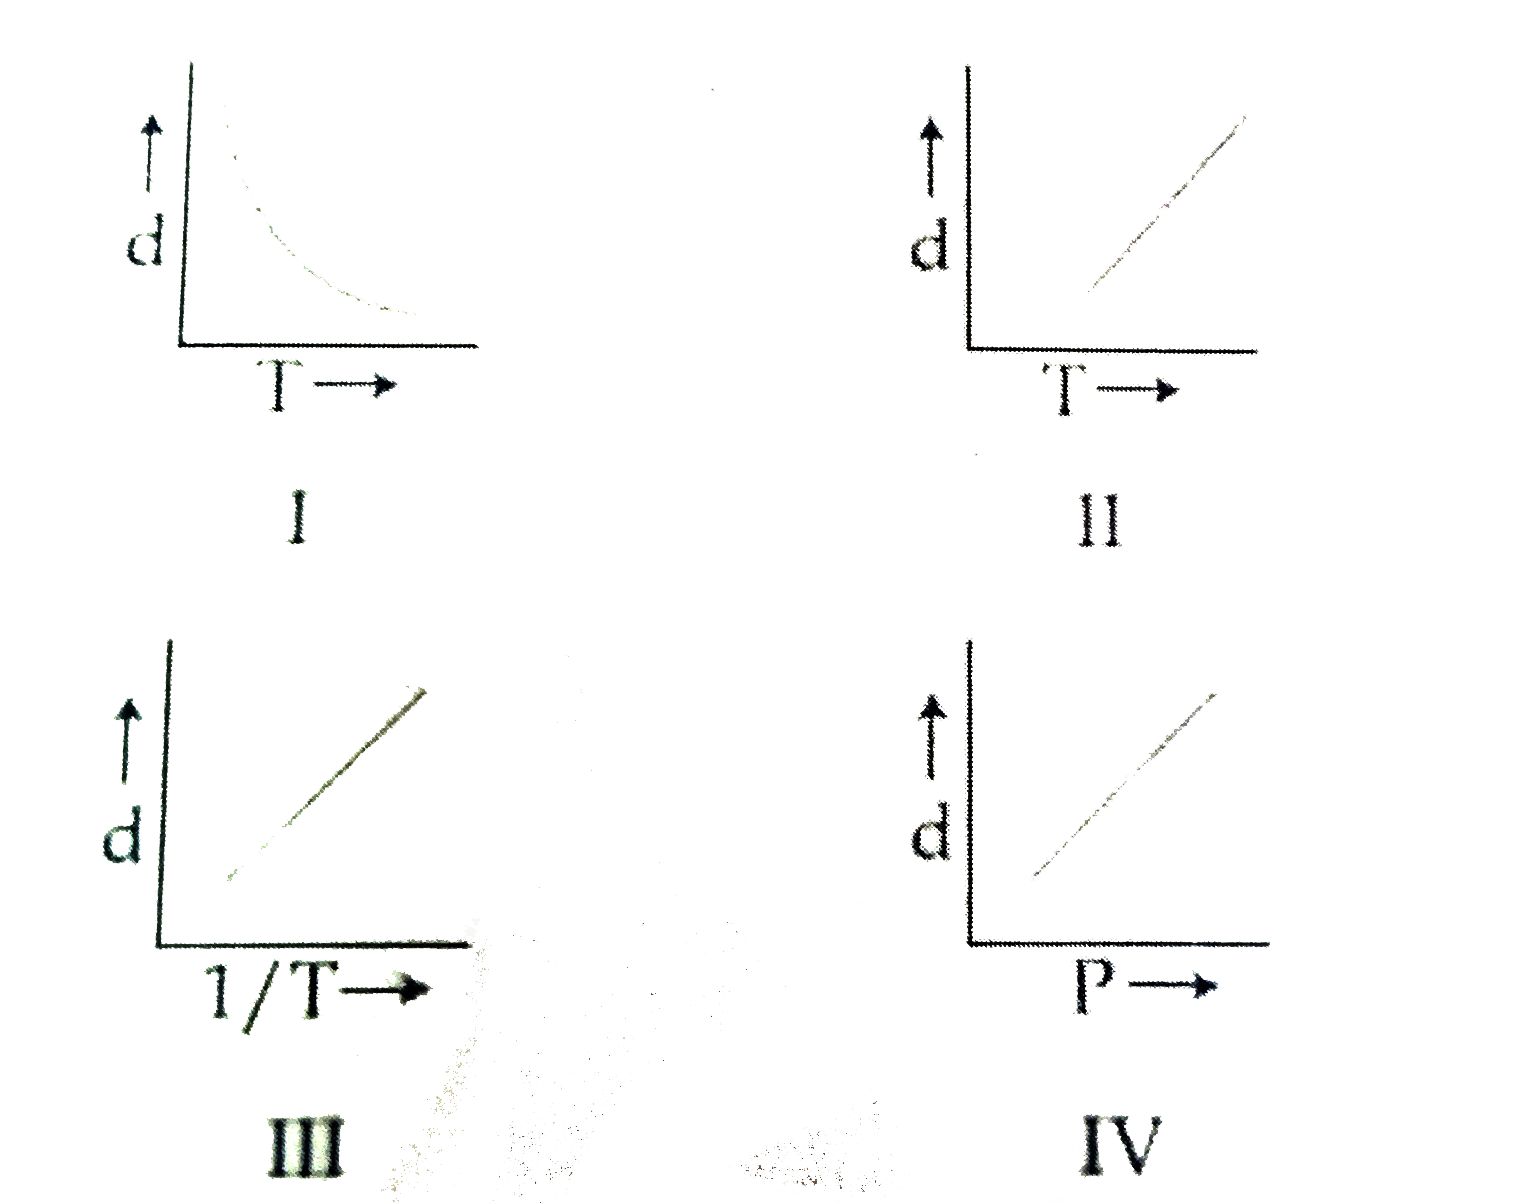
d=density ,P=pressure,T=Temperature
View Solution

